Pike County sits between two major river systems, but its 2025 land-cover map is dominated by a different color: agriculture. Cropland and related agricultural cover account for 65.80% of the county, while forest covers 23.00%. Four maps on this page separate the overall land-cover pattern, forest and farmland, impervious surfaces, and mapped class differences between 1985 and 2025.
The four original JPG maps are available together in one download. For a quick county overview, start with the general land-cover map. Use the forest-and-farmland view to compare cultivated areas with wooded corridors, the impervious map to locate harder surfaces such as roads and rooftops, and the change map when the question is how the two classification dates differ.
Table of Contents
What stands out across Pike County
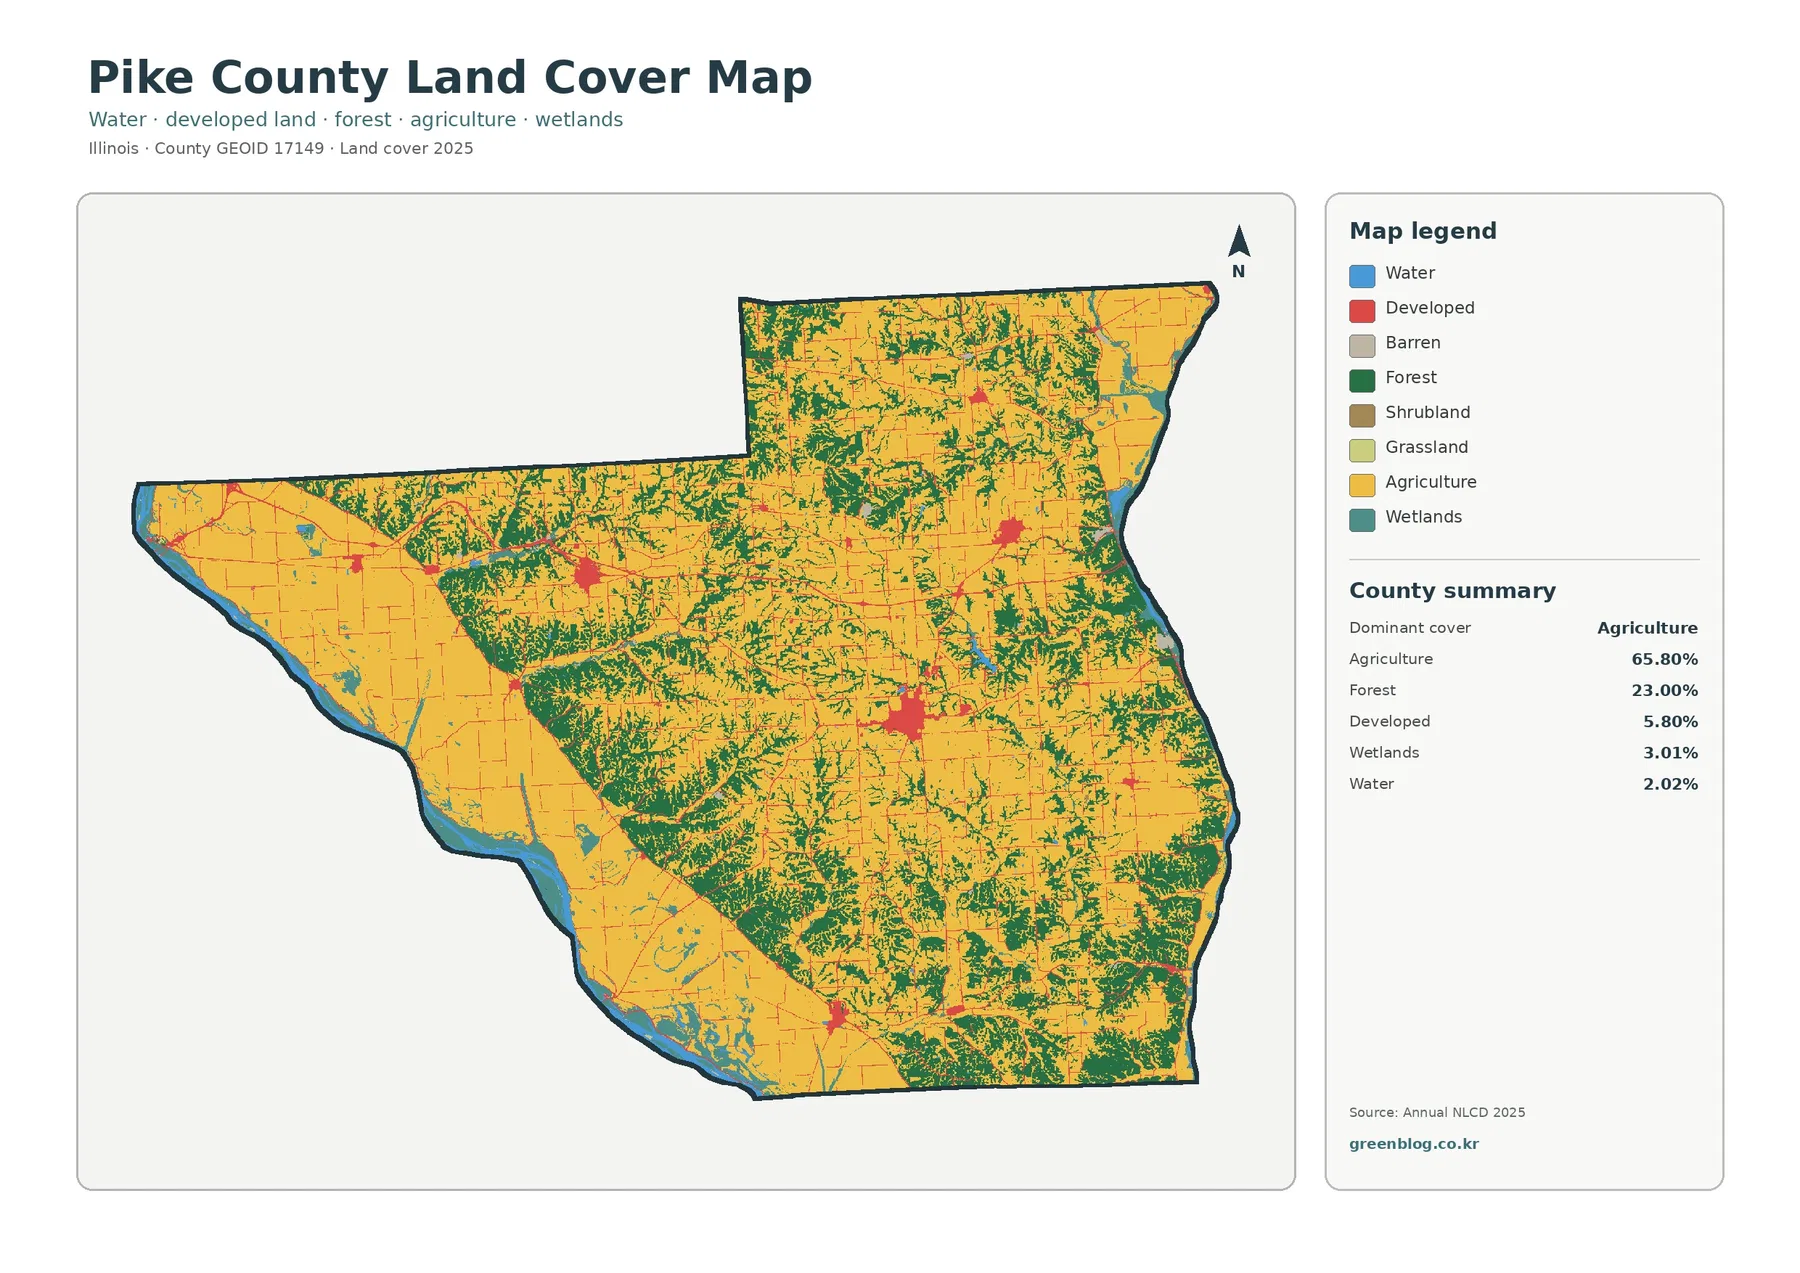
The 2025 summary reports 65.80% agriculture, 23.00% forest, 5.80% developed land, 3.01% wetlands, and 2.02% water. Grassland and shrubland are much smaller at 0.12% and 0.05%. Those percentages make Pike County an agricultural county in broad terms, yet the map does not look like one continuous field. Wooded cover repeatedly cuts through the agricultural matrix and becomes especially noticeable through the middle and southeastern portions of the county.
A trusted Illinois water-resource report describes Pike County as lying between the Mississippi and Illinois Rivers. That setting helps explain why water and wetland classes are visually important along the county edges even though they occupy a much smaller share than agriculture or forest. The land-cover map itself does not label rivers or towns, so it should be paired with a reference map when exact place names are important.
Land cover should not be confused with zoning or legal land use. These maps classify what is on the ground—such as crops, forest, developed surfaces, wetlands, and water—using remotely sensed data. They do not show parcel ownership, building rights, property lines, or whether a particular tract can be developed.
Farmland is broad, but the forest pattern is intricate
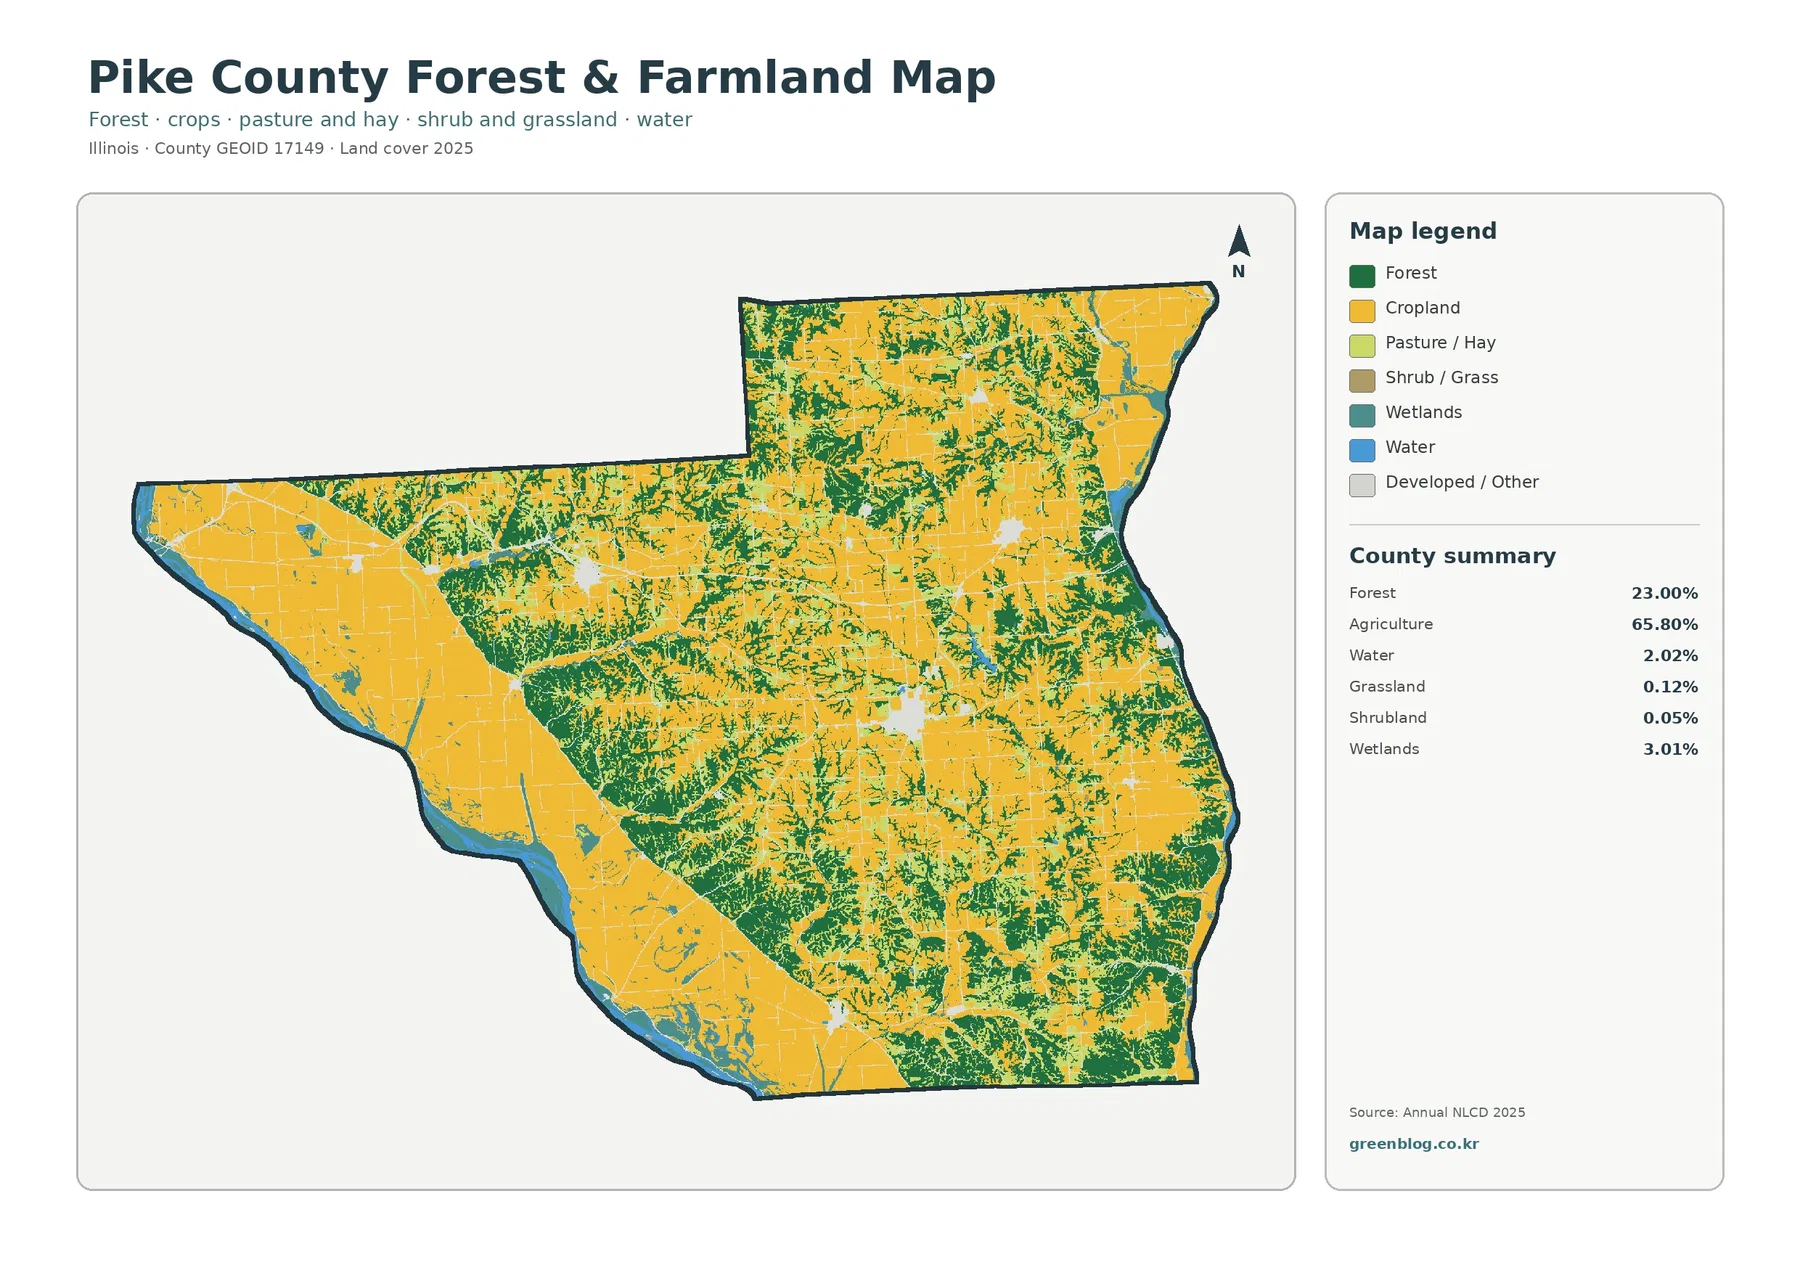
The forest-and-farmland map makes the contrast much easier to see. Large agricultural blocks dominate much of the western and northern county, while forest appears as branching belts and irregular patches through the center and toward the southeast. The boundary between the two is often complex rather than straight, which matters when the goal is to describe the landscape rather than simply quote countywide percentages.
Forest covers 23.00% of Pike County. Its arrangement is as important as the total. Instead of one isolated forest block, wooded areas appear repeatedly as narrow corridors, branching shapes, and larger clusters. That pattern can be useful in environmental education or habitat discussions because it shows how wooded cover is distributed within an otherwise heavily agricultural county.
Agriculture accounts for 65.80%, but this map does not identify crop species, yields, field ownership, or soil capability. The forest-and-farmland view is best for showing where broad agricultural cover and wooded areas meet. A detailed agricultural analysis would require additional information such as soils, crop statistics, conservation practices, or field-level records.
Water and wetlands have a small share but a strong edge presence
Water covers 2.02% of the county and wetlands 3.01%. Their combined share is far below agriculture or forest, yet they stand out because many mapped water and wetland cells follow the outer edges of the county and several interior drainage features. Along the western and southwestern boundary, the blue and wetland colors form long connected bands.
This edge pattern is easier to understand with Pike County’s location between the Mississippi and Illinois Rivers in mind. Still, the map should not be treated as a legal wetland inventory. A cell classified as wetland in a land-cover dataset does not by itself establish regulatory status, jurisdiction, or a development restriction. Those questions require current agency wetland, floodplain, and permitting information.
For classroom use, the general map can be compared with the forest-and-farmland version to see where water, wetlands, woodland, and agriculture come together. The comparison is useful for landscape interpretation, but the map resolution is not intended for measuring a stream channel, locating a levee, or deciding where a parcel boundary meets a wet area.
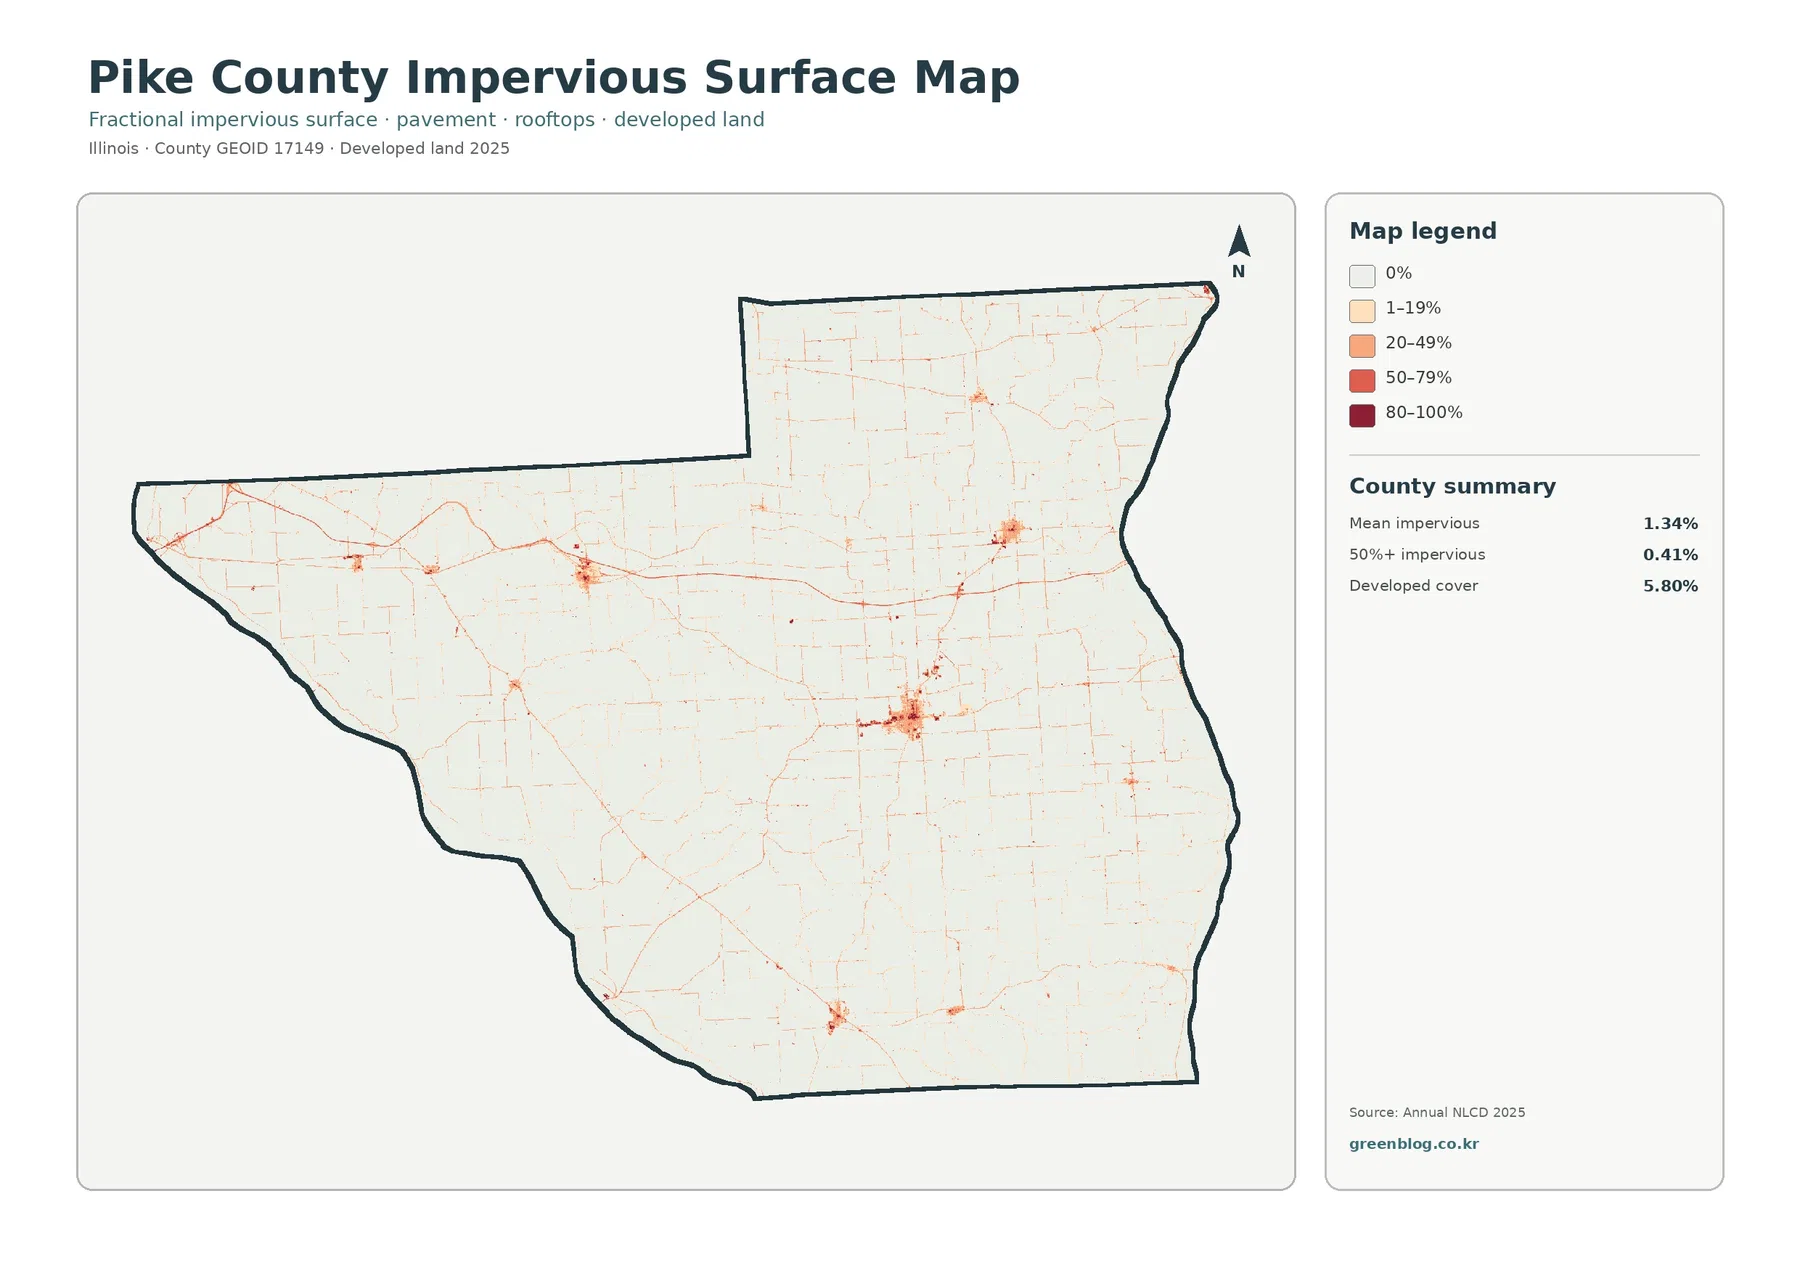
Developed cover is 5.80%, while mean impervious cover is 1.34%
Pike County’s developed land share is 5.80%, but the mean impervious value is only 1.34%. These numbers measure different things. A developed land-cover class can include lawns, trees, and other nonpaved surfaces within a developed setting, while the impervious layer estimates the fraction of a cell covered by surfaces such as pavement and rooftops.
Most of the county appears in the zero or low impervious classes. Thin lines trace the road network, and several settlement clusters stand out as warmer colors. The largest visible concentration is near the center-right of the county map, with smaller clusters elsewhere. Pike County’s official website identifies Pittsfield as the location of county government offices, but this land-cover image contains no town labels, so unlabeled clusters should not be assigned place names solely from the image.
Only 0.41% of the county is mapped at 50% impervious or greater. That helps distinguish the broad 5.80% developed-land category from the much smaller area covered by highly concentrated hard surfaces. For drainage engineering, street design, or building-level analysis, a higher-resolution road, building, or stormwater dataset would be more appropriate.
The 1985–2025 map records class differences, not a single story of change
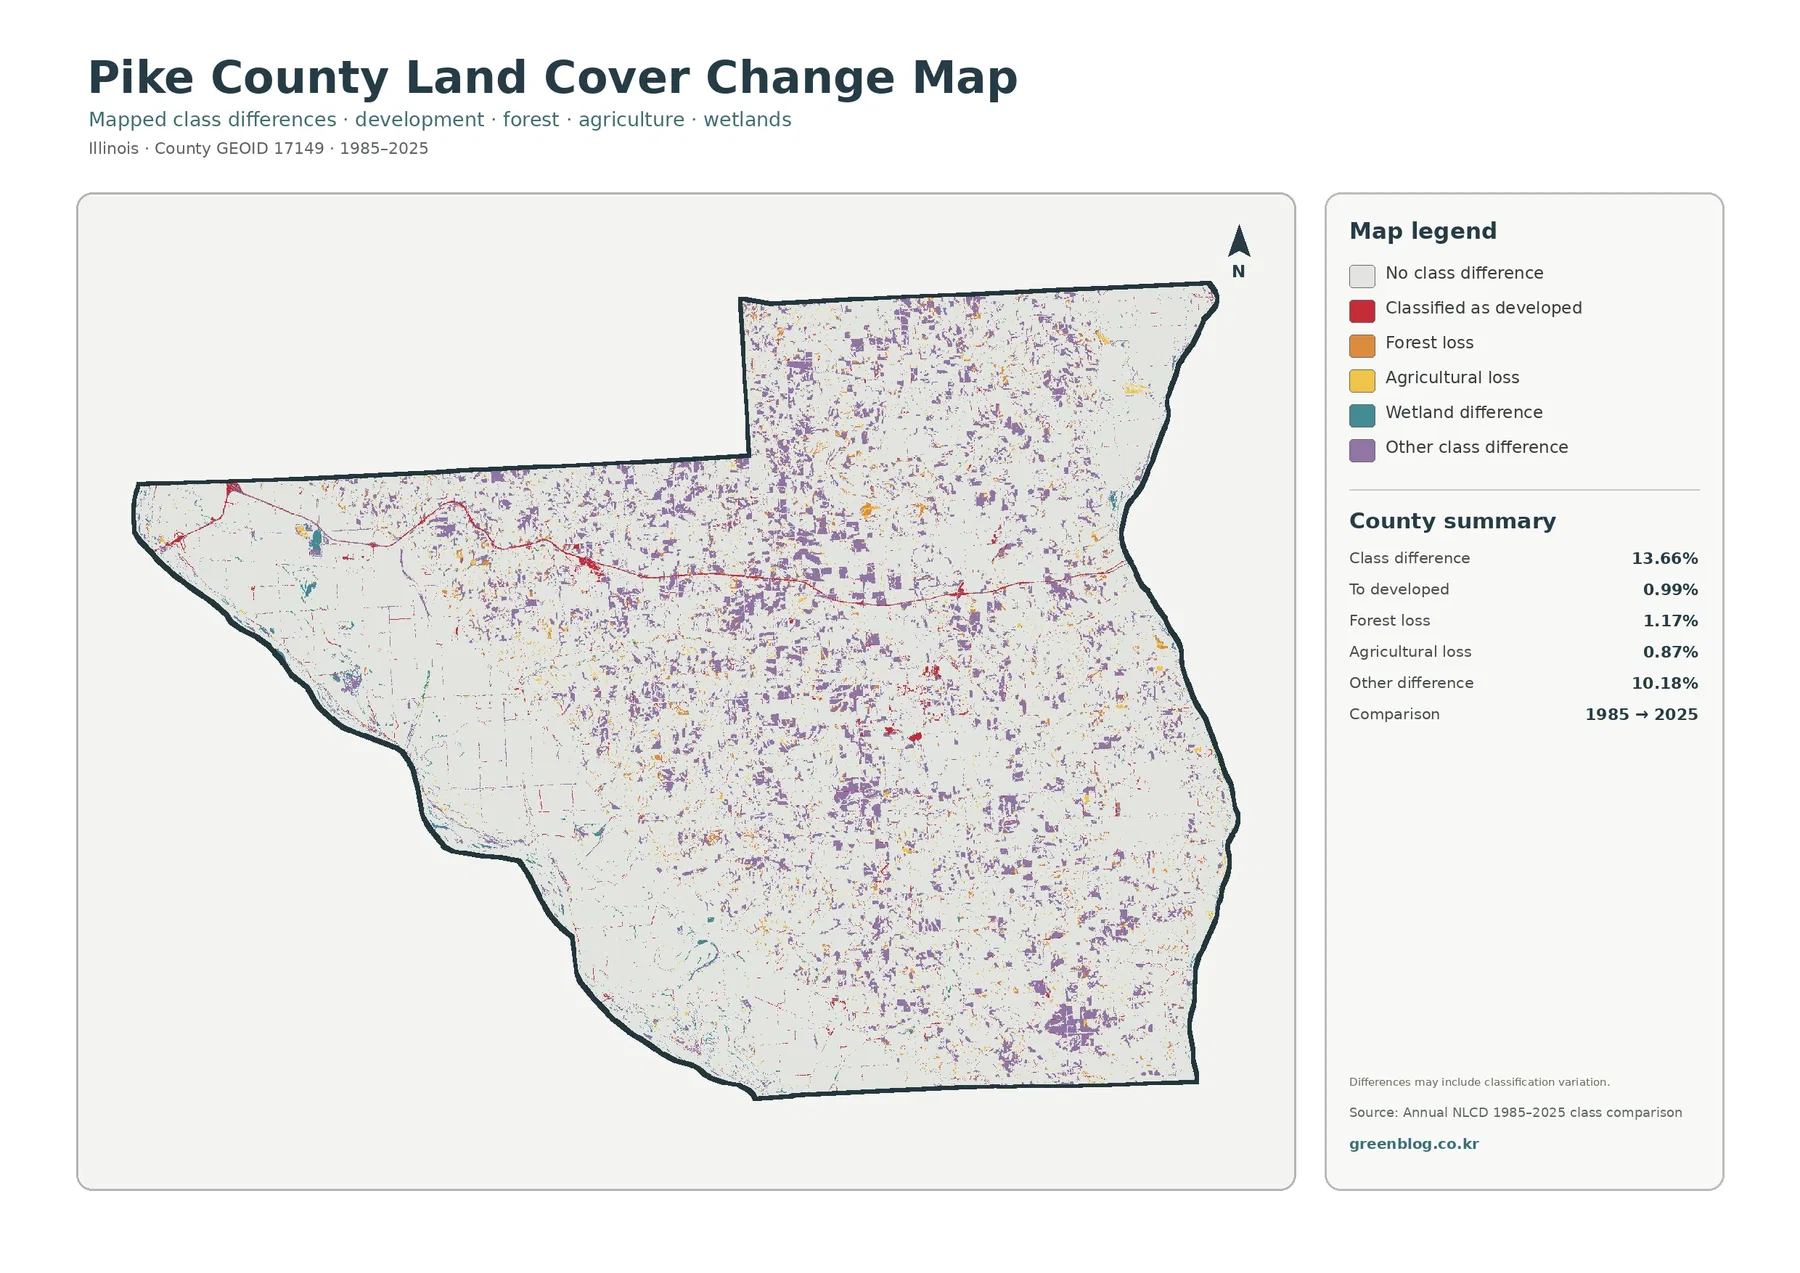
The change map reports that 13.66% of the county has a different mapped class between 1985 and 2025. The summary separates 0.99% classified as developed, 1.17% forest loss, 0.87% agricultural loss, and 10.18% other class difference. Wetland differences and other categories account for the remaining portion of the total.
The most important number is not necessarily the total 13.66%. The map warns that differences can include classification variation, and the 10.18% ‘other class difference’ category makes up most of the mapped difference. That means the graphic should not be described as showing that 13.66% of Pike County was physically converted to a new land use.
The 0.99% classified as developed is more directly related to development classification, but even that figure comes from comparing two mapped datasets. If a project requires evidence of a particular subdivision, road project, forest clearing, or field conversion, the next step should be dated aerial imagery, local permits, parcel records, or another source that documents the specific event.
A practical way to use all four maps
For a presentation about Pike County, the overall land-cover map works well as the first figure because it establishes the countywide balance of agriculture, forest, development, wetlands, and water. The forest-and-farmland map can follow when the discussion moves to how cultivated land and wooded corridors are arranged. Keeping both maps at a similar size makes it easier to compare the same areas.
The impervious map is most useful when the focus shifts from broad development classes to hard surfaces. A dark developed patch on the general map does not automatically mean a fully paved area; the impervious view helps separate dense hard surfaces from lower-density developed land. For a historical comparison, the change map should come last, accompanied by a note that mapped class differences are not equivalent to verified causes of land-use change.
The downloadable archive contains four original JPG files, each 2480×1754 pixels. Using one large map at a time is usually more readable than shrinking all four onto one page, especially when the legend matters. The files can be used in lessons, reports, presentations, county profiles, and comparative land-cover projects.
Resolution, classification, and legal limits
Annual NLCD is designed for consistent land-cover comparison over broad areas. Like other raster products, it divides the landscape into grid cells. Small roads, narrow water features, field edges, and mixed vegetation can therefore be generalized. A single cell may represent a dominant class even when several surface types are present within the same ground area.
The maps on this page use 2025 land cover and a 1985–2025 class comparison. Conditions can change after the observation date, and recent construction, vegetation removal, flooding, or agricultural changes may not be represented. The map is a useful landscape reference, not a substitute for a current survey or field inspection.
Pike County’s official GIS page also states that its public mapping is for reference and should not be used as a legal description. The same caution is appropriate here. Property boundaries, zoning decisions, wetland jurisdiction, building permits, and other legal questions require the current records maintained by the responsible agencies.
Frequently Asked Questions
What is the largest land-cover class in Pike County?
Agriculture is the largest class at 65.80% in the 2025 summary. Forest is second at 23.00%, followed by developed land at 5.80%, wetlands at 3.01%, and water at 2.02%. The map is strongly agricultural, but the branching forest pattern remains a major visual feature.
Does the 13.66% class difference mean that much of the county was physically converted?
No. The change map compares classification results for 1985 and 2025, and it notes that classification variation can contribute to the difference. Other class differences account for 10.18%, so the total should not be presented as a verified land-use conversion rate.
Can this map be used to decide whether a parcel can be developed?
No. Land cover describes the mapped surface condition, not zoning, ownership, parcel boundaries, easements, or permit eligibility. A development decision should use current county GIS, property records, zoning and flood information, and the appropriate regulatory agencies.
Map File Information
Download the four original JPG maps for Pike County: 2025 land cover, forest and farmland, impervious surface and developed land, and 1985–2025 land-cover class differences.
- Included Files: Four original JPG land-cover maps
- File Type: JPG files in one ZIP archive
- Intended Use: Printing, education, presentations, and map-based projects
Related Maps
- Adams County Illinois Land Cover Map
- Alexander County Illinois Land Cover Map
- Bond County Illinois Land Cover Map
Sources and References
- MRLC Annual NLCD Data
- USGS Annual NLCD Land Cover Classification
- U.S. Census Bureau TIGER/Line Shapefiles
- Pike County, Illinois official website
- Pike Soil & Water Conservation District
- Pike County Illinois GIS Maps
Green Map creates custom-edited map images using open geographic data sources such as geoBoundaries, Natural Earth, OpenStreetMap, and government open data. These maps are edited visual materials, not raw data files, and are provided for education, documents, presentations, and graphic reference.