Piatt County is one of the clearest farm-dominated landscapes in this Illinois map series. Agriculture accounts for 89.00% of the 2025 land-cover summary, yet the county is not a uniform block of cropland. A narrow green-and-teal corridor runs from the southwest through the central part of the county toward the northeast, while developed land concentrates around Monticello and several smaller settlement clusters. Those contrasts become much easier to understand when the four map views are compared together.
This page pairs a general 2025 land-cover map with a forest-and-farmland view, an impervious-surface map, and a 1985–2025 class-difference map. The WebP images are the page previews; the download box below provides the four original 2480×1754-pixel JPG maps in one ZIP. Use the general map for the countywide mix, the forest view for the Sangamon River corridor, the impervious layer for built intensity around Monticello, and the change map when the question is how mapped classes differ between the two comparison years.
Table of Contents
A farm county shaped by one narrow river-and-forest corridor
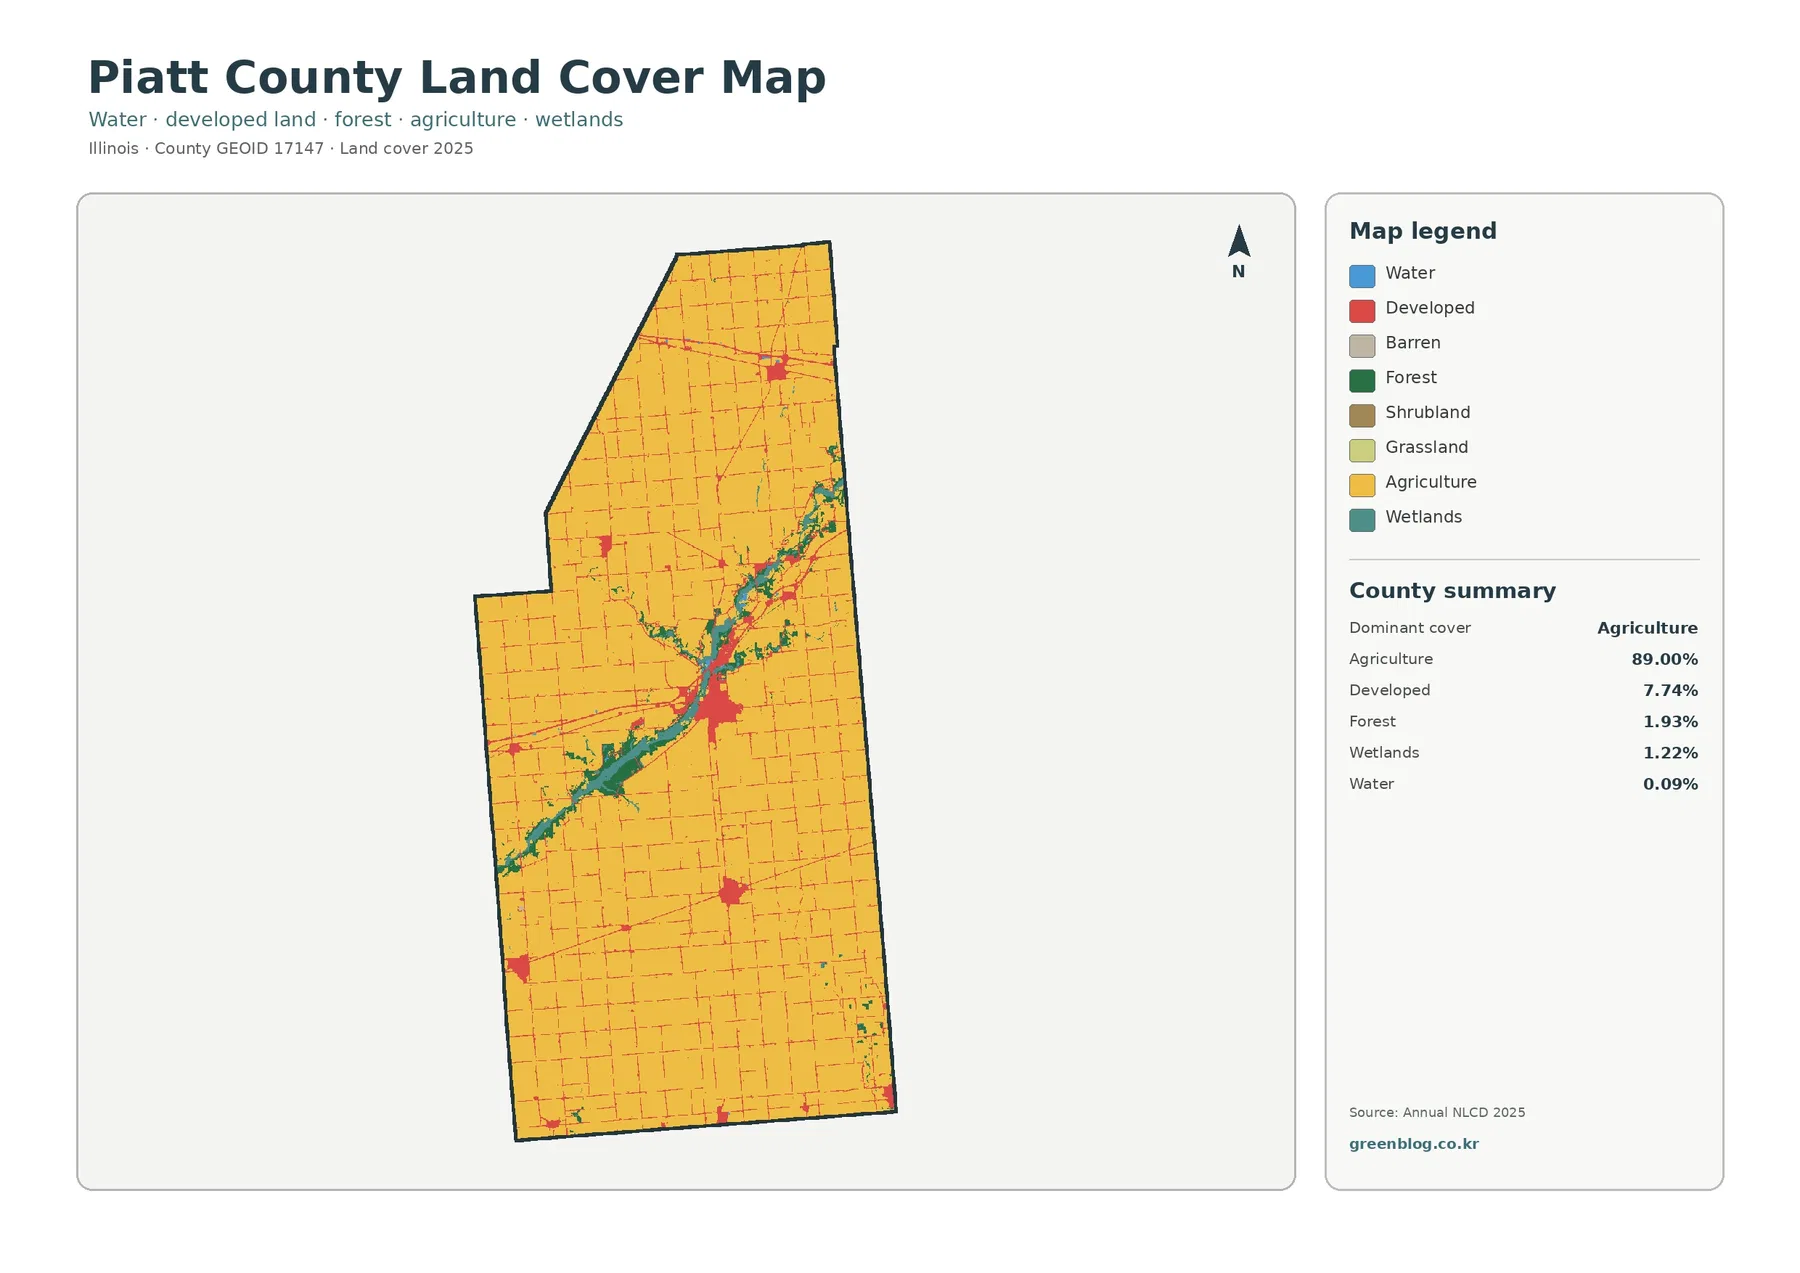
The county summary leaves little doubt about the dominant cover. Agriculture is 89.00%, followed by developed land at 7.74%, forest at 1.93%, wetlands at 1.22%, and water at 0.09%. Across the north and south, broad yellow fields fill nearly every space between the road grid. Piatt County’s own government website describes the county as being “in the heart of agricultural America,” and its county-facts page separately reports roughly 91% cropland. That local figure is not the same dataset or classification as Annual NLCD, but both sources point to the same basic landscape: farming is the overwhelming land-cover context.
The small nonagricultural shares matter because they are not spread randomly. Forest, wetlands, and water gather into a long, irregular band that crosses the central county. It widens near Monticello and continues toward the northeast, with smaller branches extending into surrounding farmland. Illinois Department of Natural Resources material for Monticello’s Sangamon River and the Upper Sangamon River describes floodplain and upland forest along this stream corridor. That local information helps explain why the green and teal cover appears as a connected feature rather than as isolated woodland dots.
Developed land has a different shape. The largest red cluster sits in the central county around Monticello, where several linear developed features converge. The Piatt County Comprehensive Plan places Monticello near the county center and notes development along I-72, Illinois 47, Illinois 105, and railroads. The map does not label those routes individually, so the safest reading is that the current developed cover and the official planning description point to the same central settlement area. It would go beyond the map to say that any one route directly caused the development.
Several smaller built clusters interrupt the farm landscape as well. Near the northern tip, a compact developed area fits the location of Mansfield, which the county plan describes along U.S. 150 south of the I-74 interchange. Farther south, other compact red patches are separated from one another by large areas of agriculture. The overall picture is therefore not suburban sprawl across the county. It is a highly agricultural landscape with a few settlement centers and thin transportation-related developed lines.
The forest-and-farmland map pulls the Sangamon River setting out of the crop grid
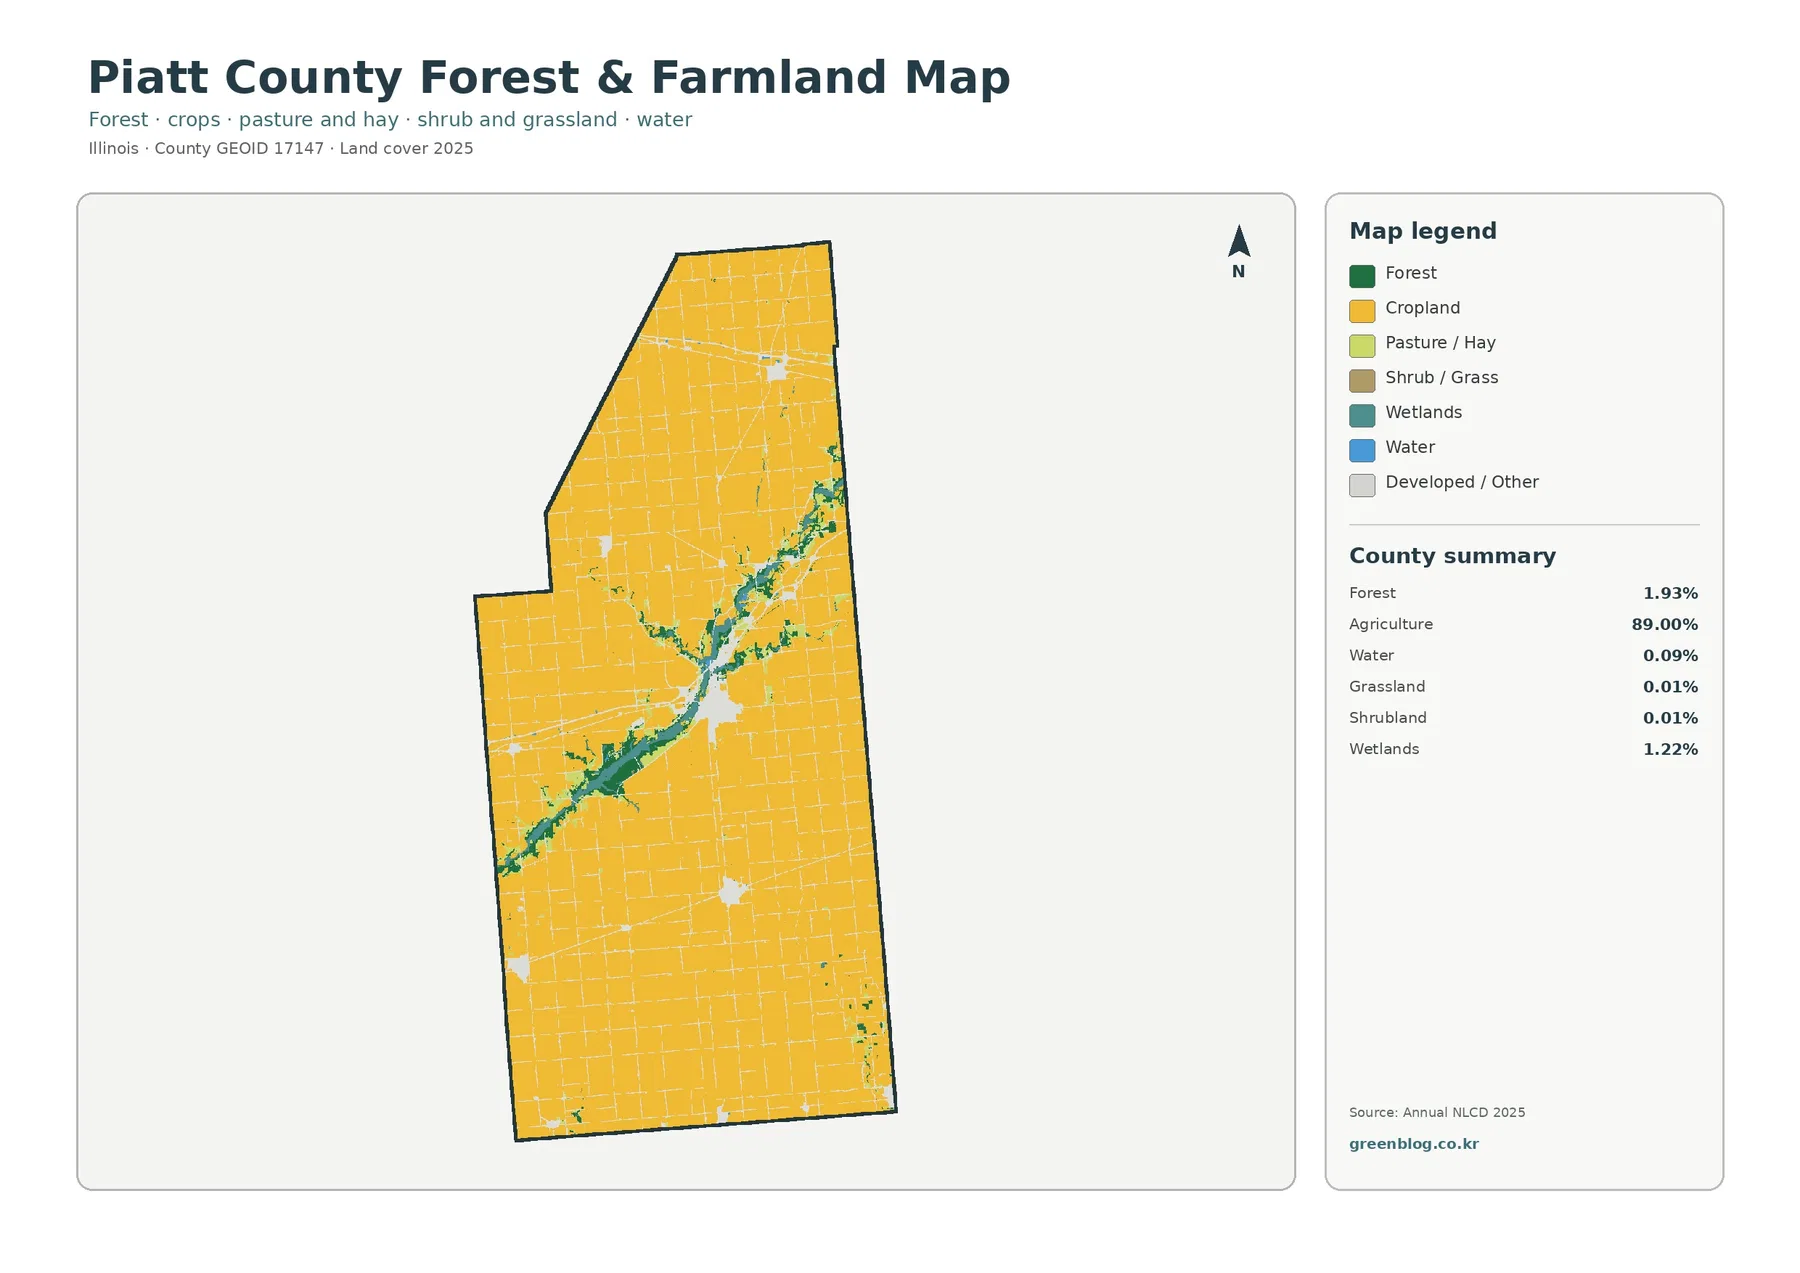
Removing the strong developed-land color makes the rural-natural contrast easier to see. Cropland fills most of the map, but the wooded corridor through the center becomes more continuous. South and southwest of Monticello, dark green forest expands into broader patches before narrowing again. Wetlands sit beside or within parts of the same corridor. Toward the northeast, the pattern continues as smaller bands and branches surrounded by agriculture.
Forest is only 1.93% of the county, yet its location gives it more visual influence than that number might suggest. A small percentage can still create a long geographic feature when the cover is concentrated along a stream and its slopes. The DNR description of Monticello’s Sangamon River notes wet floodplain forest as well as upland forest. The Upper Sangamon River reserve description likewise identifies bottomland forest in flood-prone areas and upland forest on slopes and bluffs. Those descriptions fit the map’s narrow but connected green pattern without requiring the map itself to identify every individual woodland parcel.
Wetlands account for 1.22%, while water is only 0.09%. Those shares are small, but the teal and blue classes appear close to the forest corridor rather than evenly across the farm grid. Grassland and shrubland are each listed at only 0.01%, so they are not major countywide categories in this summary. For a reader interested in habitat or watershed context, the useful comparison is therefore not “forest versus grassland.” It is the relationship among cropland, the wooded river corridor, wetlands, and the narrow water class.
None of these classes should be mistaken for zoning or ownership. Agriculture is a mapped surface class, not proof that a particular parcel is legally restricted to farm use or planted in a specific crop. Forest does not mean public forest, and wetlands on the land-cover map are not a jurisdictional wetland determination. Piatt County’s GIS, zoning records, parcel data, and specialized environmental sources serve different purposes. The land-cover maps are best used for countywide pattern recognition and comparison.
Hard surfaces stay concentrated in Monticello and small settlement cores
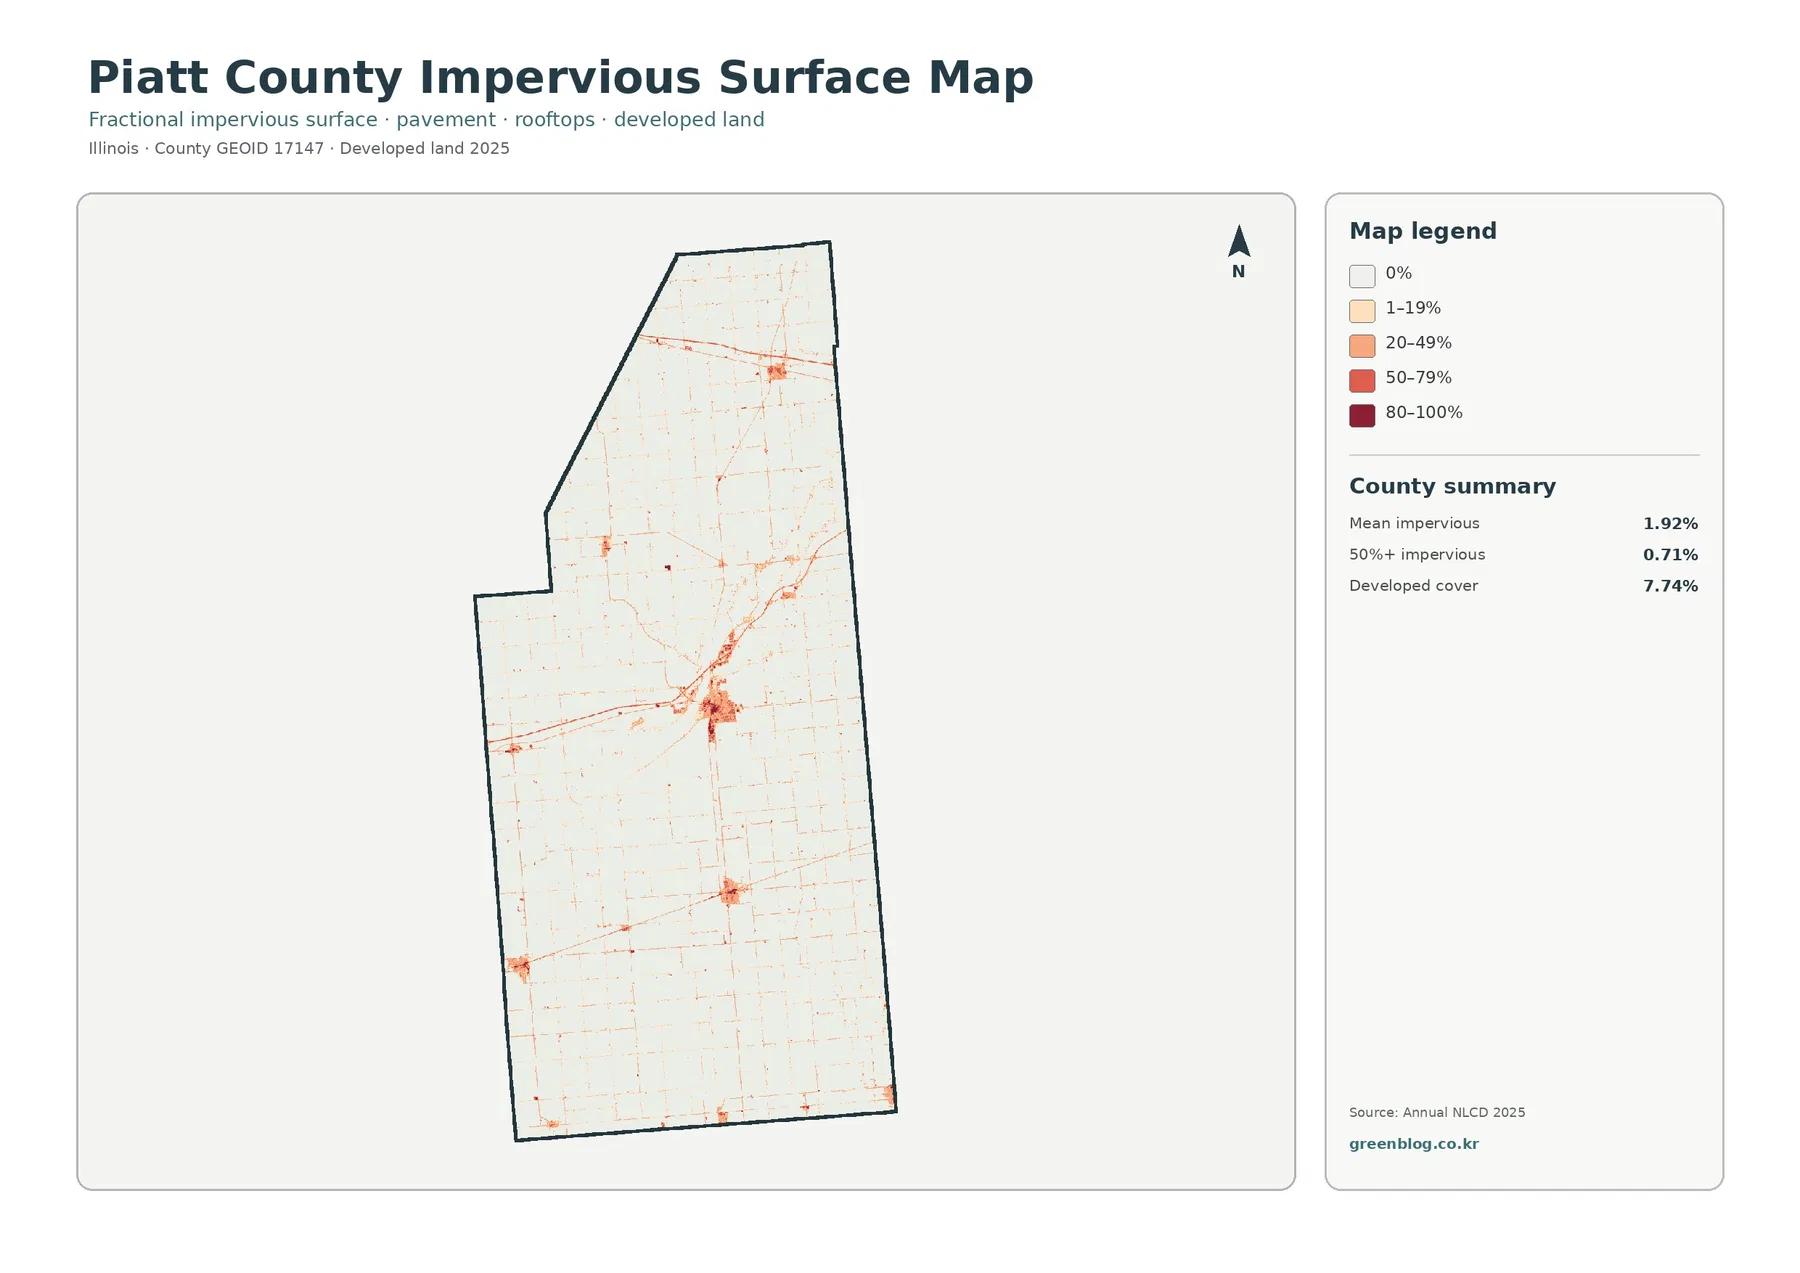
Impervious surface is a narrower concept than developed land. It measures hard surfaces such as pavement and rooftops that do not readily absorb water. Piatt County’s mean impervious value is 1.92%, and only 0.71% of the county is mapped at 50% or more impervious. Developed cover, by contrast, is 7.74%. The gap is expected because a developed land-cover class can include lawns, trees, soil, and other pervious surfaces around buildings and roads.
Monticello stands out most clearly. The darkest red values occupy a compact core, while lighter 20–49% and 1–19% values spread outward along streets and connecting corridors. Thin orange-red lines cross the surrounding farm area and converge on the central cluster. This is where the impervious map adds information that the general land-cover view cannot provide: it shows that the hardest surfaces occupy a much smaller footprint inside the broader developed class.
The northern settlement cluster is much smaller, and several additional dots appear farther south and west. Their hard-surface cores are isolated by large expanses of nearly white agricultural land. This pattern is consistent with a county whose population and built infrastructure are concentrated in towns rather than distributed continuously across the countryside. Again, the map supports a statement about location and concentration; it does not by itself identify a specific building, subdivision, or construction project.
For watershed or runoff discussions, the contrast between 89.00% agriculture and a 1.92% mean impervious surface is useful. It shows why a county can have visible towns and an extensive road network while still maintaining a very low countywide hard-surface average. A presentation about Monticello can focus on the local dark values, while a countywide comparison should keep the much larger agricultural context visible so the developed core is not exaggerated.
Only 3.43% differs between the 1985 and 2025 mapped classes
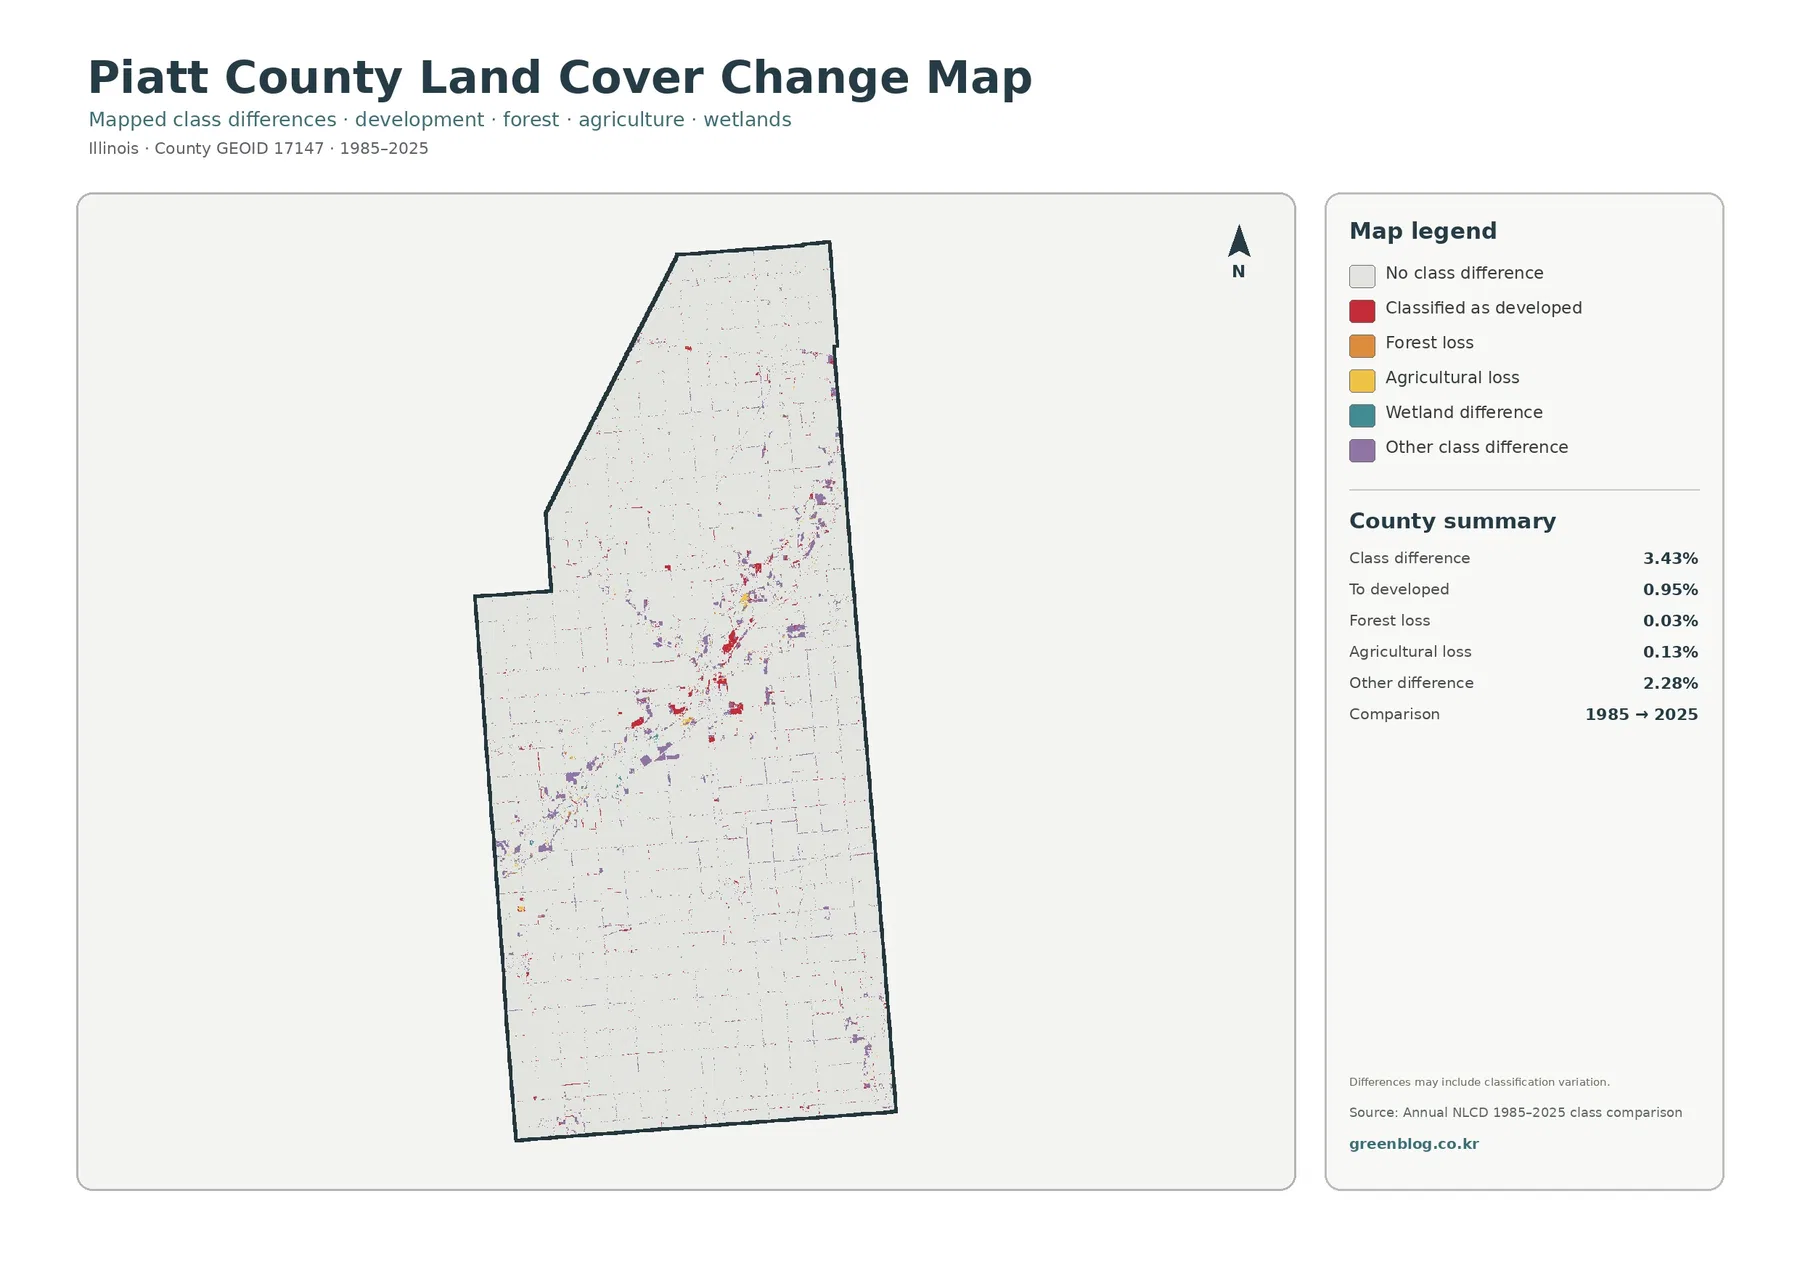
The change map reports a total class difference of 3.43% between 1985 and 2025. Most of the county is therefore shown as having no class difference in this comparison. The colored pixels become more frequent in and around the central corridor, with additional scattered patches toward the northeast and around settlement areas. Large southern and northern farm blocks remain comparatively quiet on the map.
The components matter more than the total alone. The summary lists 0.95% classified as developed, 0.03% forest loss, 0.13% agricultural loss, and 2.28% other class difference. “Other” is the largest component by a wide margin. That makes it inappropriate to describe the full 3.43% as new development, forest clearing, or farmland conversion. The map is showing several kinds of class differences, not one single land-use process.
Red developed-class differences are visible around Monticello and several smaller built corridors, while purple other-class differences occur around the river corridor and in scattered patches elsewhere. Orange forest-loss and yellow agricultural-loss pixels are sparse. The figure also warns that differences may include classification variation. A boundary between agriculture, forest, wetland, and water can shift between datasets because of imagery, season, pixel placement, or classification decisions even when the actual landscape change is modest.
For that reason, this map works best as a screening layer. It can direct attention to places where the 1985 and 2025 classes do not match, but it cannot establish the exact year, cause, or legal nature of a change. If a parcel-level question matters, historical aerial photography, local permits, land records, or a more detailed time series would be needed. The small 0.03% forest-loss value is particularly important to keep in perspective: it is a mapped class summary, not a complete inventory of every tree removal or woodland-management event over forty years.
A useful four-map workflow for Piatt County
Begin with the general land-cover map when the question is simply what covers Piatt County in 2025. It establishes the 89.00% agricultural context and places developed land, forest, wetlands, and water in the same frame. The next map should depend on the question rather than follow a fixed order. If the topic is the Sangamon River, move to the forest-and-farmland view. If the topic is Monticello’s built footprint, switch to the impervious-surface map.
The forest view is especially effective for showing why 1.93% forest can still be geographically important. It removes much of the visual competition from the developed class and reveals the long green corridor through the farm landscape. The impervious layer does the opposite: it suppresses land-cover classes and concentrates attention on hard surfaces. Comparing those two maps at the same location around Monticello shows a river-associated natural corridor passing close to the county’s largest built cluster.
Use the 1985–2025 map only after the current pattern is clear. Its colors are differences, not present-day cover types. A purple pixel is not a current “purple land-cover class”; it is an other-class difference between the comparison years. The distinction is simple but important, especially in Piatt County where the 2.28% other-difference component is larger than developed, forest-loss, and agricultural-loss differences combined.
For a classroom handout or presentation, one large map plus one comparison map usually communicates more than four tiny images on a single page. A county-agriculture lesson can pair the general and forest maps. A community-development discussion can pair the general and impervious maps. A historical land-cover lesson can use the 2025 overview beside the change map, with the legend visible enough to distinguish current classes from comparison categories.
Printing, reference use, and the limits of the files
Each original JPG is 2480×1754 pixels. The asset manifest records that size as the original resolution, but it does not mark the files as meeting the package’s A3 high-resolution reference. Large-format printing should therefore be tested at the intended size rather than described as guaranteed A3-quality output. Enlarging the JPG can make the existing pixels bigger, but it cannot create road names, parcel boundaries, or finer land-cover detail that the source never contained.
The maps are appropriate for county introductions, environmental education, agricultural-landscape comparisons, watershed context, preliminary visual review, and presentation graphics. They are not substitutes for zoning maps, ownership records, property surveys, jurisdictional wetland determinations, flood maps, or development permits. Piatt County maintains a GIS system for property and location searches, and its zoning and comprehensive-plan resources answer questions that the land-cover layers were not designed to answer.
Local sources can also improve interpretation. The county’s comprehensive plan identifies Monticello and Mansfield in ways that match the major settlement positions visible on these maps. Illinois DNR provides a more detailed description of the Sangamon River’s forested corridor. Those sources add names and context, but the article still avoids assigning names to every unlabeled red patch, blue line, or wetland shape. When a feature is not identified by the map or a reliable external source, describing its position is more accurate than guessing.
The same restraint applies to the change layer. A red patch can be described as a place classified as developed in the comparison, but the map alone does not tell whether it represents a new house, a road, an industrial site, or a classification adjustment. Purple differences require even more caution because they combine other changes and may include classification variation. Keeping the interpretation within those limits makes the four-map set more useful for follow-up research rather than less useful.
Frequently Asked Questions
What is the dominant land cover in Piatt County?
Agriculture is the dominant 2025 class at 89.00%. Developed land follows at 7.74%, forest at 1.93%, wetlands at 1.22%, and water at 0.09%. The agricultural share is overwhelming, but forest and wetlands are concentrated along the Sangamon River corridor, making that central natural feature much more visible on the map than its small percentage alone suggests.
Why is Piatt County 7.74% developed but only 1.92% impervious on average?
Developed land is a land-cover category, while impervious surface measures the fraction covered by hard materials such as pavement and rooftops. Developed areas can contain lawns, trees, soil, and other surfaces that still absorb water. Piatt County’s mean impervious value is 1.92%, and only 0.71% of the county is mapped at 50% or more impervious, with the strongest values concentrated around Monticello and other small settlement cores.
Does the 3.43% 1985–2025 class difference mean 3.43% of the county was developed?
No. The 3.43% total includes 0.95% classified as developed, 0.03% forest loss, 0.13% agricultural loss, and 2.28% other class difference. The map also warns that classification variation may be included. The total should therefore be treated as a set of mapped class differences, not as a direct measurement of new development or one single land-use conversion.
Map File Information
The download combines four original JPG maps of Piatt County: 2025 land cover, forest and farmland, impervious surface and developed land, and mapped class differences from 1985 to 2025.
- Included Files: Four original JPG land-cover maps
- File Type: JPG files in one ZIP archive
- Intended Use: Printing, education, presentations, and map-based projects
Related Maps
- Adams County Illinois Land Cover Map
- Alexander County Illinois Land Cover Map
- Bond County Illinois Land Cover Map
Sources
- MRLC Annual NLCD Data
- USGS Annual NLCD Land Cover Classification
- U.S. Census Bureau TIGER/Line Shapefiles
- Piatt County official county facts
- Piatt County Comprehensive Plan
- Illinois DNR — Monticello’s Sangamon River
Green Map creates custom-edited map images using open geographic data sources such as geoBoundaries, Natural Earth, OpenStreetMap, and government open data. These maps are edited visual materials, not raw data files, and are provided for education, documents, presentations, and graphic reference.