Fayette County Alabama Land Cover Map shows a county where forest is the clear 2025 majority, while wetlands, agriculture, shrubland, and small developed areas break that wooded background into distinct local patterns. The supplied summary reports 58.97% forest, 11.05% wetlands, 10.39% agriculture, 7.07% shrubland, and 6.76% developed cover. A broad wetland-rich corridor is especially noticeable through the western half of the county, while the strongest developed concentration sits nearby rather than spreading evenly across the entire boundary.
This page includes four matching views: general land cover, forest and farmland, fractional impervious surface, and mapped class differences between 1985 and 2025. The original JPG set can be downloaded together from the page for reports, lessons, presentations, and county comparisons. Each source JPG is 2480 × 1754 pixels, and the browser previews use 1800 × 1273 WebP images. These are thematic land-cover graphics, not parcel, zoning, survey, or engineering maps.
Table of Contents
A forest majority surrounds a conspicuous wetland corridor
The 2025 land-cover view is dominated by dark green forest. It appears in large connected areas across the north, east, and south, and it also fills many spaces between agricultural and developed patches. Forest therefore acts as the most common surface condition rather than a narrow belt confined to one edge. At the same time, the county is far from uniform. Teal wetland cells form a broad, branching feature through the western and central portion of the map, creating one of the clearest contrasts with the surrounding forest.
Agriculture accounts for 10.39% of the county in the supplied 2025 summary. Yellow agricultural areas occur as many separate patches instead of one continuous farming district. Several larger groups appear in the northwestern and western portions, with smaller fields and open areas scattered elsewhere. Developed land reaches 6.76%. The largest red cluster is west of the county center, accompanied by a smaller developed concentration farther east and thin traces along connecting routes.
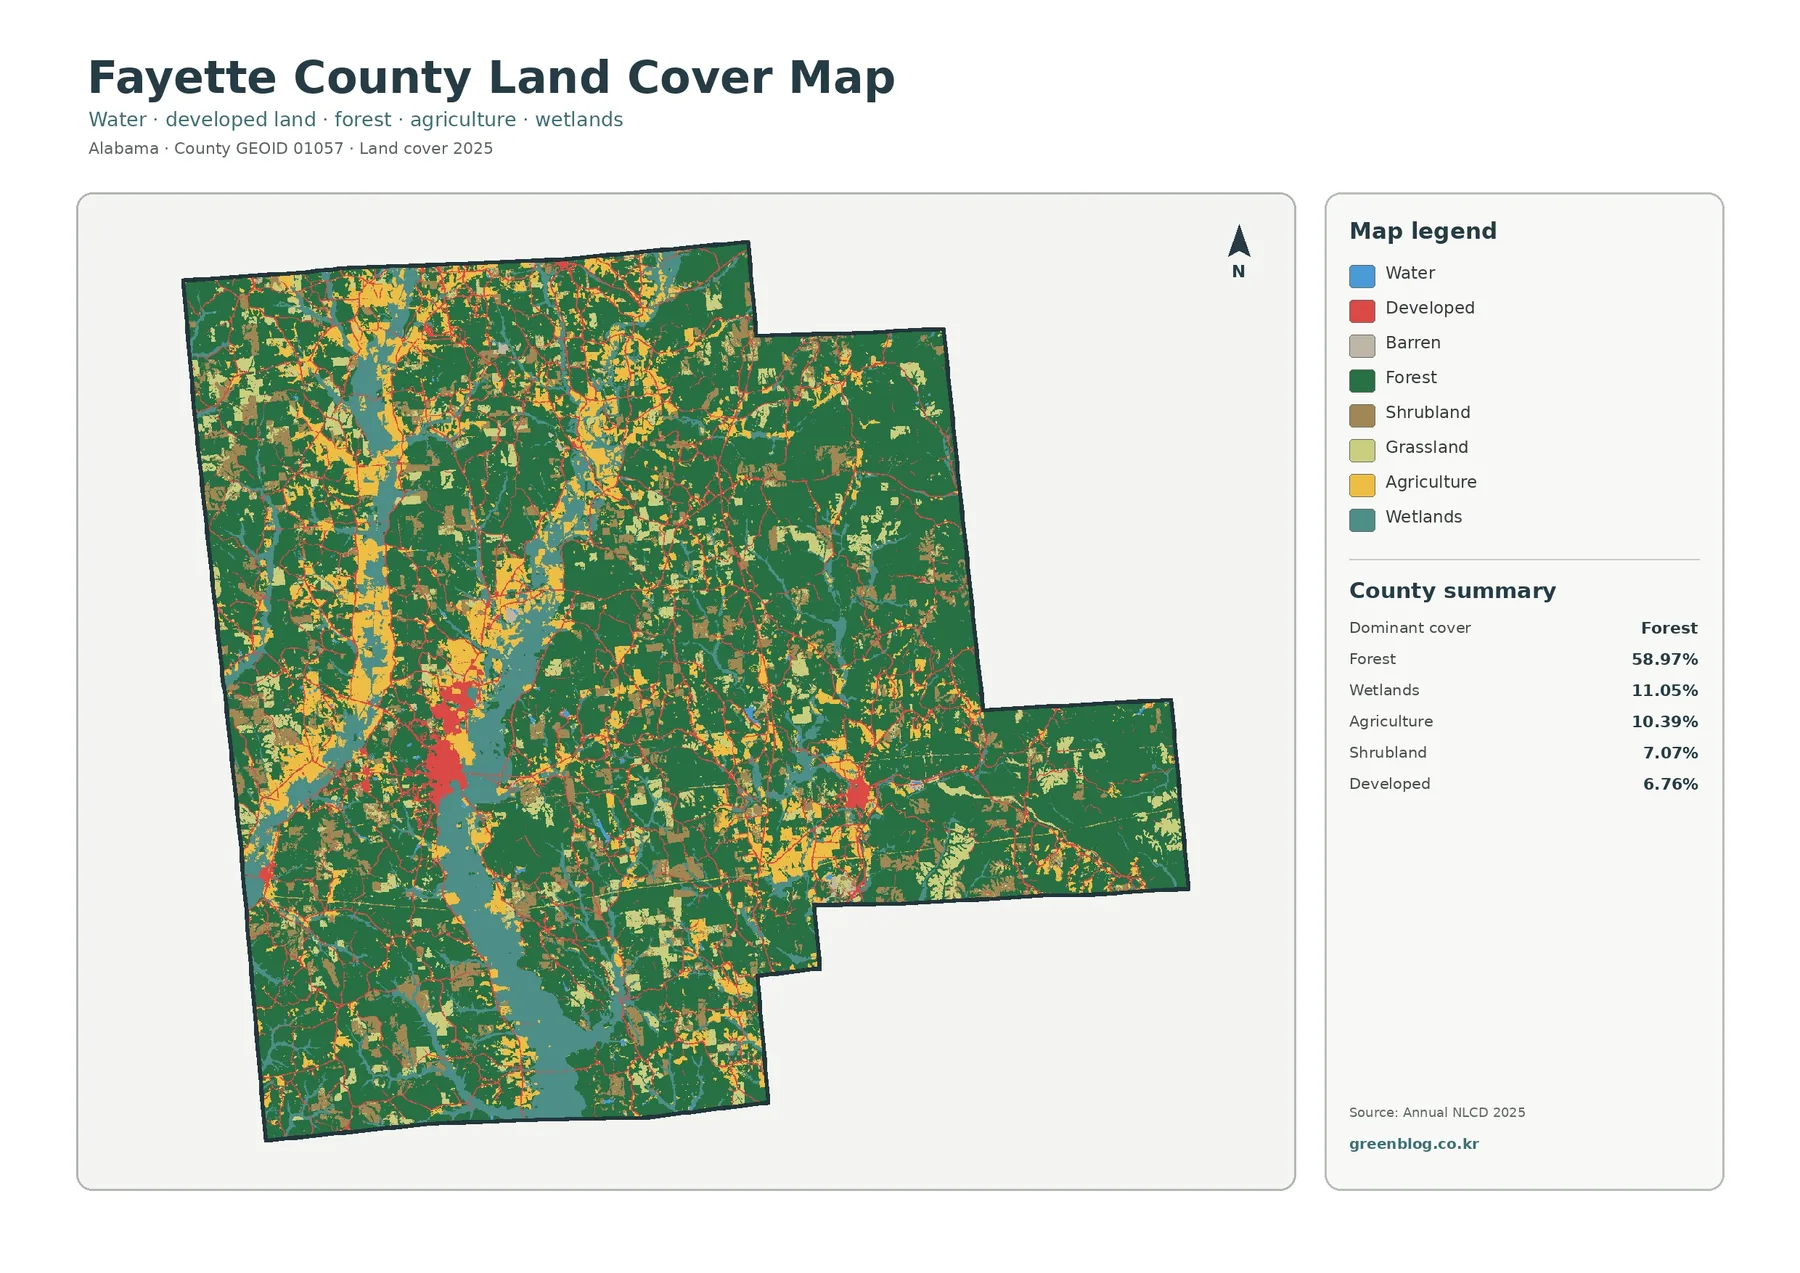
Water itself is only 0.25% in the forest-and-farmland summary, so the visually prominent blue-green corridor should not be described as open water alone. Much of that pattern is mapped as wetland. The distinction matters because open water and wetland are separate Annual NLCD classes. A wetland cell indicates a mapped surface class at the dataset scale; it does not establish a regulatory wetland boundary or determine whether a permit is required.
A 2014 Fayette County multi-hazard mitigation plan published through the Alabama Emergency Management Agency gives useful local context. It describes the county as part of the Cumberland Plateau, notes that the Sipsey River flows through the central part of Fayette County and that the North River crosses the eastern portion, and reports substantial forestland in the county. That older local plan should not replace the 2025 Annual NLCD values, but it helps explain why wooded land and water-related corridors are meaningful features when reading the current thematic maps.
The forest-and-farmland view makes rural differences easier to compare
Removing most developed colors from the second map makes the rural cover more legible. Forest remains 58.97%, while agriculture totals 10.39%. The legend separates cropland from pasture and hay, so the agricultural total is not one single visual class. Grassland is 5.37%, shrubland is 7.07%, wetlands are 11.05%, and open water is 0.25%. Developed or other surfaces are left pale, which makes the larger settled areas easier to recognize by contrast.
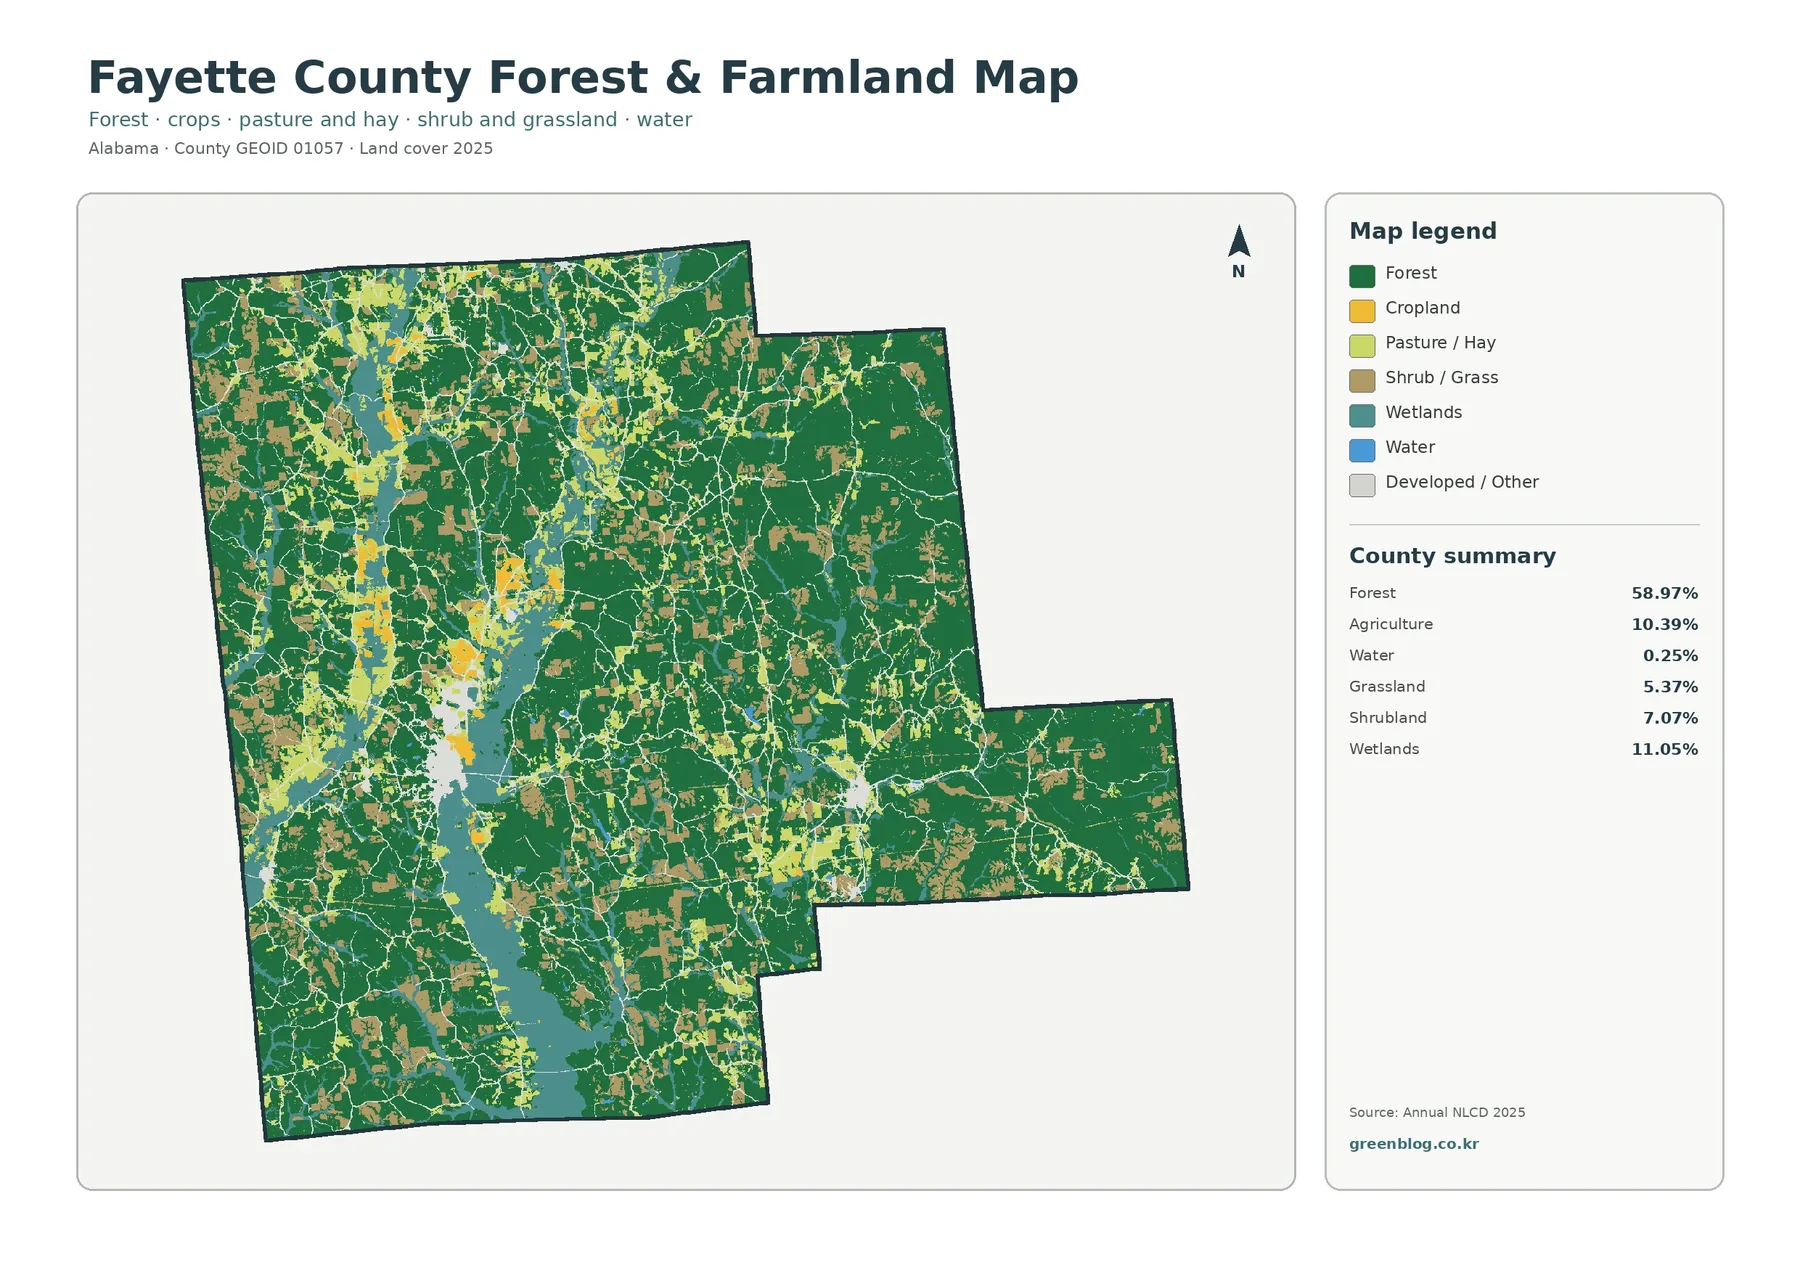
The strongest forest blocks are broad rather than isolated. Agricultural colors appear within and between them, often as compact field groups or narrow openings rather than a countywide farm belt. Wetlands form a more continuous north-south pattern in the western half than agriculture does. This difference is useful when the map is used for environmental education: a reader can compare a patch-based farming pattern with a more connected wetland corridor and a much more extensive forest matrix.
The map should still be treated as a generalized surface classification. A pixel categorized as cropland or pasture does not identify the landowner, crop species, farm business, tax classification, or legal land use. Likewise, forest color does not indicate public ownership, timber status, or conservation protection. For a site-specific question, use parcel records, current aerial imagery, field information, or the appropriate county and state records in addition to this map.
Hard surfaces occupy a small share and concentrate in a few places
The impervious-surface map narrows the question from “where is land developed?” to “where are pavement, rooftops, and other hard surfaces concentrated?” Fayette County’s mean impervious value is 1.00%. Only 0.23% of the county is mapped at 50% or greater imperviousness, even though developed cover accounts for 6.76% in the categorical land-cover summary. The gap is expected because developed land can include lawns, trees, bare ground, and other surfaces that still allow some water infiltration.
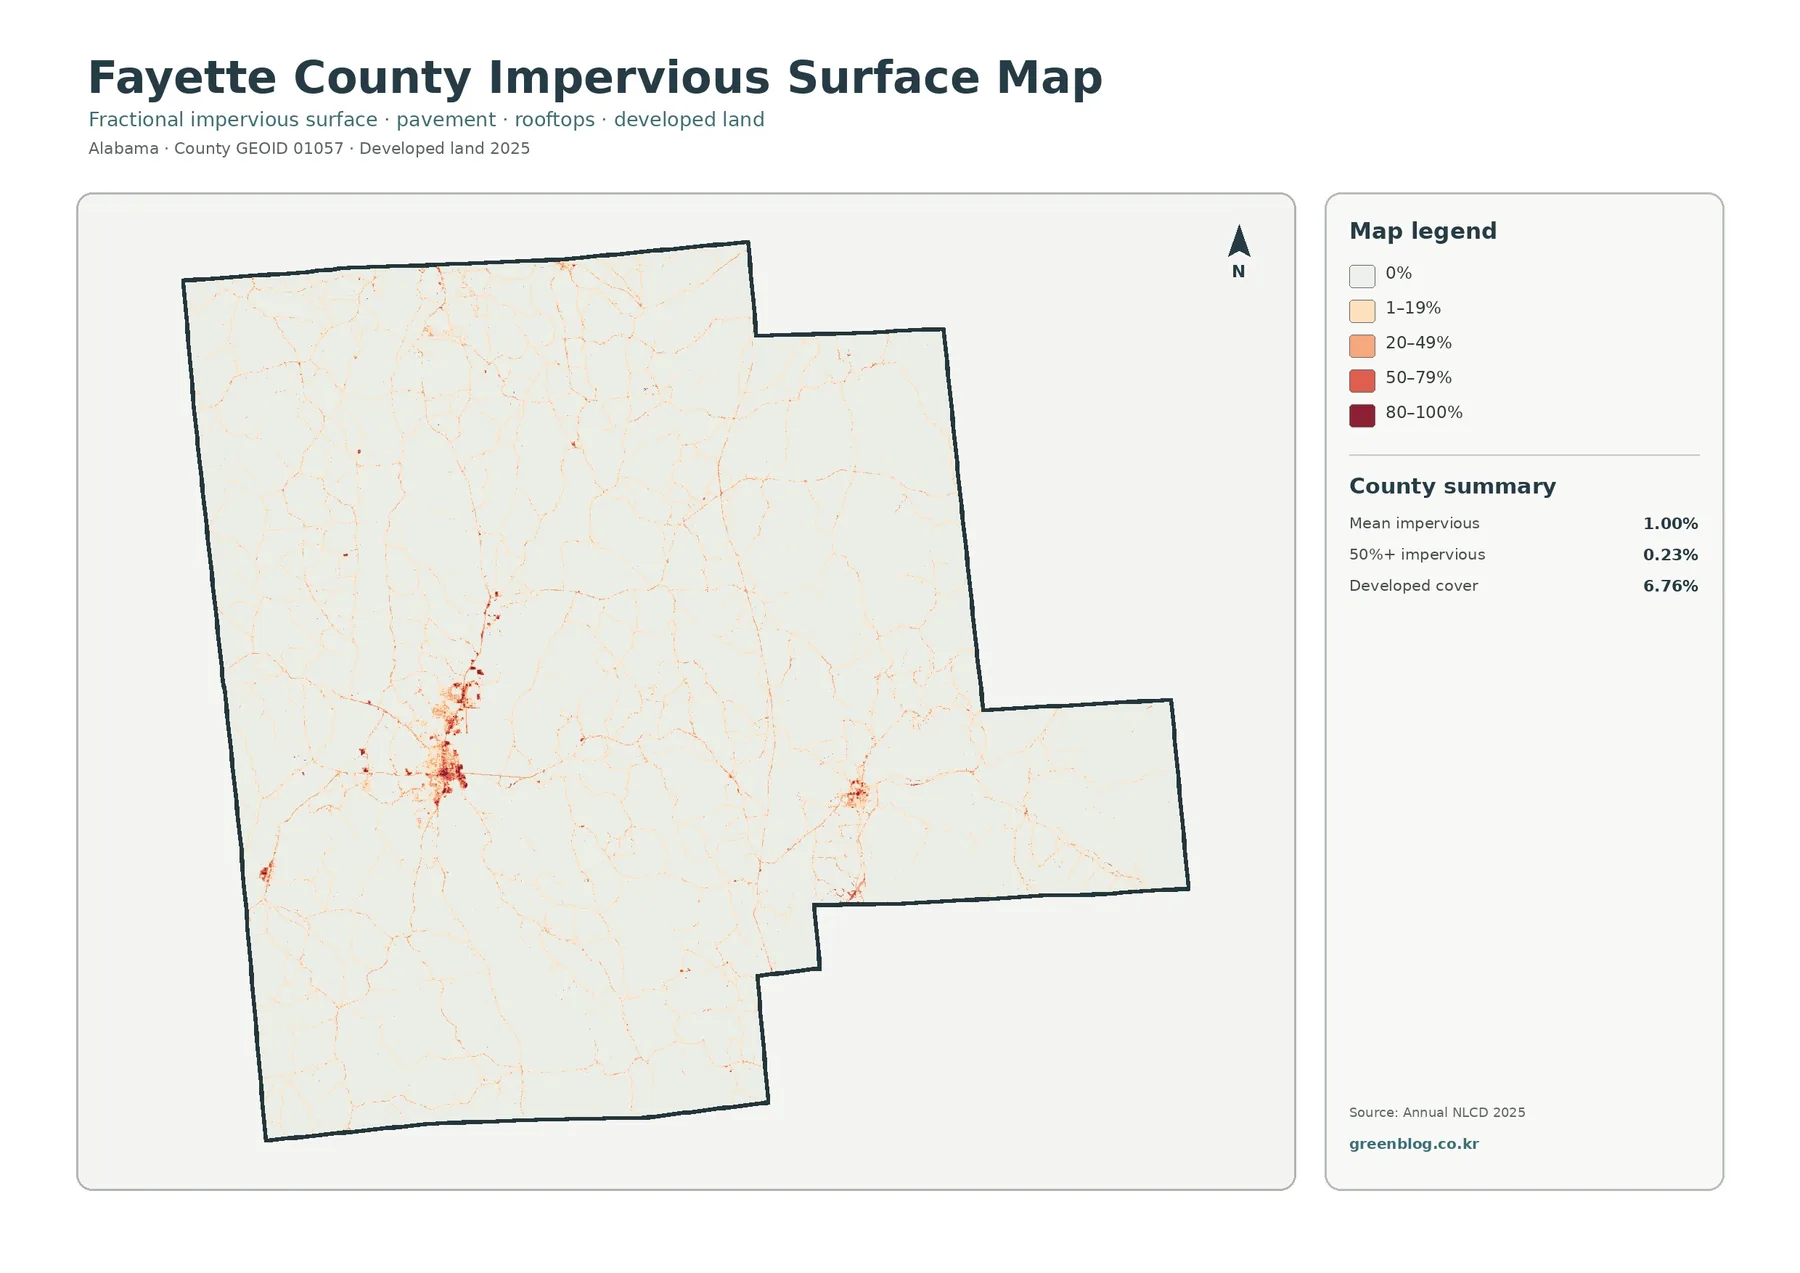
Most of the map is very pale, showing little or no mapped impervious surface. The strongest dark cluster appears in the west-central portion of the county, with a smaller concentration to the east and thin linear traces elsewhere. The 2014 county mitigation plan states that the most densely developed areas were within the Fayette city limits. That local statement is consistent with the presence of one dominant compact cluster, but the current impervious map should be used only to describe the 2025 mapped hard-surface pattern, not to assign municipal boundaries that are not drawn on this graphic.
This view is useful for broad stormwater and development comparisons because impervious surfaces can change how rainfall reaches the ground. It is not a runoff model. The image does not show drainage pipes, culverts, permitted outfalls, flow direction, detention basins, or site elevations. A dark pixel also does not establish a building footprint. The map is best used to find areas of concentrated hard surface before consulting more detailed infrastructure or engineering information.
Water-related cover is visible even though open water is a small percentage
One of the most distinctive features in the Fayette County maps is the amount and continuity of wetland cover. Wetlands account for 11.05%, which is larger than agriculture, shrubland, or developed land in the supplied summary. In the general and forest-focused maps, these wetland cells extend through a broad corridor and branch into surrounding wooded areas. Open water, by contrast, represents only 0.25% in the supplied forest-and-farmland summary.
The county mitigation plan names the Sipsey River and North River as important drainage features. Because the thematic images do not label individual waterways, the safest interpretation is to use that source as regional context rather than claiming that every wetland ribbon follows a specific named river. A hydrography overlay or current topographic map would be needed to identify exact channels. The land-cover maps answer the simpler question of where water and wetland surface classes appear in relation to forest, fields, and developed areas.
Wetland color also should not be treated as a legal jurisdiction line. Annual NLCD classifies land cover from remotely sensed and modeled information, while regulatory wetland determinations may require field indicators, soils, hydrology, and agency procedures. For teaching and countywide comparison, the 11.05% wetland share is useful. For construction, permitting, drainage design, or property due diligence, use the responsible federal, state, and local sources.
The 1985–2025 comparison identifies mapped differences, not a complete land-use history
The change map compares two endpoints, 1985 and 2025. The supplied summary reports a class difference across 44.17% of the county. Within the highlighted categories, 1.17% is classified as “to developed,” 11.62% as forest loss, 3.36% as agricultural loss, and 27.41% as other class difference. A wetland-difference class appears in the legend, but the map summary does not provide a separate countywide percentage for it.
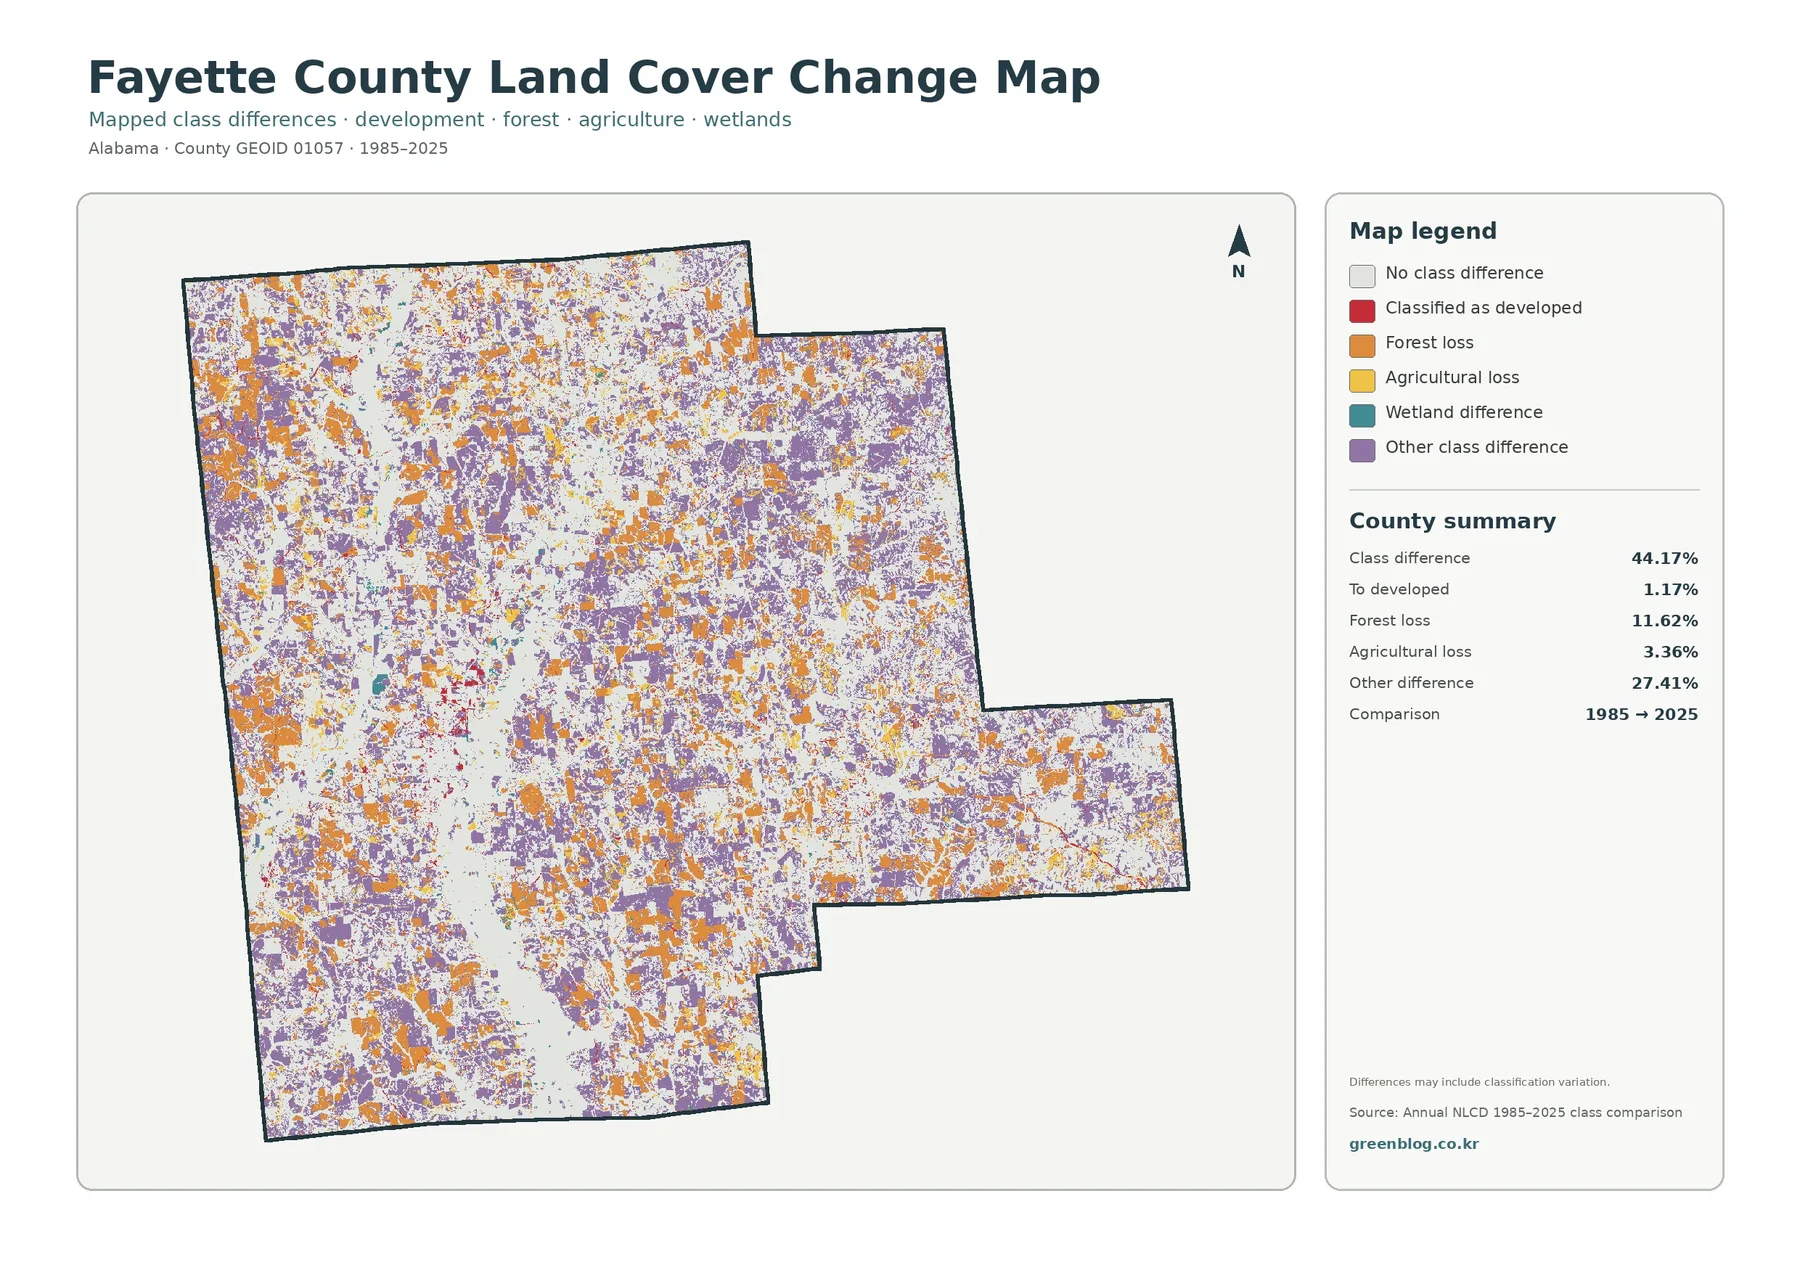
Orange forest-loss and purple other-difference cells are widespread across the map rather than limited to one developed center. Red “to developed” cells form much smaller clusters, especially near existing developed areas and along a few narrow traces. That visual balance matches the summary: the to-developed category is only 1.17%, while other class difference and forest loss account for much larger shares of the highlighted area.
The map itself warns that differences may include classification variation. This is essential. A change in cell class between the two endpoint maps does not automatically prove a physical conversion on the ground. Mixed pixels, seasonal vegetation, imagery quality, sensor differences, or revisions in classification methods can contribute to different labels. Some cells certainly may reflect real clearing, regrowth, farming changes, construction, or wetland transitions, but this two-date map cannot establish the cause or exact year.
For a historical study, use this comparison as a screening layer. Areas with dense highlighted differences can be checked against intermediate Annual NLCD years, historical aerial photographs, forestry records, local planning documents, or field evidence. If a project only needs a broad county profile, the map is still valuable because it shows where 1985 and 2025 classifications agree and where they do not.
A simple comparison order keeps unlike measurements from being mixed
Start with the general 2025 land-cover map to understand the full county composition. The forest-and-farmland view then separates the rural classes more clearly. After that, use the impervious map to measure the concentration of hard surfaces within developed areas. Finish with the 1985–2025 map to locate endpoint class differences. This order helps avoid treating a current developed cell as if it must represent new development since 1985.
The percentages also should remain tied to their own definitions. Developed cover is 6.76% in 2025, but only 1.17% is labeled as “to developed” in the endpoint comparison. Mean imperviousness is 1.00%, a third measure that describes hard-surface fraction rather than land-cover class. Forest is 58.97% today, while 11.62% is highlighted as forest loss between the two endpoints. These numbers answer different questions and should not be added or subtracted to create a single development or deforestation rate.
For comparisons with another county, match like with like: 2025 forest percentage to 2025 forest percentage, mean imperviousness to mean imperviousness, and endpoint class differences to the same endpoint comparison. Using the same measure and year keeps a presentation or school project understandable and reduces the chance that a visual difference is actually caused by different definitions.
The four original JPGs are ready for reference, lessons, and presentations
The downloadable set contains four original JPG images using the same Fayette County extent. A report can use the general map for an overview, the forest-and-farmland map for the rural landscape, the impervious map for concentrated development, and the change map for the long-term endpoint comparison. The consistent boundary makes the sequence easy to compare side by side.
Each JPG is 2480 × 1754 pixels. The package marks this as the original source resolution and does not claim that it meets a higher A3 reference standard. If the image is enlarged for a poster, check the legend and small text at the intended print size. Upscaling can make pixels larger, but it cannot add map detail that was absent from the source.
Check scale, date, and data purpose before site-level use
Annual NLCD land cover is raster data, meaning the county is divided into grid cells and each cell receives a representative class. At roughly 30-meter land-cover resolution, small roads, stream edges, narrow fields, buildings, and tree patches may share a cell with another surface. A crisp color boundary in the JPG therefore should not be read as a surveyed property boundary.
The current-cover maps represent 2025 conditions in the supplied package. Anything that changed after that observation year is outside the graphic. The change map uses only the 1985 and 2025 endpoints, so a place that changed several times in between may appear unchanged if it finished in the same class where it began. Conversely, a different endpoint class does not by itself explain when or why the change occurred.
Land cover is also different from legal land use. Forest does not identify timber ownership or conservation status; agriculture does not establish agricultural zoning or a specific crop; developed cover does not establish building rights; and wetlands do not replace a jurisdictional wetland determination. Use these maps for countywide description and preliminary comparison, then switch to current parcel, regulatory, survey, engineering, or field data when the decision depends on a specific site.
Frequently Asked Questions
What is the largest land-cover class in Fayette County?
Forest is the largest class in the supplied 2025 summary at 58.97%. Wetlands are next at 11.05%, followed by agriculture at 10.39%, shrubland at 7.07%, and developed land at 6.76%. The map also shows that these classes are distributed differently: forest is broad, wetlands form a noticeable corridor, and developed land is concentrated in a few smaller centers.
Why is developed cover 6.76% while mean imperviousness is only 1.00%?
The two measures describe different things. Developed land is a categorical cover class that can include lawns, trees, and other permeable surfaces. Imperviousness estimates the fraction covered by hard surfaces such as pavement and rooftops. Fayette County’s mean imperviousness is 1.00%, and only 0.23% of the county is mapped at 50% or greater imperviousness.
Does 44.17% class difference mean that 44.17% of Fayette County was physically transformed?
No. It means that 44.17% of mapped cells have different classes in the 1985 and 2025 endpoint comparison. The map explicitly notes that classification variation may be included. Some differences may represent real land-cover change, while others can reflect mixed pixels, imagery conditions, or classification differences. Additional years and local evidence are needed to determine a specific history.
Map File Information
The ZIP contains four original Fayette County JPG maps: 2025 land cover, forest and farmland, impervious surface, and mapped land-cover class differences from 1985 to 2025.
- File Type: ZIP containing four JPG images
Related Maps
- Autauga County Alabama Land Cover Map
- Baldwin County Alabama Land Cover Map
- Barbour County Alabama Land Cover Map
Sources and data notes
- MRLC Annual NLCD Data — official access point for Annual NLCD land-cover and developed-surface products.
- USGS Annual NLCD Land Cover Classification — official descriptions of the mapped land-cover classes.
- Fayette County Multi-Hazard Mitigation Plan — Alabama Emergency Management Agency-hosted county plan with local drainage, physiography, forest, and development context.
- U.S. Census Bureau TIGER/Line Shapefiles — official geographic boundary reference.
Green Map creates custom-edited map images using open geographic data sources such as geoBoundaries, Natural Earth, OpenStreetMap, and government open data.
These maps are edited visual materials, not raw data files, and are provided for education, documents, presentations, and graphic reference.