Harris County is easiest to understand as a large urban county organized around Houston but stretching well beyond the central city. The supplied maps show a broad spread of communities from Katy and Tomball to Humble, Baytown, Pasadena, La Porte, and Seabrook, along with a dense highway network and an equally important system of bayous, rivers, reservoirs, and coastal water. Reading those elements together gives a much clearer picture than treating the county boundary as a simple outline.
You can download the original A3 high-resolution JPG map files used for this page as a ZIP from the Map File Information box below. The set includes the county map, ranked-city map, terrain-and-water map, and elevation map, so you can choose the version that best matches a classroom, planning, reference, or print project.
A useful way to begin is to locate Houston and then follow the major routes that leave it. I-10 runs east and west through the county, US 290 heads northwest, and US 59/69 forms a strong north-south connection. Once those routes are familiar, the positions of the outer communities and the major waterways become much easier to place.
Table of Contents
Houston at the Center of a County That Reaches Far in Every Direction
On the general county map, Houston occupies the central position, but the labeled communities make clear how wide the urban area has become. Katy sits near the western edge, Tomball is far to the north, and Humble is northeast of the central city. East of Houston, Galena Park and Deer Park lead toward Baytown, while Pasadena and La Porte occupy the southeast side. Seabrook and Webster appear closer to the lower edge of the county, and Pearland and Friendswood help show how the developed area continues toward neighboring counties.
That layout matters because a Harris County map can look deceptively simple if the viewer focuses only on Houston. The outer labels show that the county has several distinct directions of travel. A trip from Katy approaches the center from the west, Tomball and Humble connect from the north and northeast, and Baytown or La Porte relate much more closely to the waterways and bay shoreline on the east side.
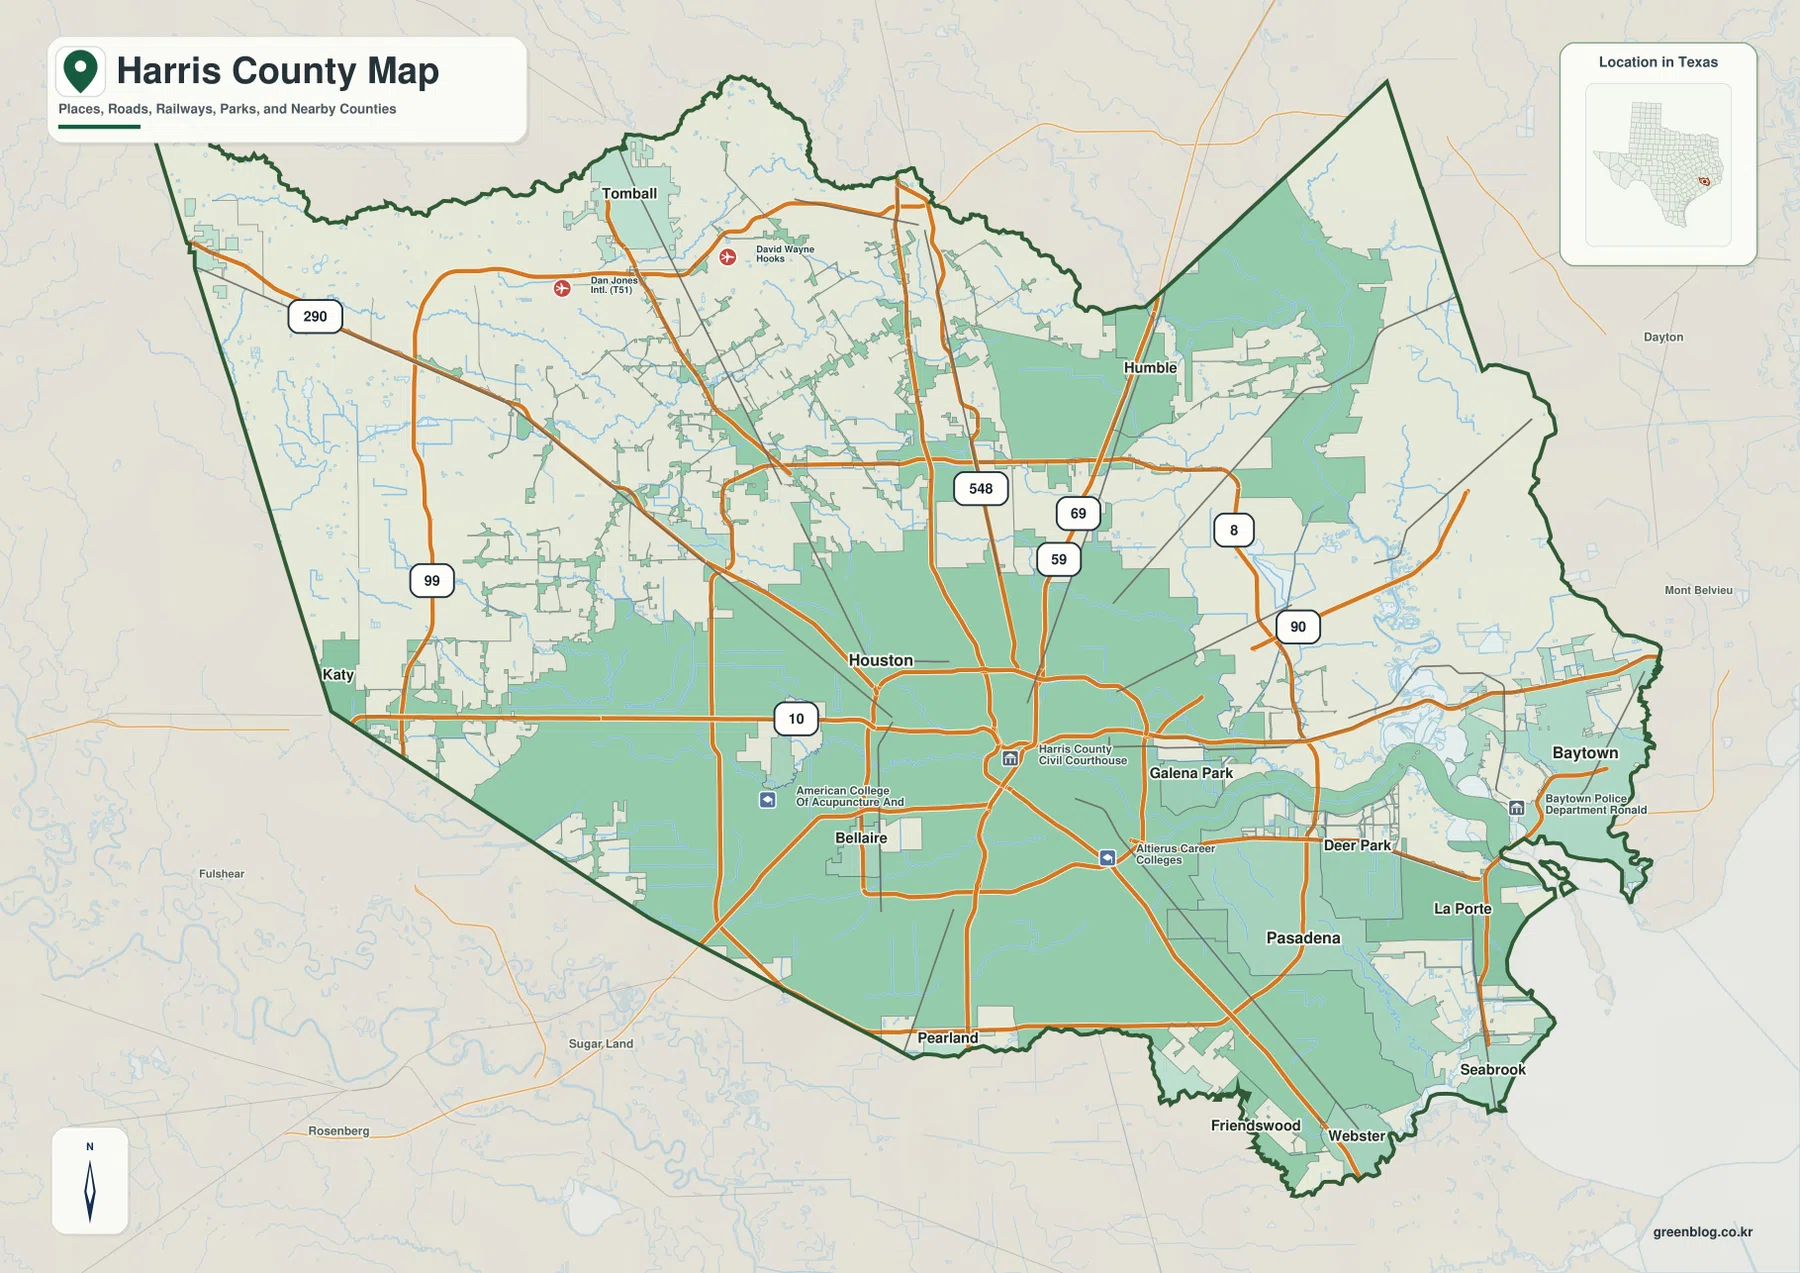
The neighboring county names on the map also provide useful orientation. Montgomery County lies to the north, Liberty and Chambers counties are on the east and northeast, Galveston County is to the southeast, Brazoria County is south, and Fort Bend and Waller counties are on the west and southwest side. Because highways and waterways continue beyond the Harris County line, those labels are helpful when tracing a regional route rather than stopping at the administrative boundary.
The Ranked-City Map Highlights an Eastern and Southeastern Cluster
The ranked-city map selects Houston, Pasadena, Baytown, La Porte, Deer Park, and Bellaire. Houston is the clear central anchor. Bellaire is close to the core, while Pasadena, Deer Park, La Porte, and Baytown form a noticeable group east and southeast of Houston. The result is a map that quickly shows the difference between the central city and a second concentration closer to the bay and the eastern side of the county.
Pasadena and Deer Park sit relatively close to Houston’s eastern side, while La Porte and Baytown are farther toward the county edge and coastal water. This arrangement helps explain why the eastern half of the county has so many road and water crossings. It is also useful when comparing the inland position of Houston and Bellaire with communities that are much closer to the San Jacinto River system and Galveston Bay.
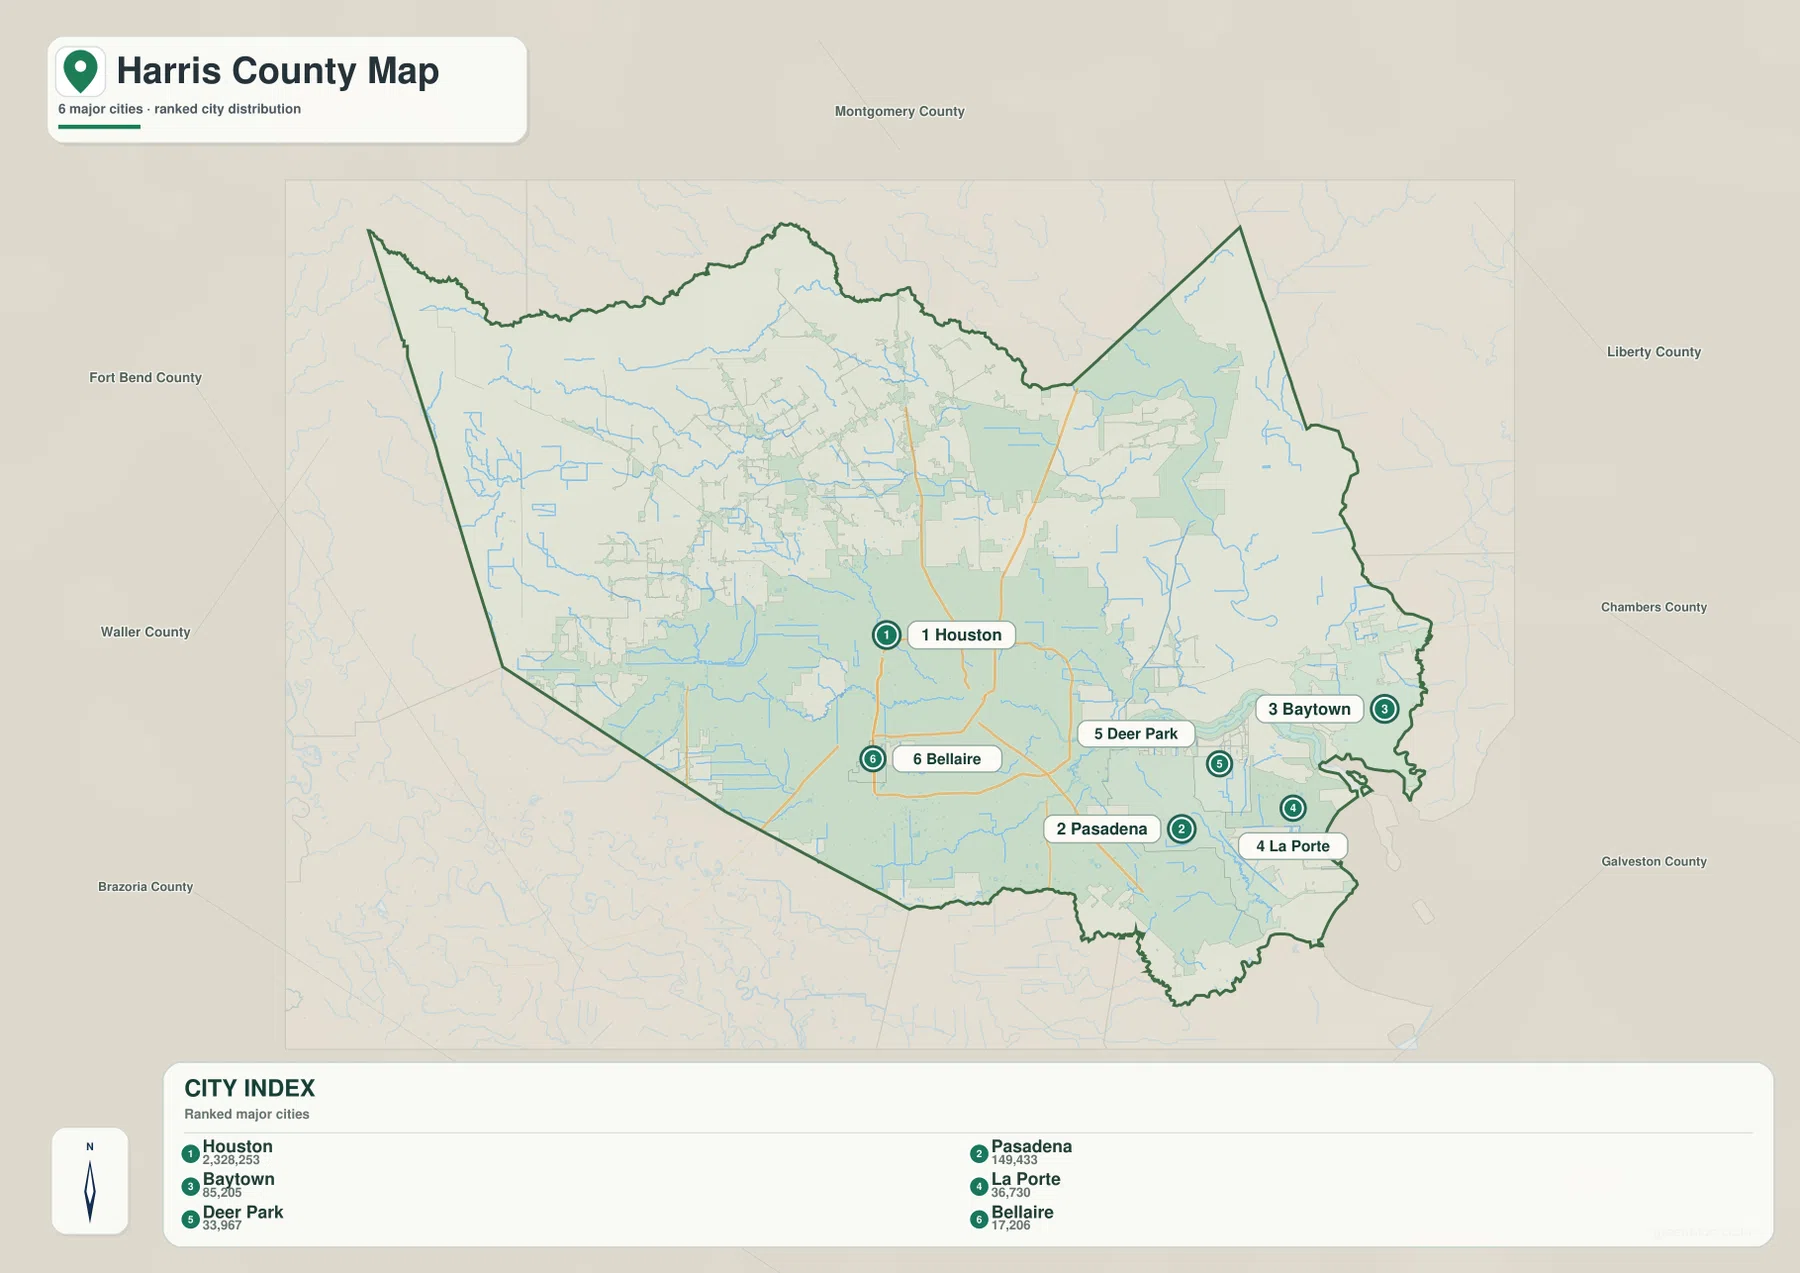
The city index is best used as a location comparison rather than as a complete list of every municipality in the county. Smaller communities and additional incorporated places appear on the general map, while this version deliberately emphasizes a limited set of major cities. Using the two maps together keeps the broad county layout visible without losing the simpler ranked-city view.
I-10, US 59/69, US 290, and the Outer Routes Form the Road Frame
The highway pattern radiates from Houston. I-10 is the most obvious east-west route, crossing the central city and continuing toward Katy on one side and the eastern communities on the other. US 290 angles northwest, while US 59 and US 69 run through the central area on a north-south alignment. US 90 is labeled on the east side, and the maps also show the large loops or outer routes marked as 8 and 99.
Those roads make the county easier to read in layers. The inner routes are tightly packed around Houston, while the outer network spreads toward Katy, Tomball, Humble, Baytown, and the southern edge. Instead of trying to memorize every road name, it is more practical to identify the few major corridors first and then use nearby city labels to determine direction.
The eastern road network becomes even more meaningful when it is compared with the water map. Bayous, the San Jacinto River system, reservoirs, and bay shoreline create repeated water crossings and help explain why routes do not simply form a perfect grid. This page is not a live navigation product, so current closures and turn-by-turn travel should still be checked with an up-to-date road source.
Buffalo Bayou Connects the Interior to a Much Larger Water Network
The terrain-and-water map gives Harris County a very different appearance from the road map. Buffalo Bayou crosses the central part of the county, while White Oak Bayou and Greens Bayou appear farther north. Cypress Creek stretches across the northern section. In the northeast, the West Fork San Jacinto River and San Jacinto River are shown around Lake Houston, creating one of the most prominent water features on the map.
Farther east and southeast, Spring Creek, Old River, Scott Bay, Sheldon Reservoir, and the lower river system lead toward Galveston Bay and Trinity Bay. The map therefore shows several scales of water at once: narrow creeks and bayous, a major river system, reservoirs, and broad coastal bays. That variety is one of the defining visual characteristics of Harris County.
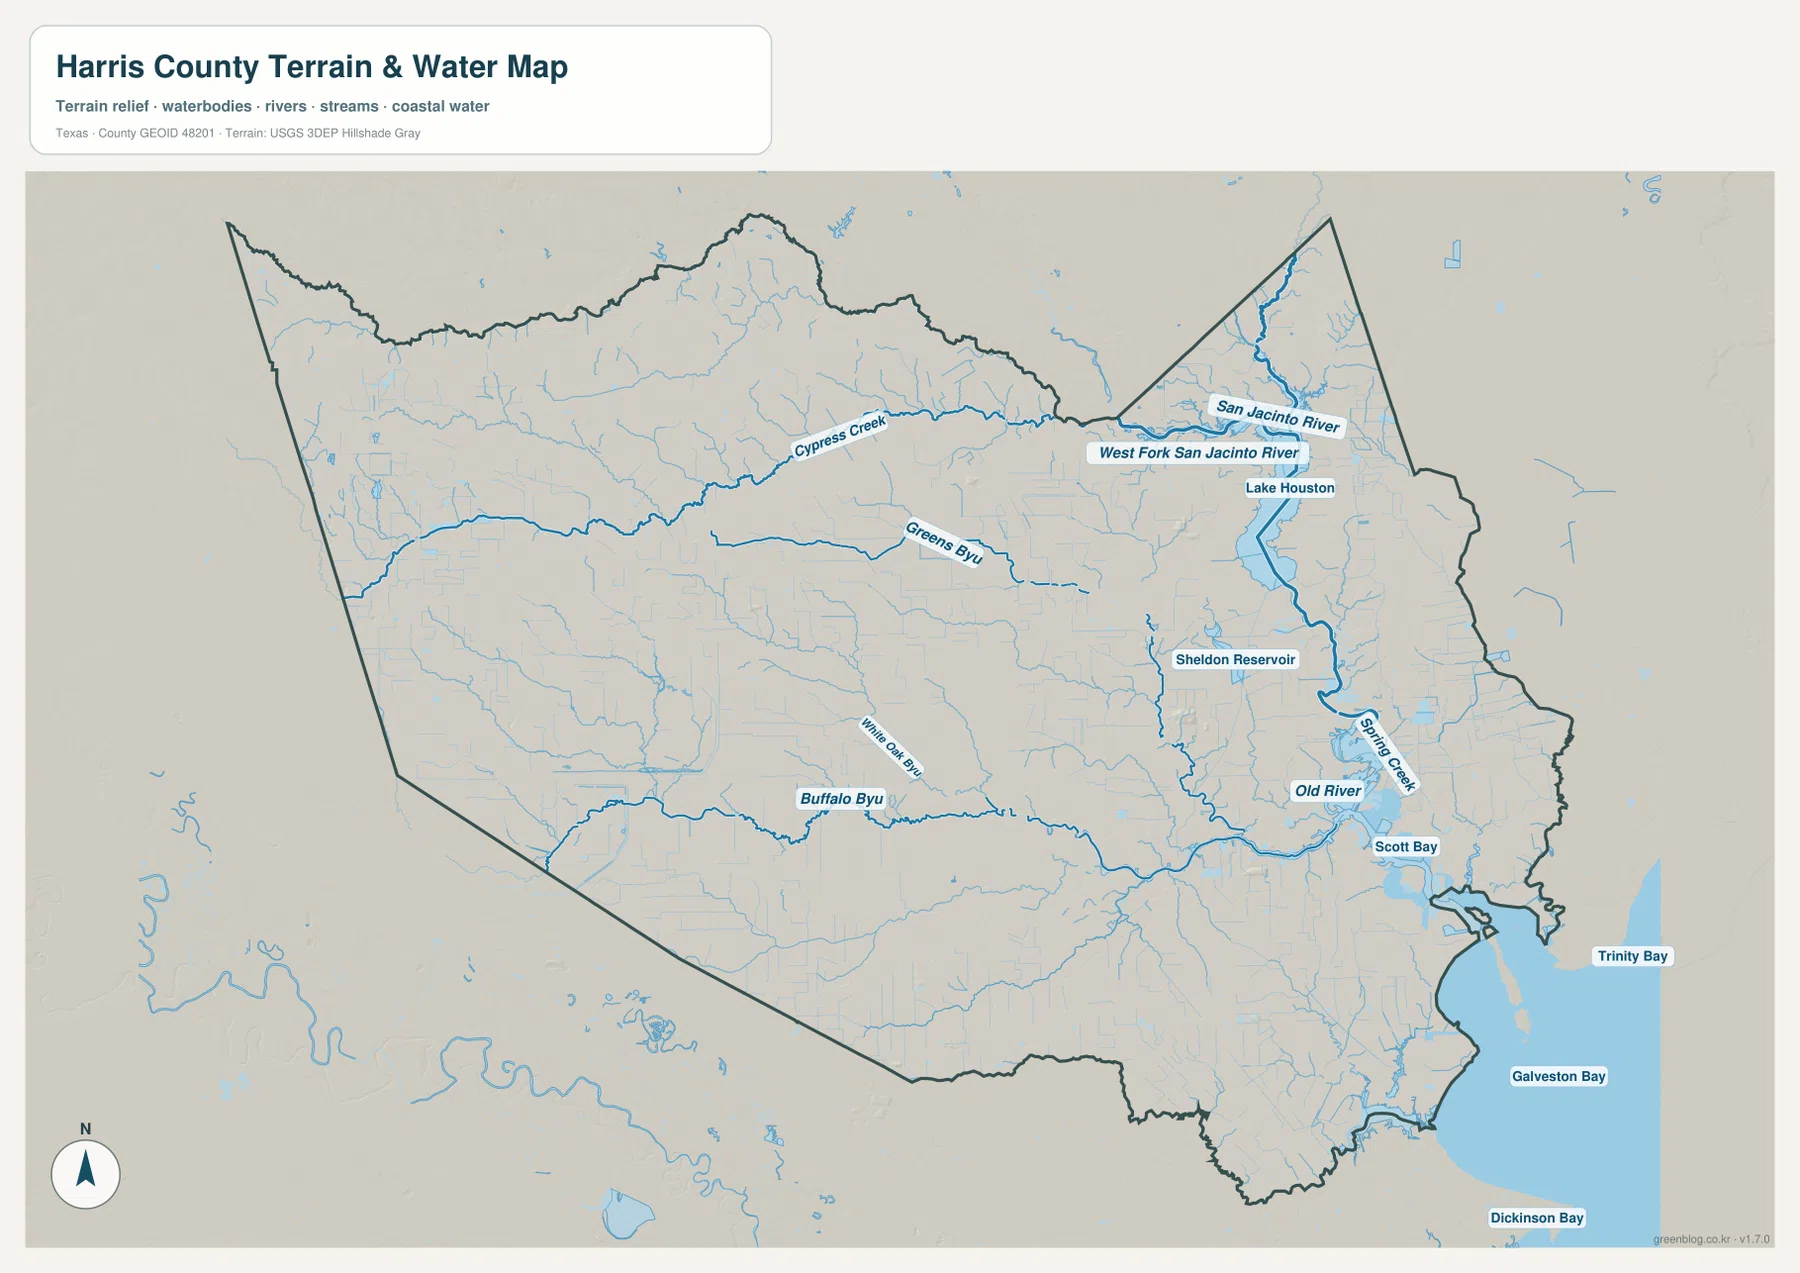
This water map should be treated as a geographic reference, not as a flood-risk, legal-boundary, parcel, navigation, or boating chart. It is useful for seeing where named waterways lie and how they relate to one another. Flood zones, levees, drainage infrastructure, water depth, and safe navigation require separate official products designed for those purposes.
Elevation Falls from the Northwest Toward the River and Bay Lowlands
Harris County is not mountainous, but the elevation map still shows a clear regional gradient. The legend reports an actual elevation range of about -9 to 97 meters and a mean of about 25 meters. Brown and tan shades are most noticeable in the west and northwest, while green becomes dominant across the center, east, and southeast.
The lowest-looking areas align closely with the eastern river network, bayous, and coastal side of the county. The northwest corner stands out as relatively higher ground, while the San Jacinto River corridor and areas approaching Galveston Bay are much lower. The contrast is gradual rather than dramatic, yet it is strong enough to help explain the relationship between terrain and the dense drainage network.
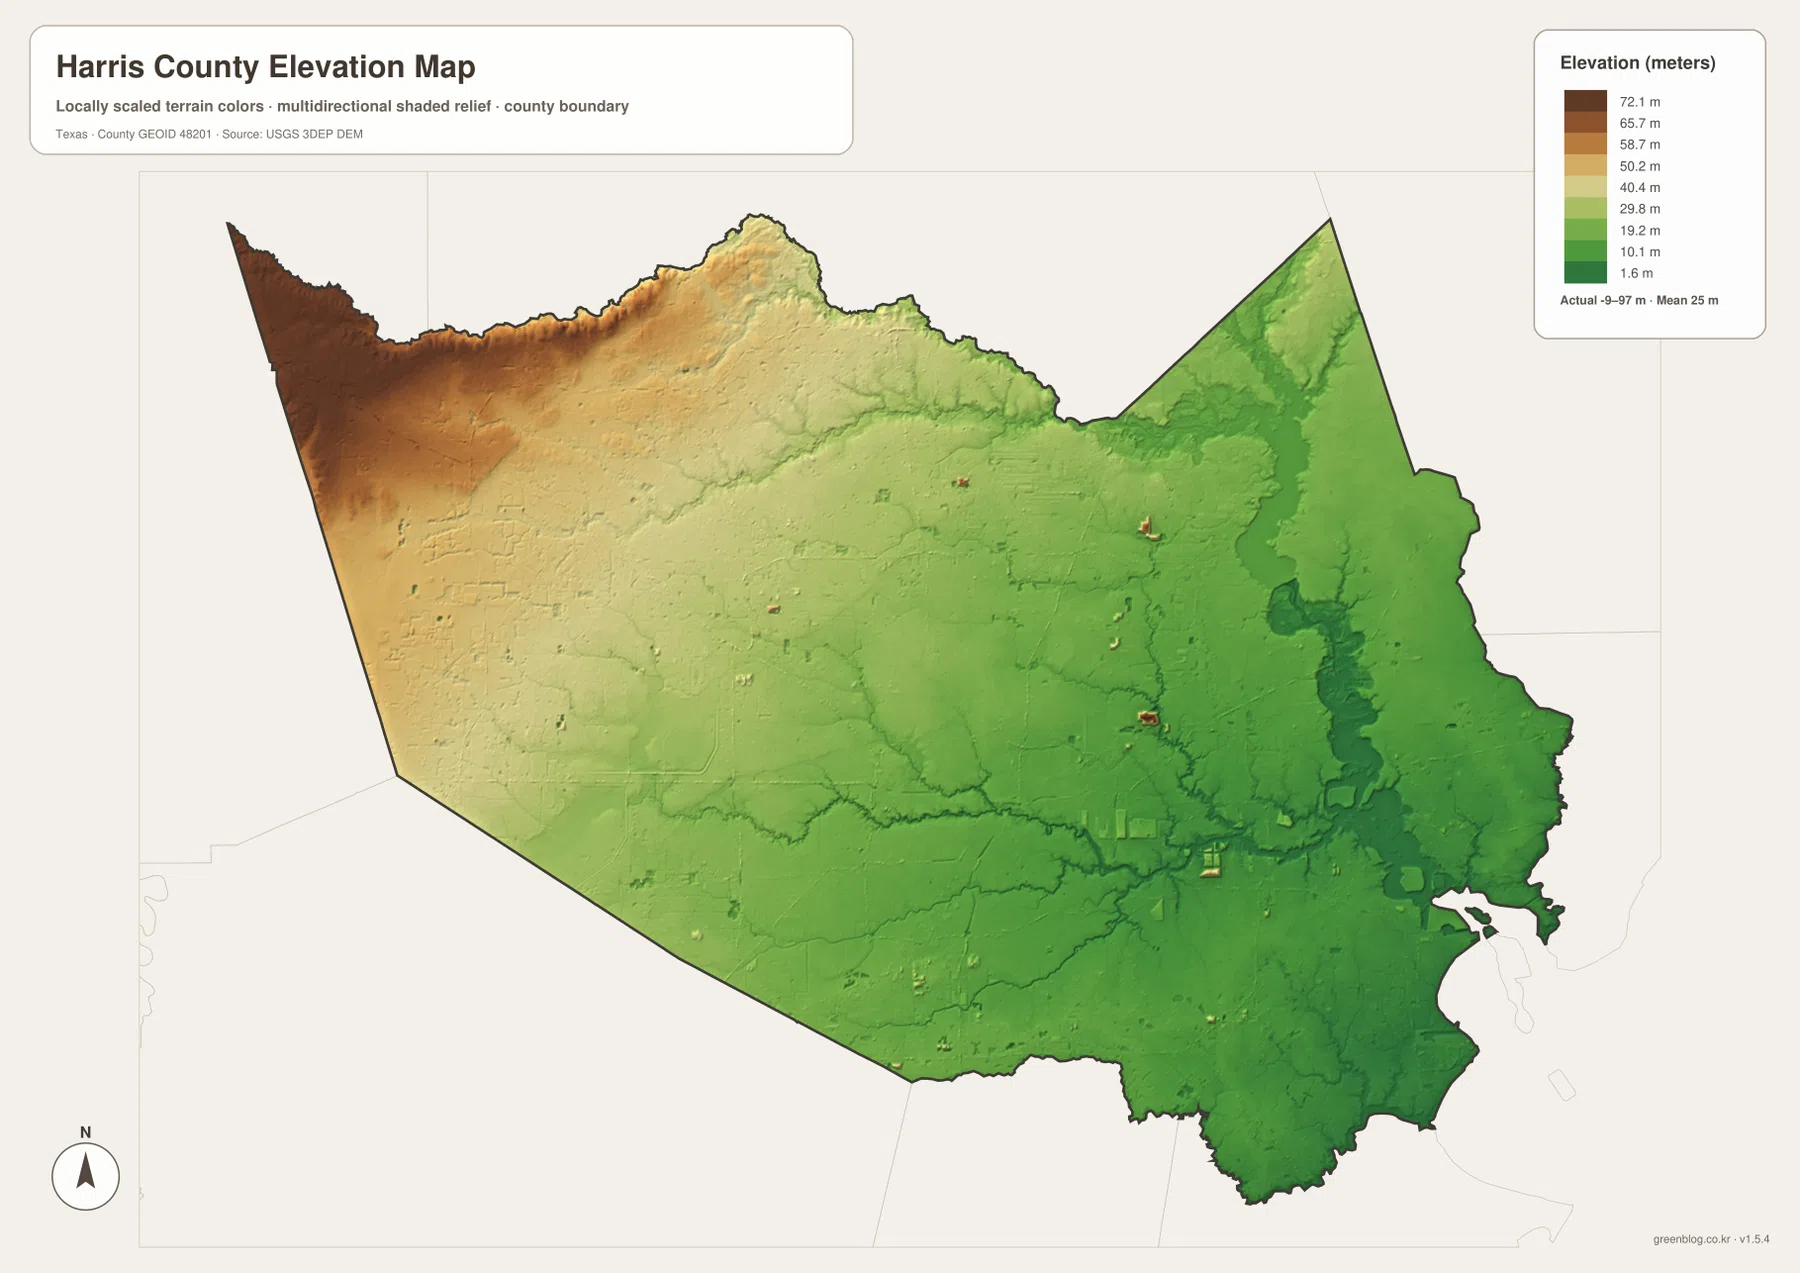
The elevation surface is a generalized representation of terrain and is not a survey-grade measurement for an individual property. It works best for county-scale comparison: which parts are relatively high, which are low, and where low corridors line up with rivers and bayous. For engineering, construction, drainage design, or a specific site elevation, a more precise source is required.
Choose the Map by the Question You Need to Answer
For basic orientation, start with the county map. It is the strongest option for locating Houston in relation to Katy, Tomball, Humble, Baytown, Pasadena, and the major highways. The ranked-city map is cleaner when the goal is simply to compare the positions of Houston, Pasadena, Baytown, La Porte, Deer Park, and Bellaire without the full set of labels.
The water map is the better choice for Buffalo Bayou, Cypress Creek, Lake Houston, the San Jacinto River, and the bays. The elevation map answers a different question by showing the broad height change from the northwest toward the lower eastern and coastal areas. Keeping these purposes separate makes the map set easier to use and avoids forcing too many layers onto a single image.
The archive is useful when you need a printable version rather than the web preview. You can select only the road-and-place map for a location handout, use the water map for a bayou or river lesson, or use the elevation version when a project needs a simple county-wide terrain comparison.
Frequently Asked Questions
What should I locate first on a Harris County map?
Start with Houston and the major highway directions. Find I-10, US 59/69, and US 290, then compare Katy to the west, Tomball and Humble to the north, and Baytown, Pasadena, and La Porte to the east and southeast. That sequence makes the county’s large size easier to organize.
Where are Buffalo Bayou and the San Jacinto River on the map?
Buffalo Bayou crosses the central part of Harris County from the west toward the east. The West Fork San Jacinto River and San Jacinto River are prominent in the northeast around Lake Houston, and the larger water system continues toward the eastern bays.
How high is Harris County according to the elevation map?
The map legend gives an actual range of about -9 to 97 meters, with a mean near 25 meters. The west and northwest are relatively higher, while the eastern river corridors and southeastern coastal side are lower. These values are intended for broad terrain comparison rather than property-level surveying.
Sources and Reference Data
County boundaries, roads, and place layers can be cross-checked with the U.S. Census Bureau TIGER/Line Shapefiles.
Named rivers, bayous, creeks, and other hydrography can be referenced through USGS National Hydrography.
Elevation data and program information are available from the USGS 3D Elevation Program.
For an interactive federal map viewer, see USGS The National Map Viewer.
Map File Information
Download the original A3 high-resolution JPG files that match the maps shown on this page.
- File Type: JPG
Related Maps
- Waller County Texas map
- Wharton County Texas map
- Austin County Texas map
- Polk County Texas map
- San Jacinto County Texas map
Green Map creates custom-edited map images using open geographic data sources such as geoBoundaries, Natural Earth, OpenStreetMap, and government open data.
These maps are edited visual materials, not raw data files, and are provided for education, documents, presentations, and graphic reference.