You can download the Van Buren County map set on this page as a ZIP containing four high-resolution A3 JPG files. Spencer is the clearest settlement center in the north-central part of the county, but most of the landscape is defined by elevated plateau surfaces cut by deep stream valleys. Rocky River stands out in the northwest, several creeks branch through the interior, and Fall Creek Lake appears on the eastern side. Comparing roads, water, and elevation together makes this rugged county much easier to understand.
The general map labels Spencer, Bone Cave, Lonewood, and Chalybeate, along with routes 70, 1, 111, 30, 284, and 285. The city map ranks only Spencer as a major city. The water map identifies Rocky River, Laurel Creek, Long Fork Creek, Spring Creek, Cane Creek, Piney Creek, Dry Fork, and Fall Creek Lake. The elevation layer spans roughly 240 to 650 meters, with a mean near 482 meters, revealing a strong contrast between lower drainage corridors and the higher plateau interior.
Table of Contents
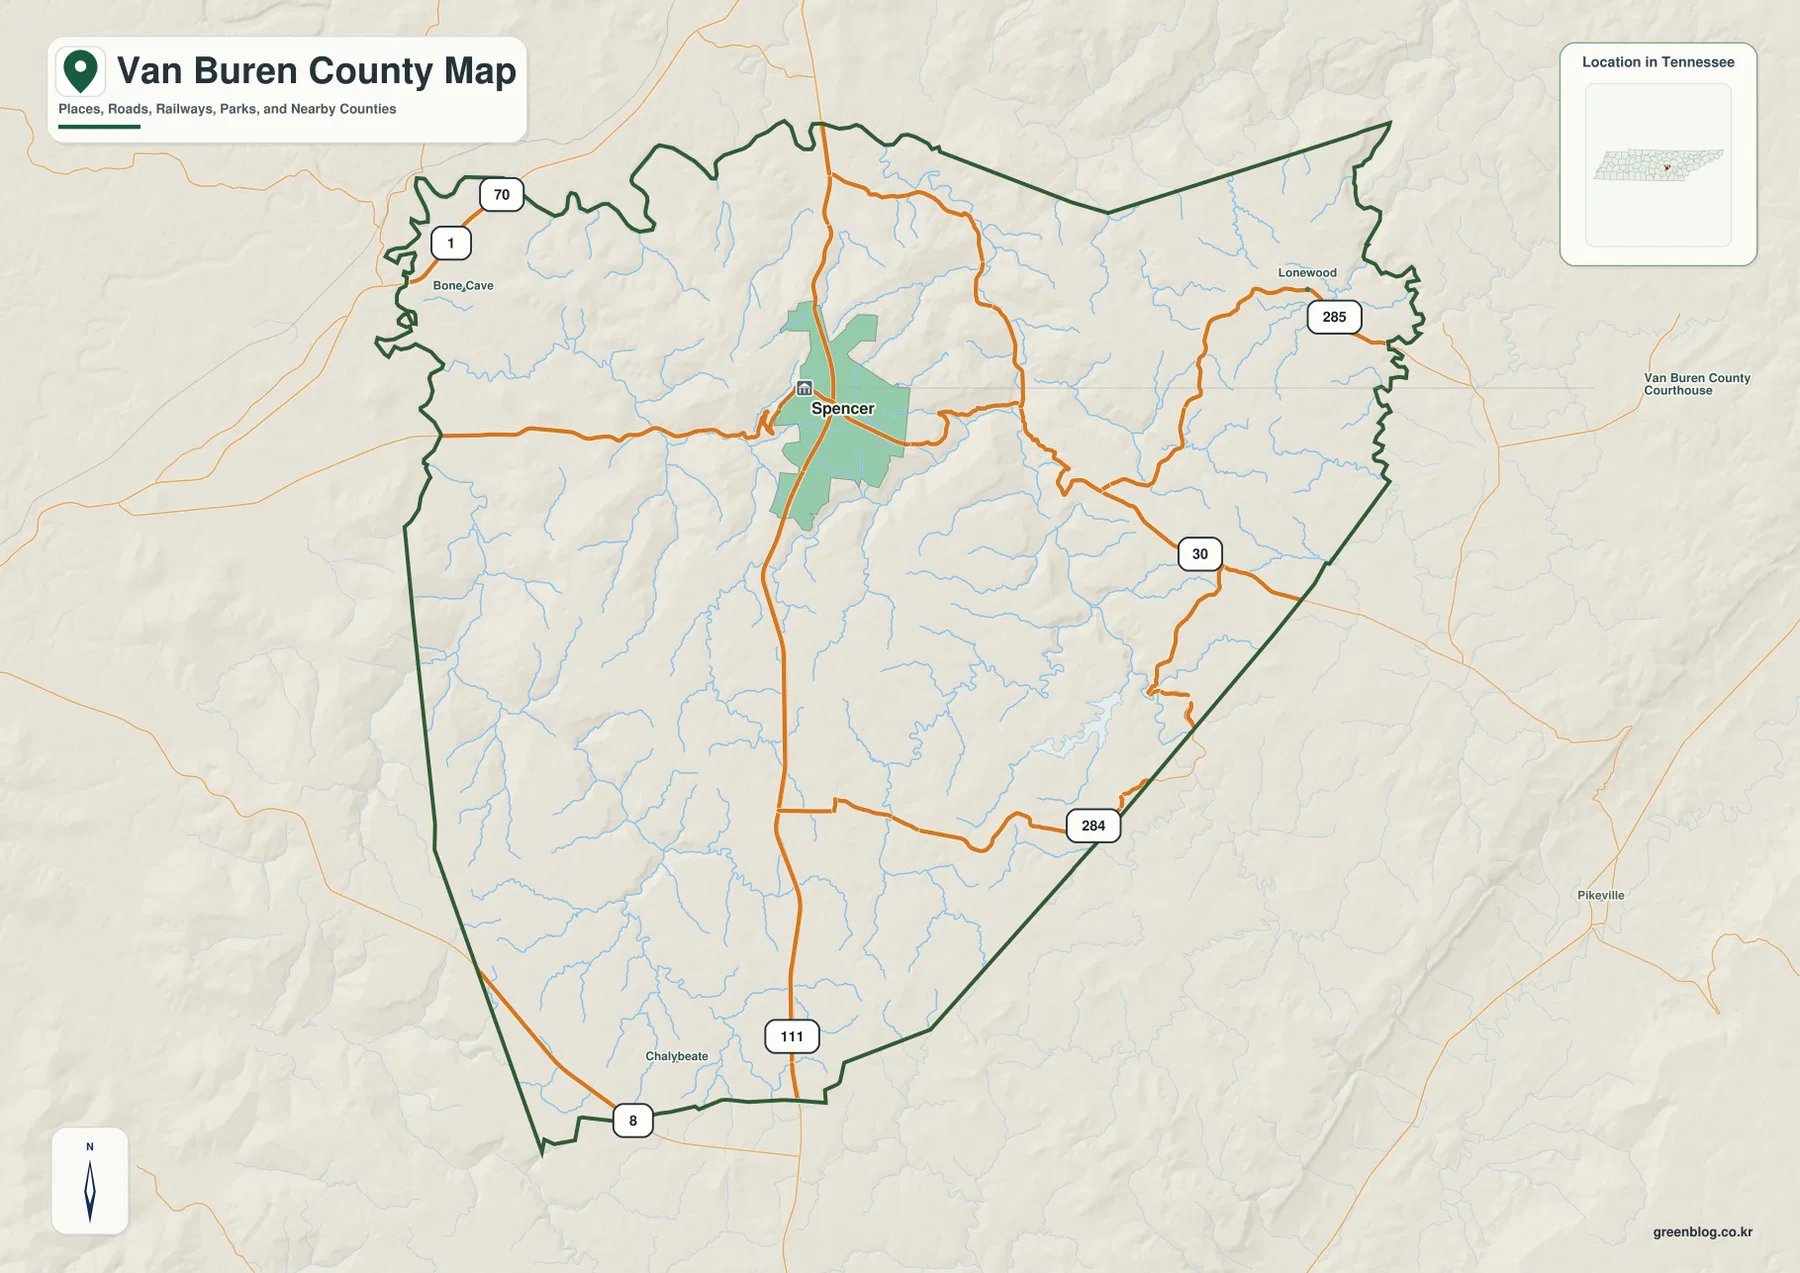
Spencer is the main road and settlement reference in the north-central county
Spencer is the easiest place to locate on the general county map. Its highlighted settlement area sits north of the county’s middle, and several routes meet or change direction nearby. Rather than spreading across a broad plain, the road network has to work through a landscape of ridges and valleys. Starting with Spencer and then following each route toward the county boundary gives a clearer picture than trying to read all local roads at once.
Route 111 is the strongest north-south reference, continuing from Spencer toward Chalybeate in the southern part of the county. Route 30 heads east, 285 reaches toward Lonewood in the northeast, and 70 and 1 appear around the Bone Cave area in the northwest. Route 284 provides another southeastern connection. The curves and changes in direction are easier to explain after the stream and elevation maps are considered.
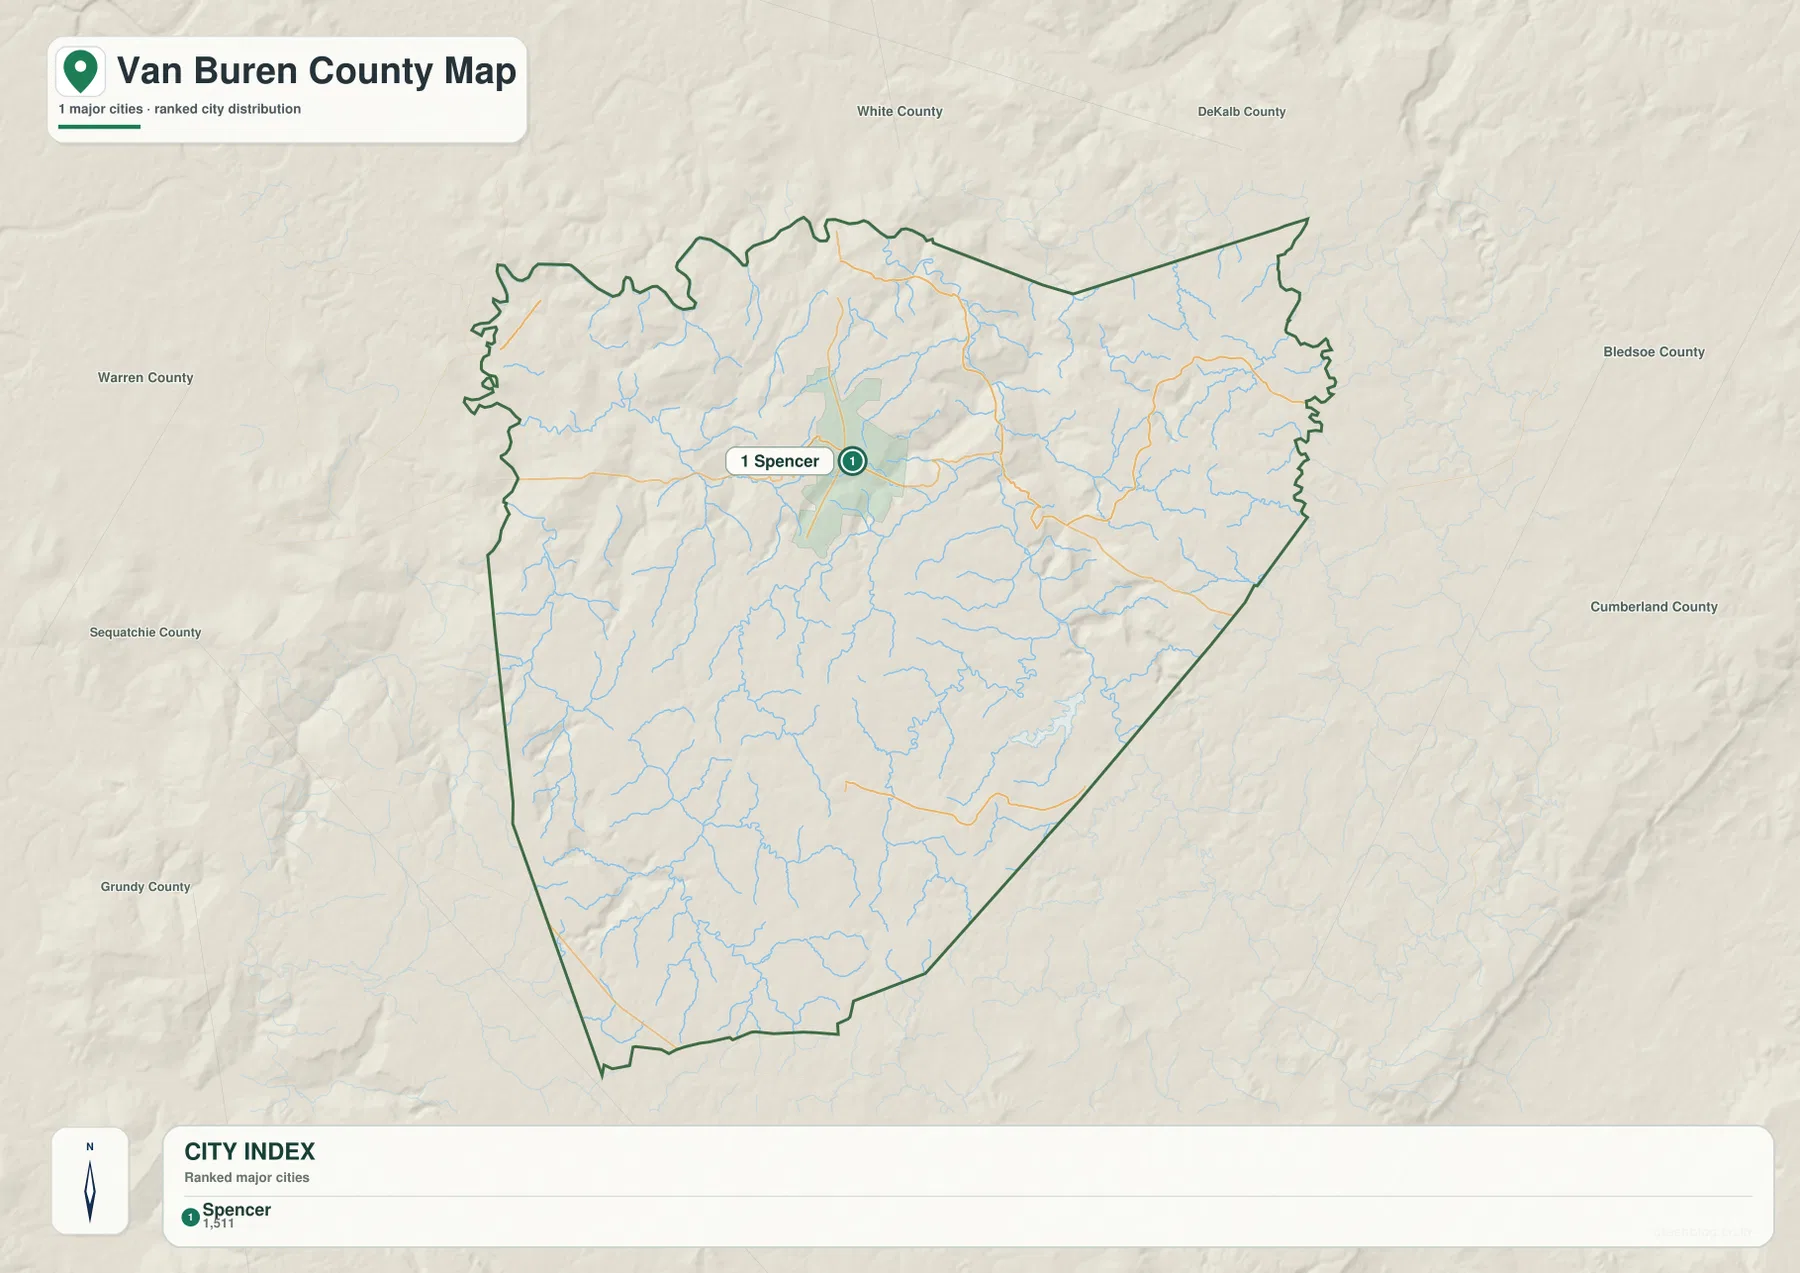
Neighboring labels around the map include White, DeKalb, Bledsoe, Cumberland, Sequatchie, Grundy, and Warren counties. Van Buren County itself narrows toward the south and has a more irregular northern and northwestern outline. When a nearby outside place appears close to the county, the dark boundary line is a better guide than the visual distance between labels.
A city map with Spencer as the only ranked major center
The supplied city distribution map ranks only Spencer and prints a value of 1,511 beside it. That number belongs to the city graphic and should be treated as a city-level comparison value rather than the population of the entire county. Names such as Bone Cave and Lonewood help orient the general map, but they are not shown as equivalent ranked urban centers.
This simple city pattern is informative. Spencer combines the county-seat role with the most visible concentration of roads, while much of the surrounding county is occupied by rural routes, forests, plateau surfaces, and narrow valleys. Large blank-looking areas on the city map therefore do not mean the geography is empty; they indicate that the map is emphasizing only the principal urban label.
The attached reference material lists 6,168 residents in the 2020 census and a July 2025 estimate of 6,874. It also gives about 273.4 square miles of land and 1.1 square miles of water. Dividing the 2020 count by the land area produces a broad countywide density of about 22.6 people per square mile. That average does not mean Spencer, remote plateau roads, and deeply incised valleys have the same concentration of residents.
Rocky River, Fall Creek Lake, and a network of plateau streams
Rocky River is the most prominent named river on the water map, curving along the northwestern side of the county. Laurel Creek and Long Fork Creek occupy lower valleys to its south and southeast. Across the center, smaller branches cut into the plateau and feed a dense drainage network. The map therefore looks less like a county organized around one broad river and more like a high surface repeatedly divided by narrow stream valleys.
On the eastern side, Spring Creek and Cane Creek are among the clearest labels, with Cane Creek approaching Fall Creek Lake. Farther south, Piney Creek, Dry Fork, and Sampsons Fork follow long low corridors, and Big Laurel is labeled near the southwestern section. The stream directions closely match the green troughs visible on the elevation map, showing that water and relief are describing the same underlying valley system.
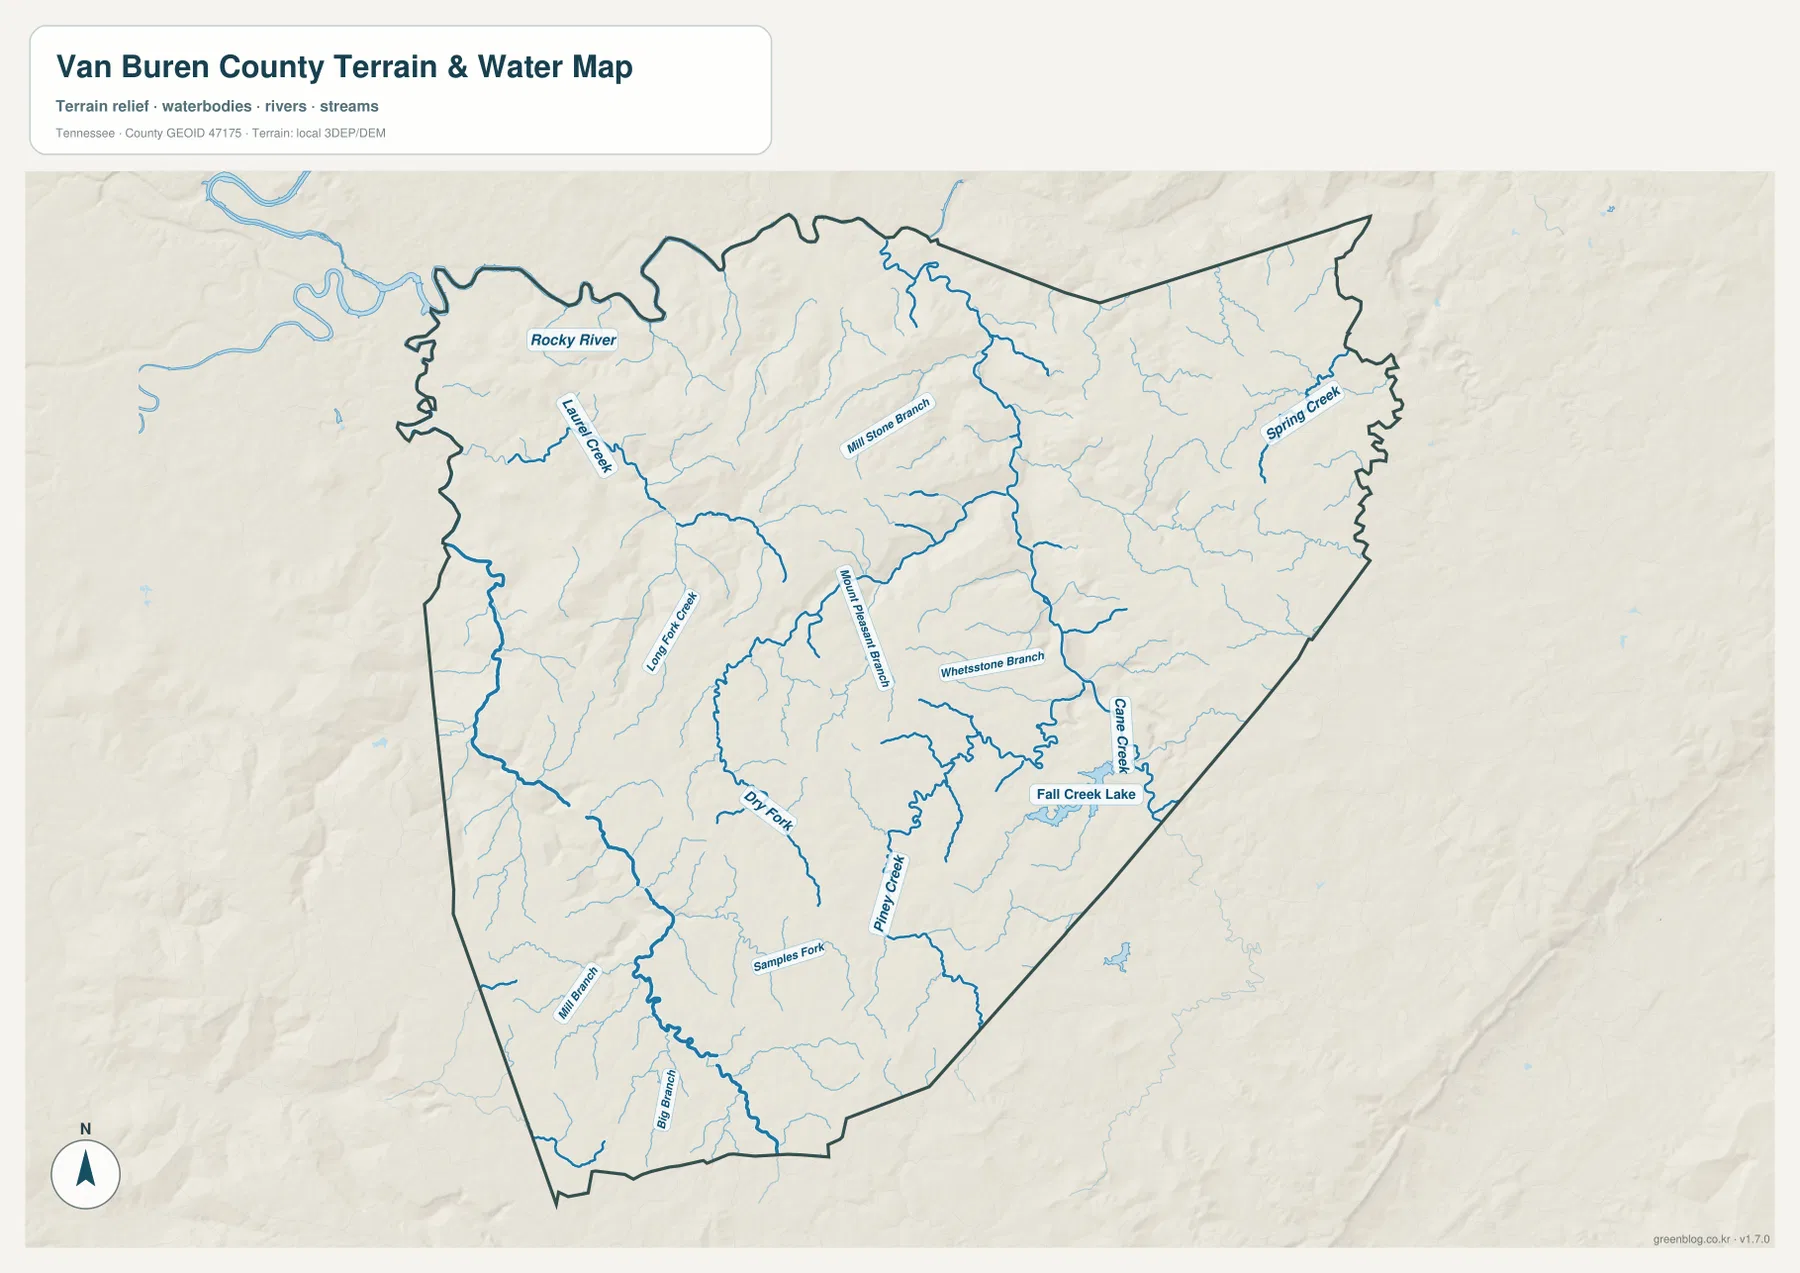
This is a static geographic reference rather than a live water or trail map. It does not report current stream stage, flood extent, lake level, waterfall access, or trail closures. The attached source material identifies portions of Fall Creek Falls State Resort Park and related natural areas as important local landscape references, so current park and transportation information should be checked separately before a visit.
Elevation rises from about 240 meters in valleys to 650 meters on the plateau
The elevation map shows an actual range of roughly 240 to 650 meters and a mean near 482 meters. Lower green terrain is concentrated around Rocky River and many of the larger stream valleys. Much of the central, eastern, and southern county is colored tan and brown, indicating broad areas of higher plateau terrain separated by deeply cut drainage corridors.
The contrast is especially clear where narrow green valleys extend through otherwise high terrain. Cane Creek and Piney Creek, for example, occupy lower corridors that cut through the elevated interior. The northwest contains more extensive low and mid-elevation terrain around the Rocky River system, while the east and south show wider continuous high surfaces.
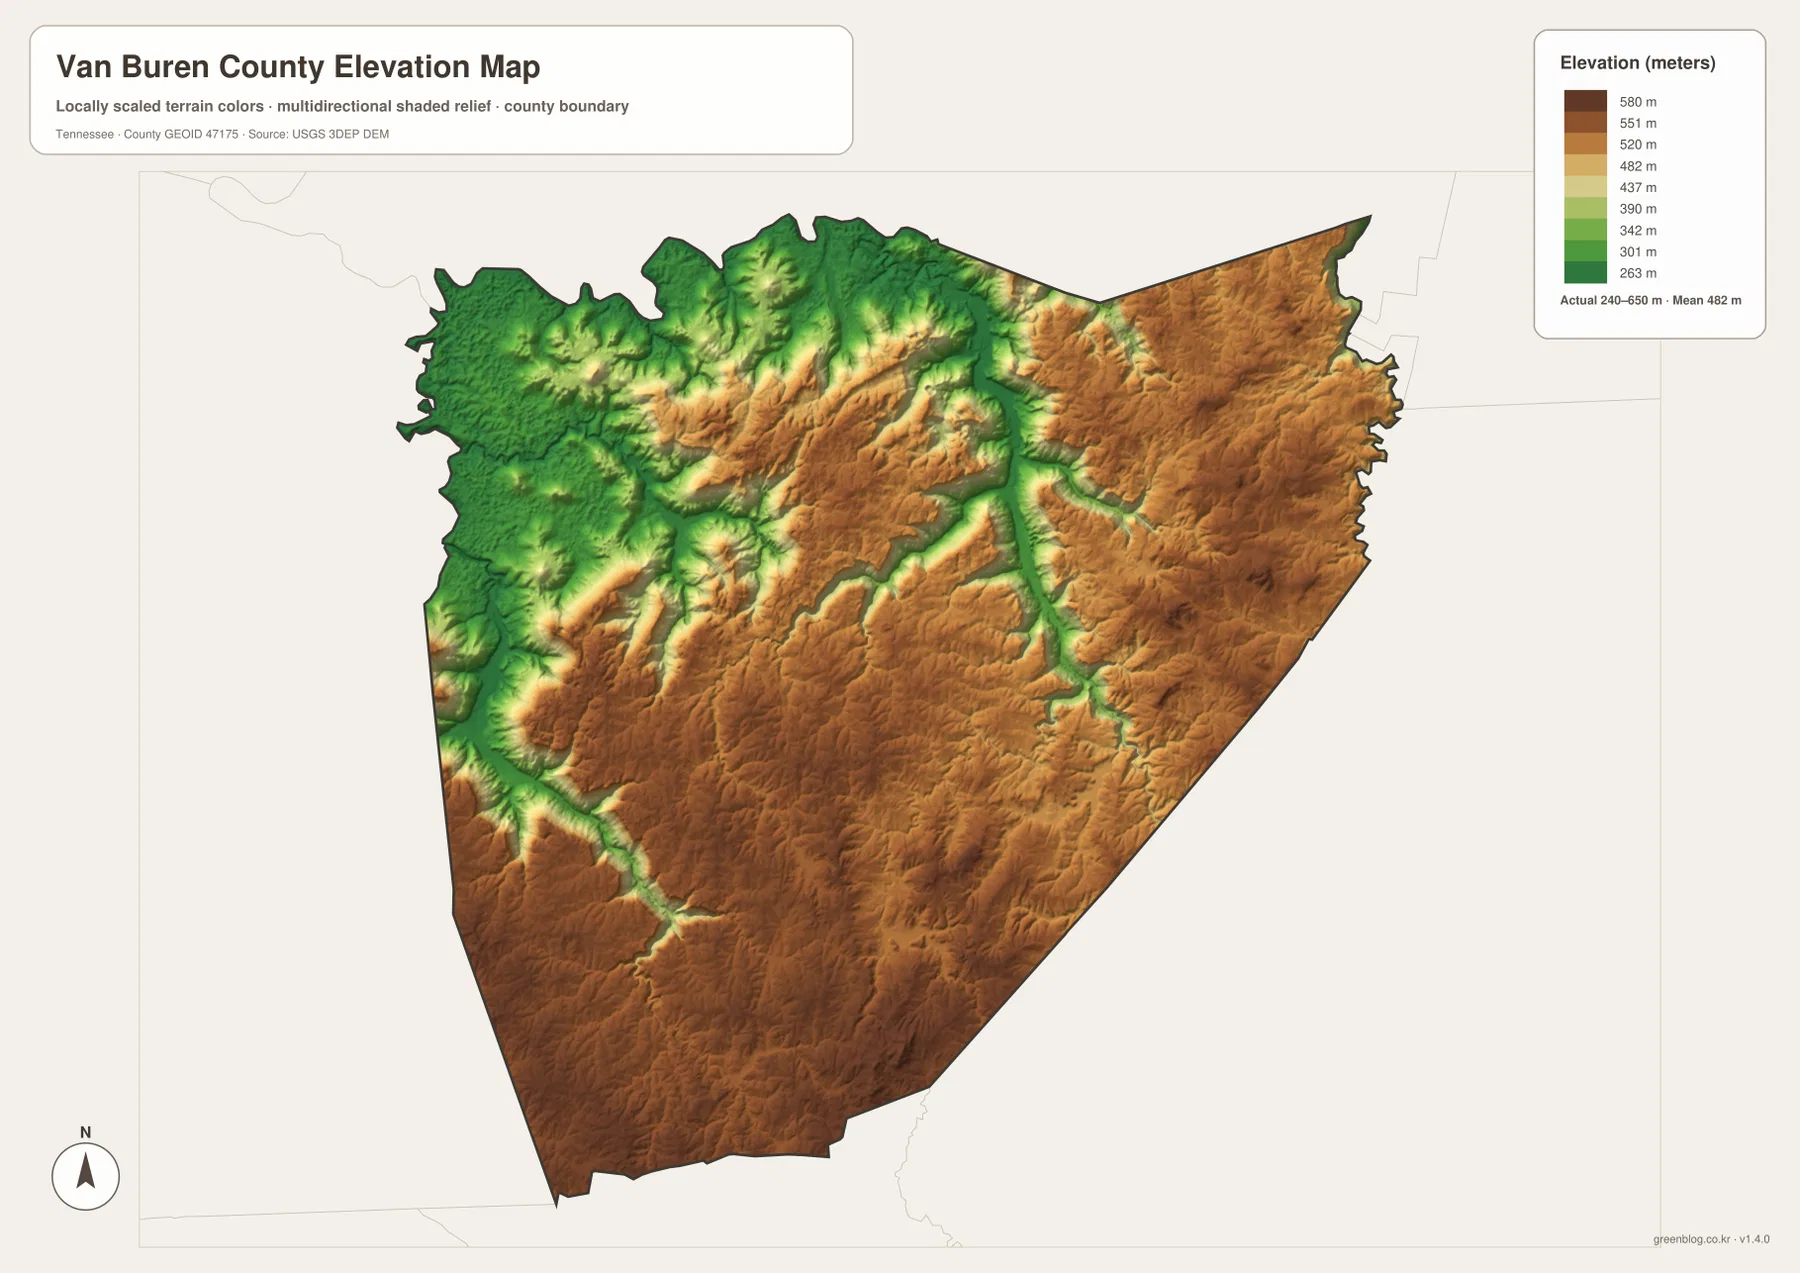
The attached county material uses Cumberland Plateau and Highland Rim as broad terrain references. The supplied elevation layer is consistent with a landscape in which high surfaces are repeatedly cut by stream valleys. It is suitable for county-scale comparison, but not for parcel surveying, engineering grades, or determining the precise elevation of a building site.
Road curves become easier to understand when the valleys are visible
Route 111 through Spencer is a useful example of how transportation fits the terrain. The road uses a practical north-south passage instead of crossing every ridge at the shortest geometric angle. Routes 30, 285, and 284 similarly adjust direction as they approach the eastern and southeastern parts of the county. Once the elevation colors and stream valleys are considered, many of those curves no longer look arbitrary.
Straight-line distance can therefore be misleading in Van Buren County. A deep drainage or high ridge may separate two points that look close on a flat map, and a road may need to follow a valley before reaching a crossing or a gentler slope. For park visits, emergency travel, or property access, use these maps for broad orientation and rely on current navigation and agency information for the actual route.
The attached reference material states that Van Buren County was established in 1840 and that Spencer is the county seat. That administrative role is still easy to recognize on the current maps because Spencer is also the main road and city reference. The remainder of the county, however, is dominated visually by plateau relief and drainage valleys, so the county cannot be understood from the seat alone.
Choosing a Van Buren County map for settlements, streams, or terrain
Use the general county map when you need Spencer, outer place labels, major roads, and the county boundary in one view. The city map is the quickest way to see how strongly Spencer dominates the ranked settlement layer. The water map is best for Rocky River, named creeks, and Fall Creek Lake. The elevation map adds the clearest explanation for why roads and streams follow certain corridors across the plateau.
For printed notes, it is often easier to separate transportation from physical geography. One copy can emphasize Spencer and routes 111, 30, 285, and 284. A second copy can mark Rocky River, Laurel Creek, Cane Creek, Piney Creek, Fall Creek Lake, and the high plateau blocks. This keeps the annotations readable and makes the relationship between routes, valleys, and elevation easier to compare.
A useful county-scale comparison is to divide the landscape into four broad reference areas: the lower Rocky River northwest, the Spencer road center, the Fall Creek Lake and Cane Creek side to the east, and the long elevated southern section. Those areas differ visibly in drainage, relief, and road density, giving Van Buren County a more varied internal geography than a simple Spencer-and-park description would suggest.
Frequently Asked Questions
Why does the city map show only Spencer as a major city?
The supplied city layer ranks only Spencer and prints a value of 1,511. Other names visible on the general map, including Bone Cave and Lonewood, are useful orientation labels but are not shown as equivalent ranked city centers. Countywide population figures cover a much larger area than the Spencer city label.
Which waterways stand out on the Van Buren County water map?
Rocky River is the clearest large river in the northwest. Laurel Creek, Long Fork Creek, Spring Creek, Cane Creek, Piney Creek, Dry Fork, and several smaller branches occupy other valleys, while Fall Creek Lake is labeled on the eastern side. Current water, flood, or trail conditions require live official sources.
What does the 240–650 meter elevation range tell us about the county?
It shows that Van Buren County has a large difference between lower river and creek valleys and the surrounding plateau. Rocky River and many stream corridors appear in lower green terrain, while broad central, eastern, and southern areas are much higher. The map is useful for regional terrain comparison, not parcel-level surveying.
Map File Information
The ZIP contains the high-resolution JPG originals for the Van Buren County map, city map, water map, and elevation map shown on this page. The four A3-format images are better suited to printing, enlarged viewing, and annotation than the WebP previews in the article.
- Included Files: County map, city map, water map, and elevation map
- File Type: ZIP containing 4 JPG images
Related Maps
Sources and References
- Tennessee State Library and Archives Van Buren County fact sheet
- Tennessee Department of Transportation Van Buren County map
- U.S. Census Bureau Van Buren County QuickFacts
- U.S. Census Bureau Gazetteer Files
- USGS National Hydrography
- USGS 3D Elevation Program
Green Map creates custom-edited map images using open geographic data sources such as geoBoundaries, Natural Earth, OpenStreetMap, and government open data. These maps are edited visual materials, not raw data files, and are provided for education, documents, presentations, and graphic reference.