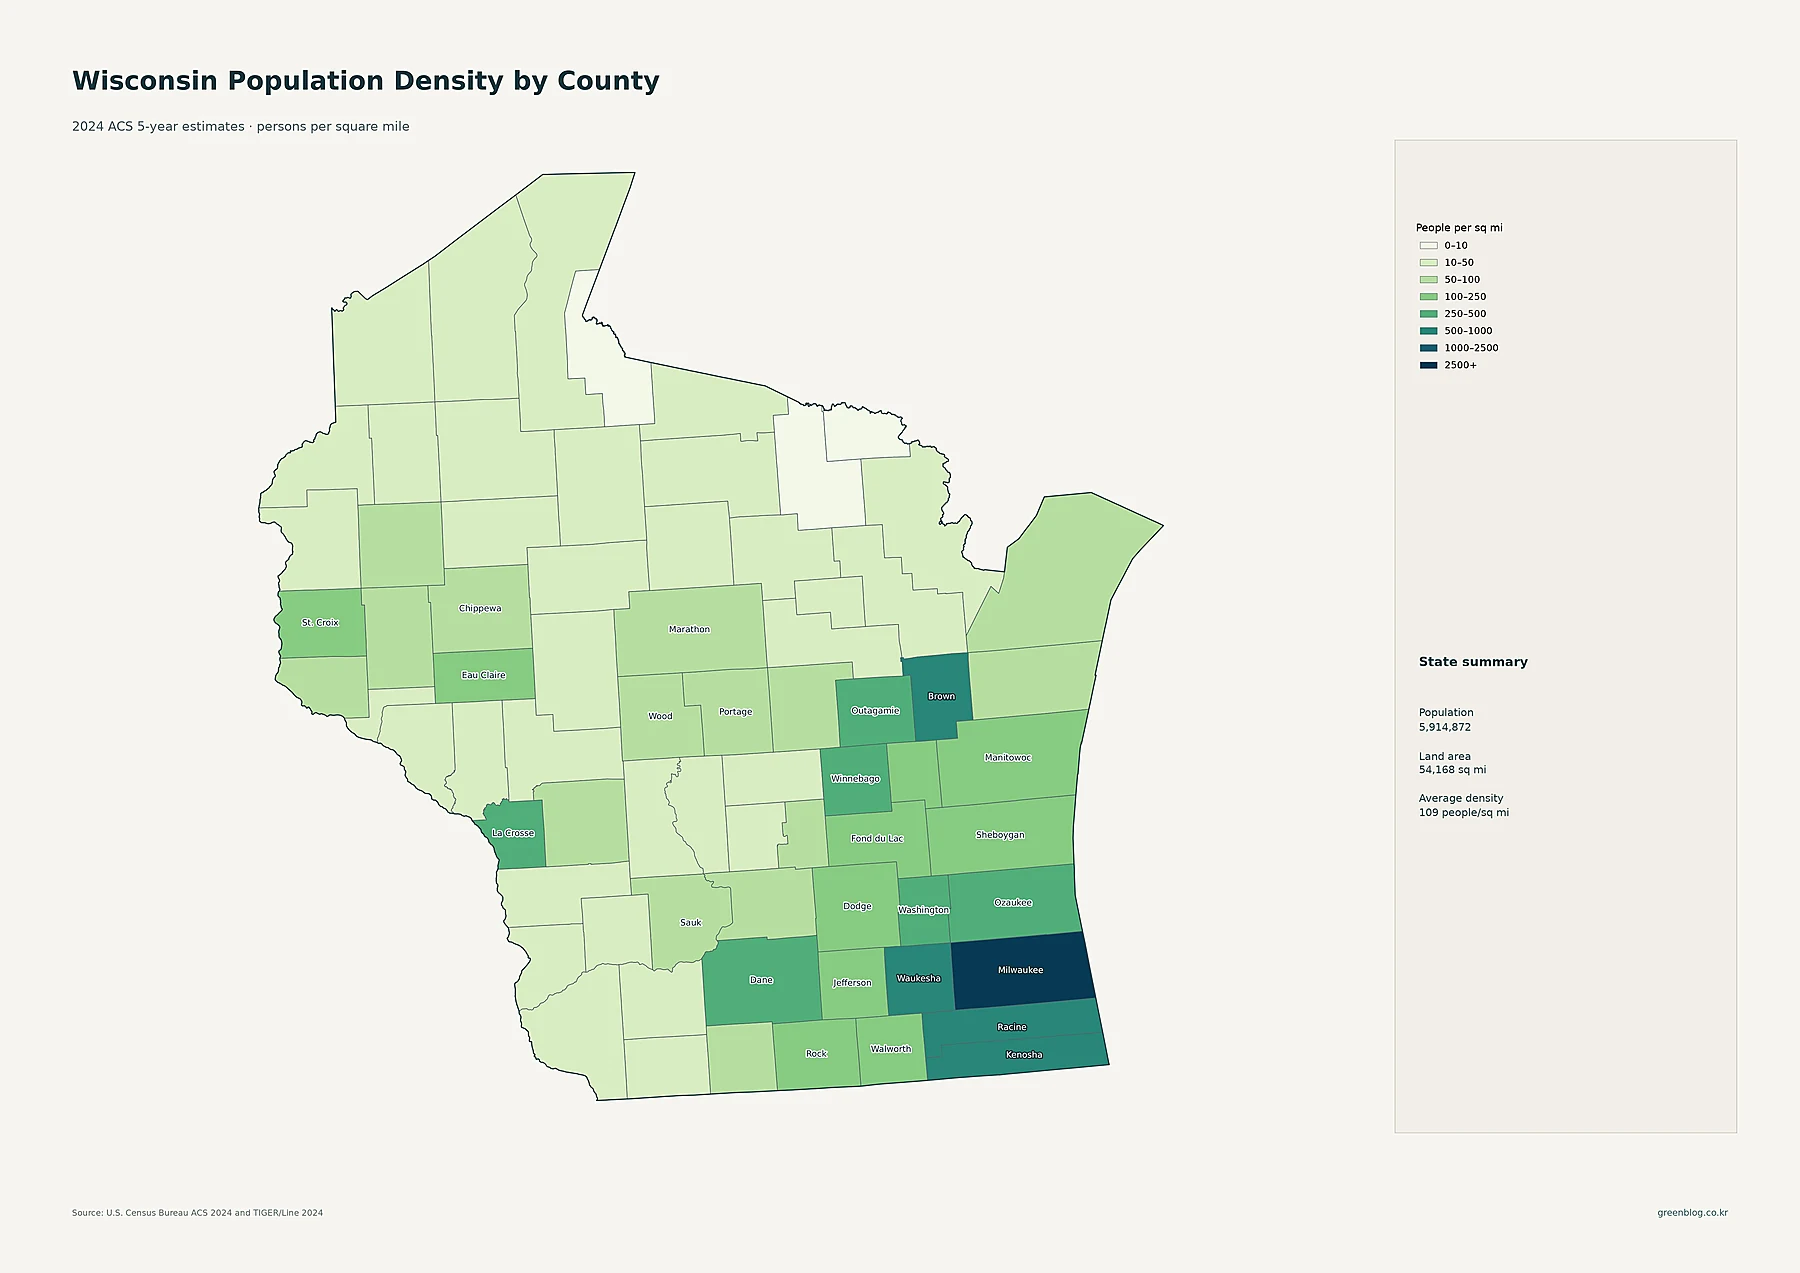
Wisconsin’s population pattern is defined by a sharp contrast between a dense southeast and a much sparser north. The 2024 ACS 5-year estimates used in this map set put the state population at 5,914,872. The county-density map reports 54,168 square miles of land and an average density of about 109 people per square mile. That statewide number hides a dramatic range. Milwaukee County is about 3,836 people per square mile, while Iron County is only about 8.
Each map answers a different population question. The census-tract map shows fine-grained density inside county boundaries. The cities map compares Census place populations and shows the footprint of 2020 urban areas. The county population map measures the total number of residents, while the county density map adjusts those totals for land area. The final map compares 2010 and 2020 decennial census populations. Keeping those measures separate is essential because a populous county is not automatically a dense county, and a dense county is not automatically a fast-growing one.
Table of Contents
Tract density reveals Wisconsin’s strongest population clusters
The detailed density map uses 2024 ACS 5-year estimates at the census-tract level. Its legend starts at 0–50 people per square mile and rises through several classes to 10,000 or more. Darker tracts contain more residents per unit of land, while heavier outlines show county boundaries. This scale makes it possible to see compact urban cores and suburban concentrations that disappear when an entire county is summarized with one average.
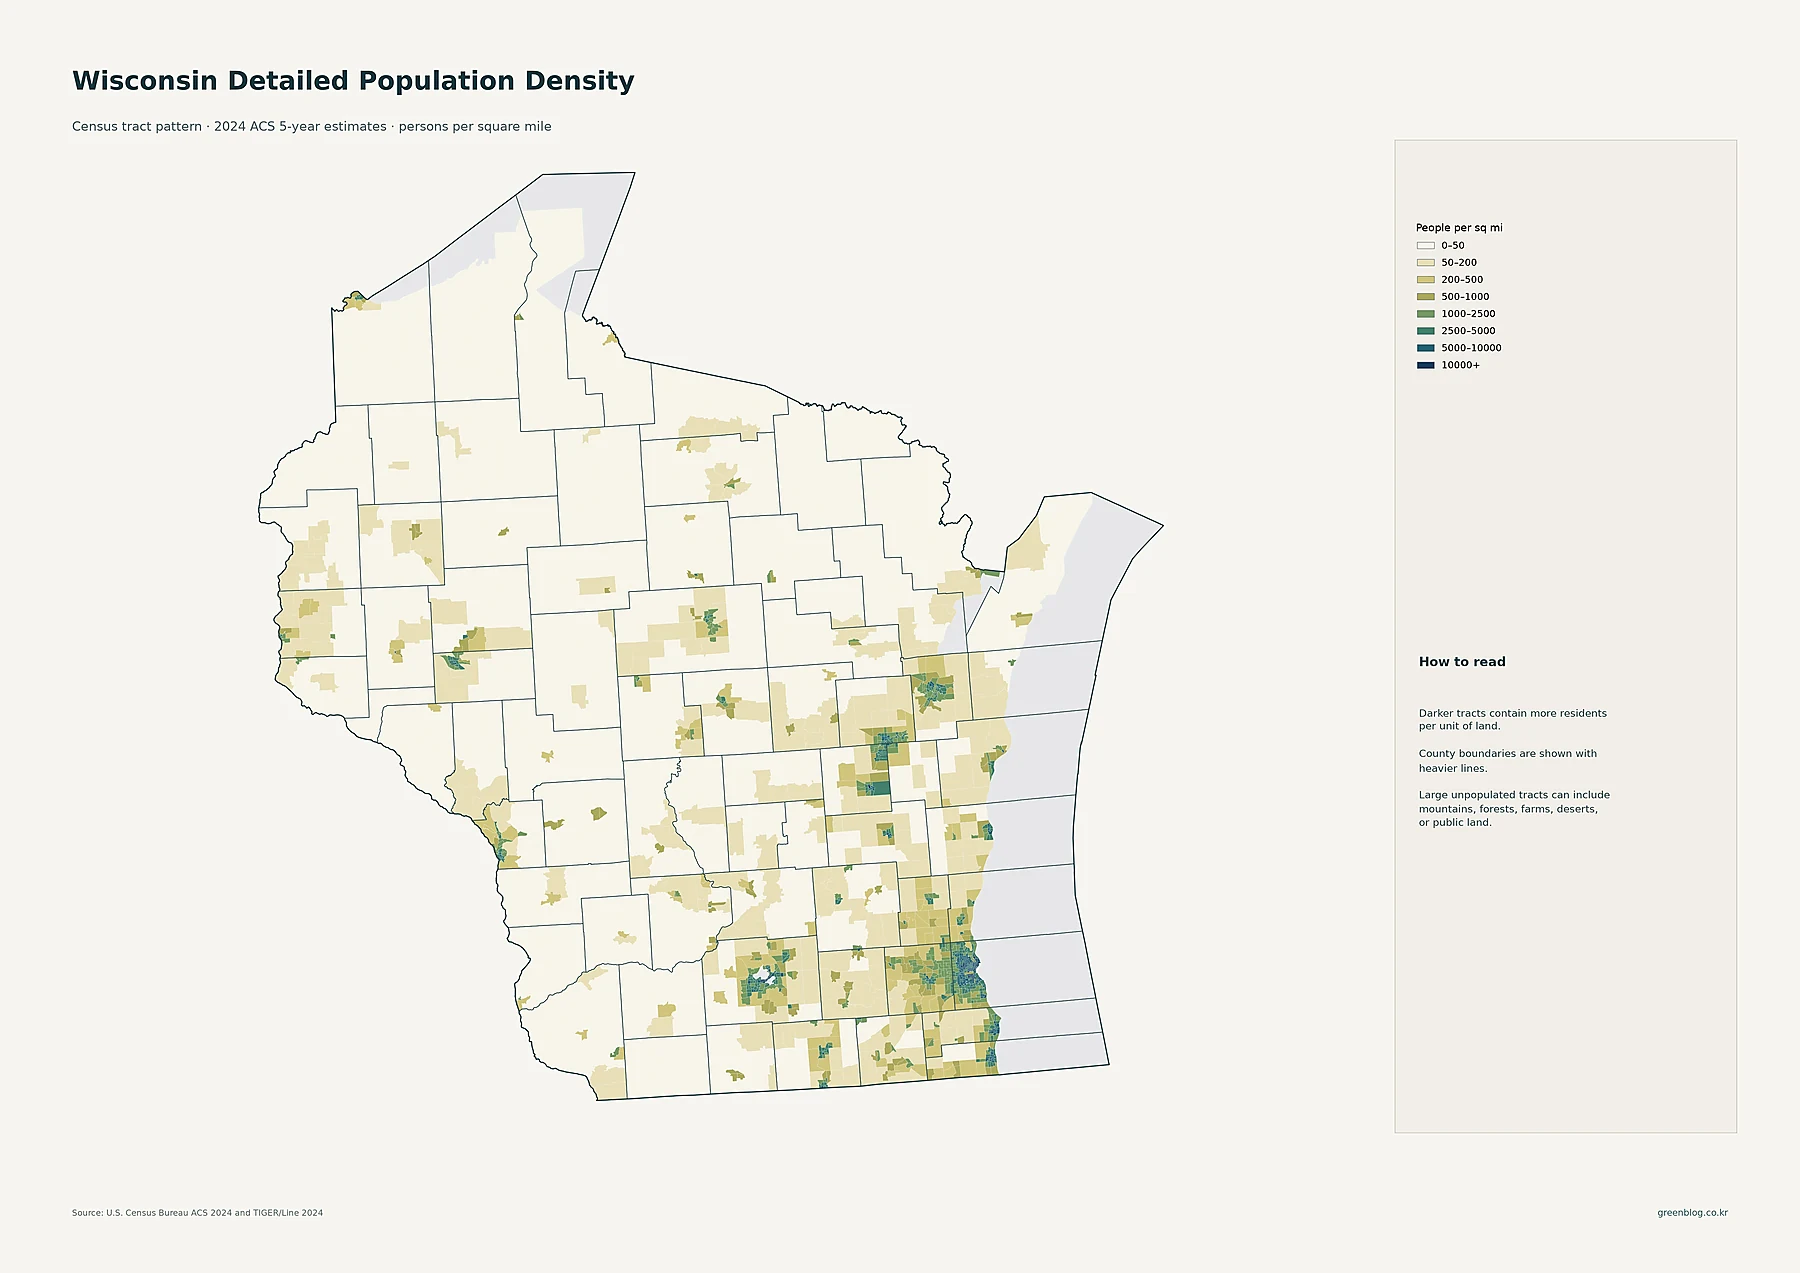
The southeast contains the clearest concentration. Milwaukee is surrounded by a broad group of denser tracts extending into nearby suburbs, while Racine and Kenosha form additional clusters along the Lake Michigan side of the state. Madison and its surrounding Dane County communities create another major concentration in south-central Wisconsin. Farther north and east, Green Bay and the Appleton–Oshkosh area stand out as a chain of urbanized density. Eau Claire and La Crosse form visible western nodes, and Wausau appears as a separate concentration in the central part of the state.
Much of northern Wisconsin is pale by comparison. That does not mean it is empty. Small, denser tracts appear around local population centers even where the surrounding county remains sparse. The detailed map is therefore useful for separating two ideas that county averages can blur: a county can have low overall density while still containing a compact town or city where residents are concentrated.
Milwaukee leads the city map, while Madison and Green Bay anchor separate centers
On the major-cities map, circle size represents the population of Census places rather than population density. Milwaukee is by far the largest place in the supplied 2024 ACS data at 566,973 residents. Madison follows at 278,001 and Green Bay at 106,253. Kenosha has 99,372 residents, Racine 77,633, Appleton 75,023, Waukesha 71,233, Eau Claire 70,322, Oshkosh 66,729, and Janesville 66,030.
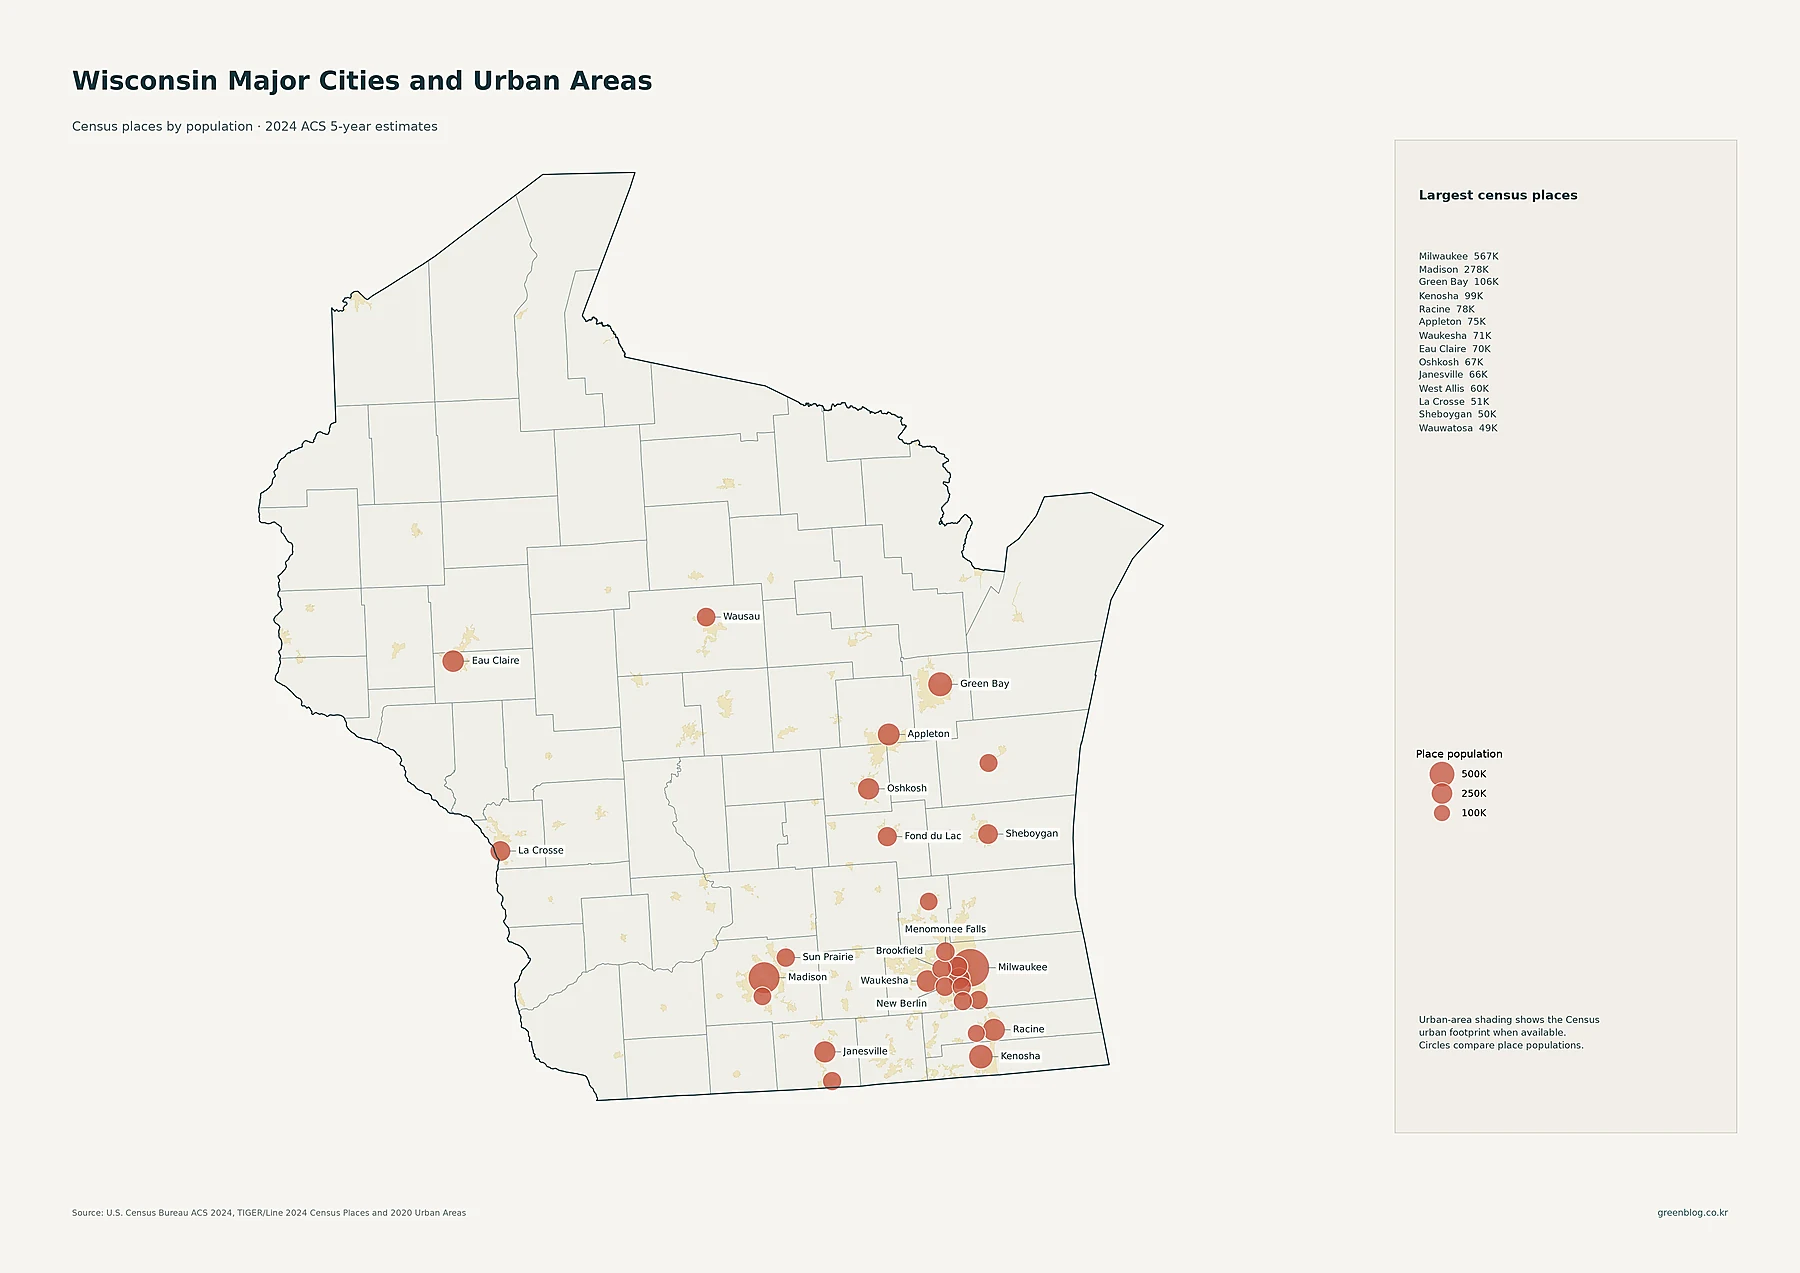
The spatial arrangement adds context that a ranked list cannot provide. Milwaukee sits inside a dense southeast cluster that also includes Waukesha, West Allis, Wauwatosa, Brookfield, New Berlin, Menomonee Falls and nearby places, with Racine and Kenosha farther south. Madison and Sun Prairie form another prominent group. Green Bay, Appleton, Oshkosh, Fond du Lac and Sheboygan mark several east-central and eastern population centers. Eau Claire and La Crosse stand out in western Wisconsin, while Wausau represents a major central-northern node.
County totals and county density tell different stories
Milwaukee County is also the state’s largest county by total population in the supplied ACS table, with 926,331 residents. Dane County has 572,674, Waukesha 411,762, Brown 270,892, Racine 197,532, Outagamie 192,826, Winnebago 171,769, and Kenosha 168,438. Rock County has 164,350 residents, while Marathon has 138,403. On this map, circle area represents total population only; it should not be read as a density symbol.
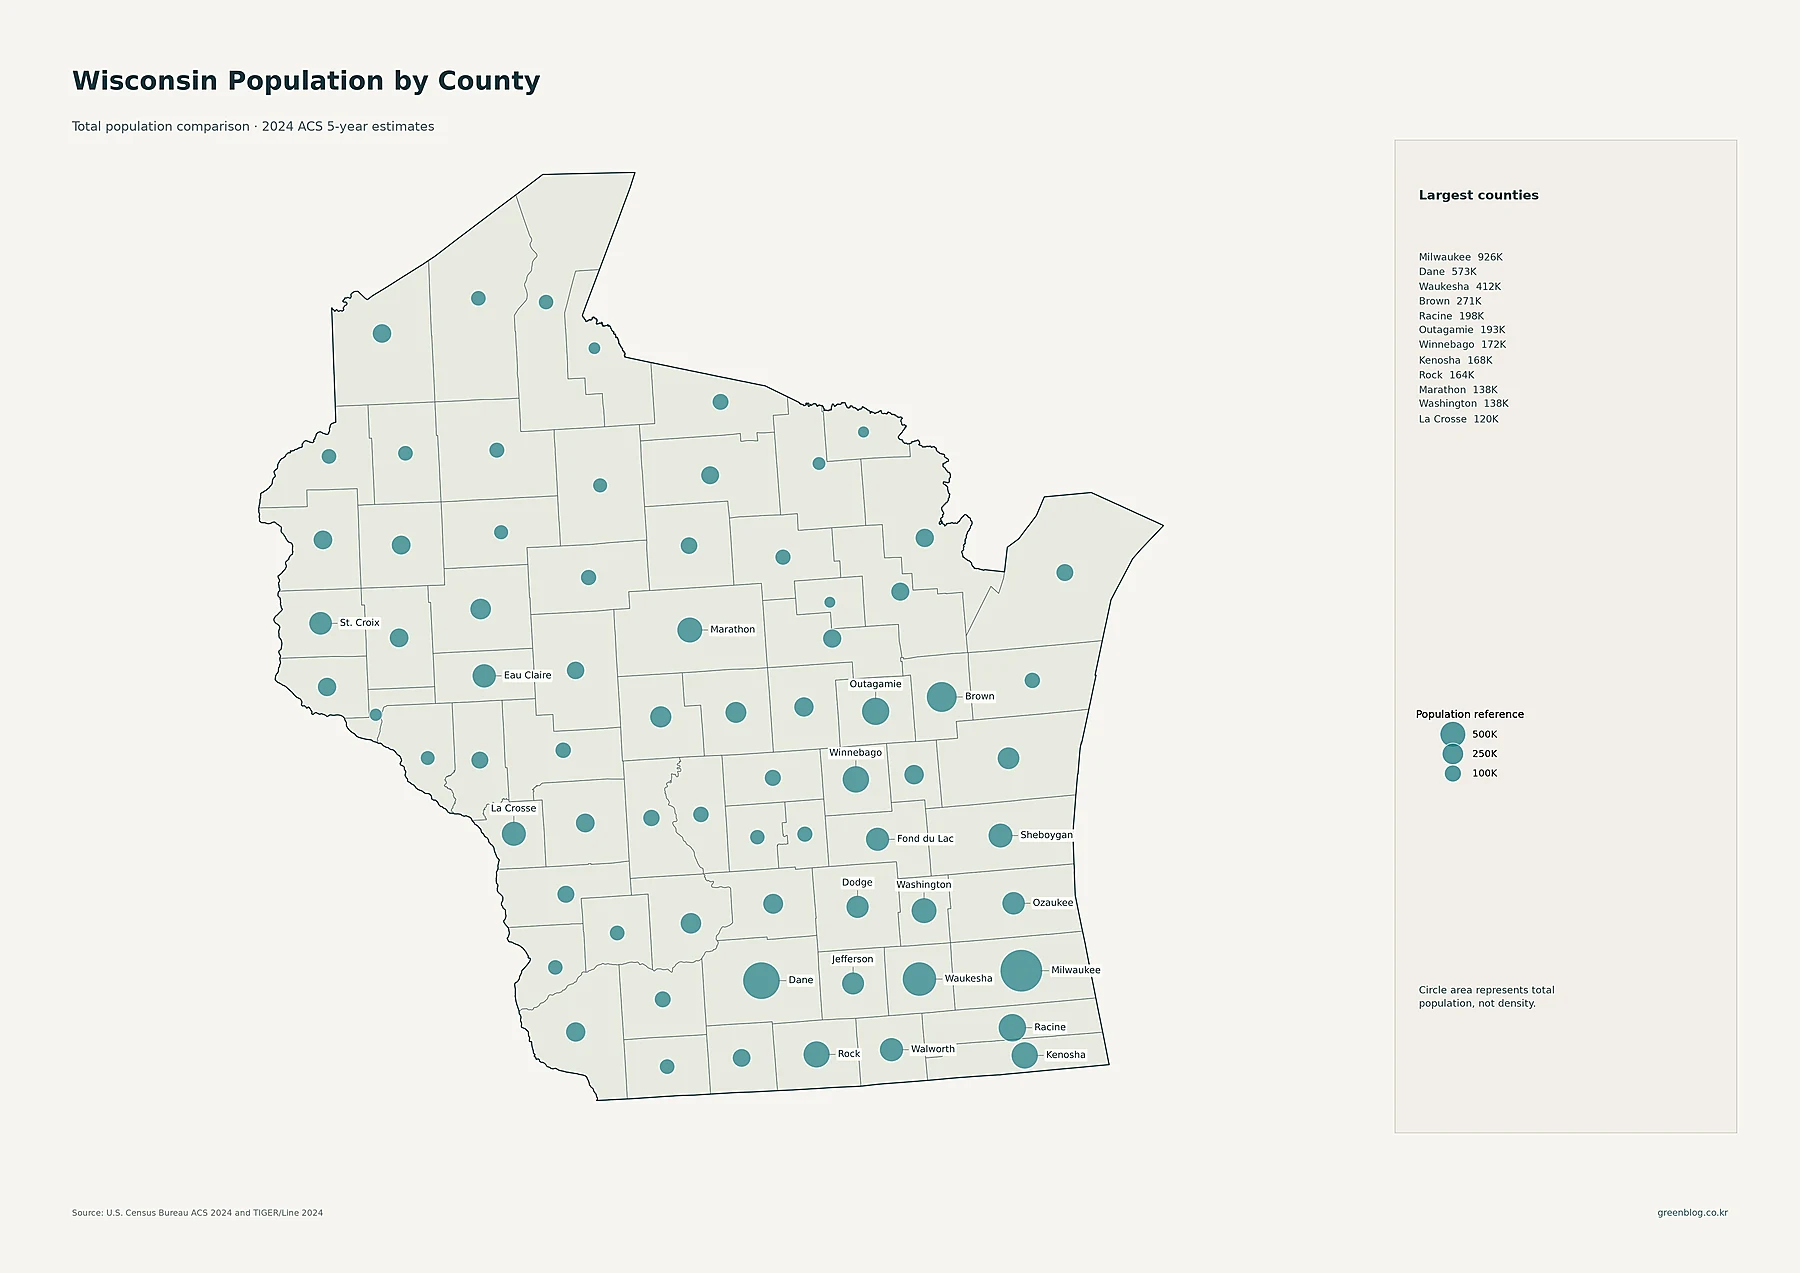
Density changes the ranking because land area matters. Milwaukee County remains first, at about 3,836 people per square mile, but Waukesha rises to about 749, Kenosha to 620, Racine to 594, Brown to 511, and Dane to 479. Ozaukee is about 399, Winnebago 395, Washington 320, and Outagamie 302. At the other end of the distribution, Iron is only about 8.2 people per square mile, Forest 9.2, Florence 9.5, Bayfield 11.2, and Price 11.2.
| County | 2024 ACS population | Density per sq mi | 2010–2020 change |
|---|---|---|---|
| Milwaukee | 926,331 | 3,836.4 | -0.9% |
| Dane | 572,674 | 478.6 | +15.0% |
| Waukesha | 411,762 | 749.0 | +4.4% |
| Brown | 270,892 | 511.0 | +8.4% |
| St. Croix | 96,033 | 133.0 | +10.9% |
| Iron | 6,210 | 8.2 | +3.7% |
Dane and St. Croix led 2010–2020 growth, while declines were generally modest
The population-change map uses the 2010 and 2020 decennial censuses rather than the 2024 ACS estimates. Blue classes indicate growth and warm colors indicate decline. In the supplied county table, 51 of Wisconsin’s 72 counties gained population over the decade and 21 declined. The pattern is mixed geographically, but the largest percentage growth is concentrated in a few counties that stand apart from the rest.
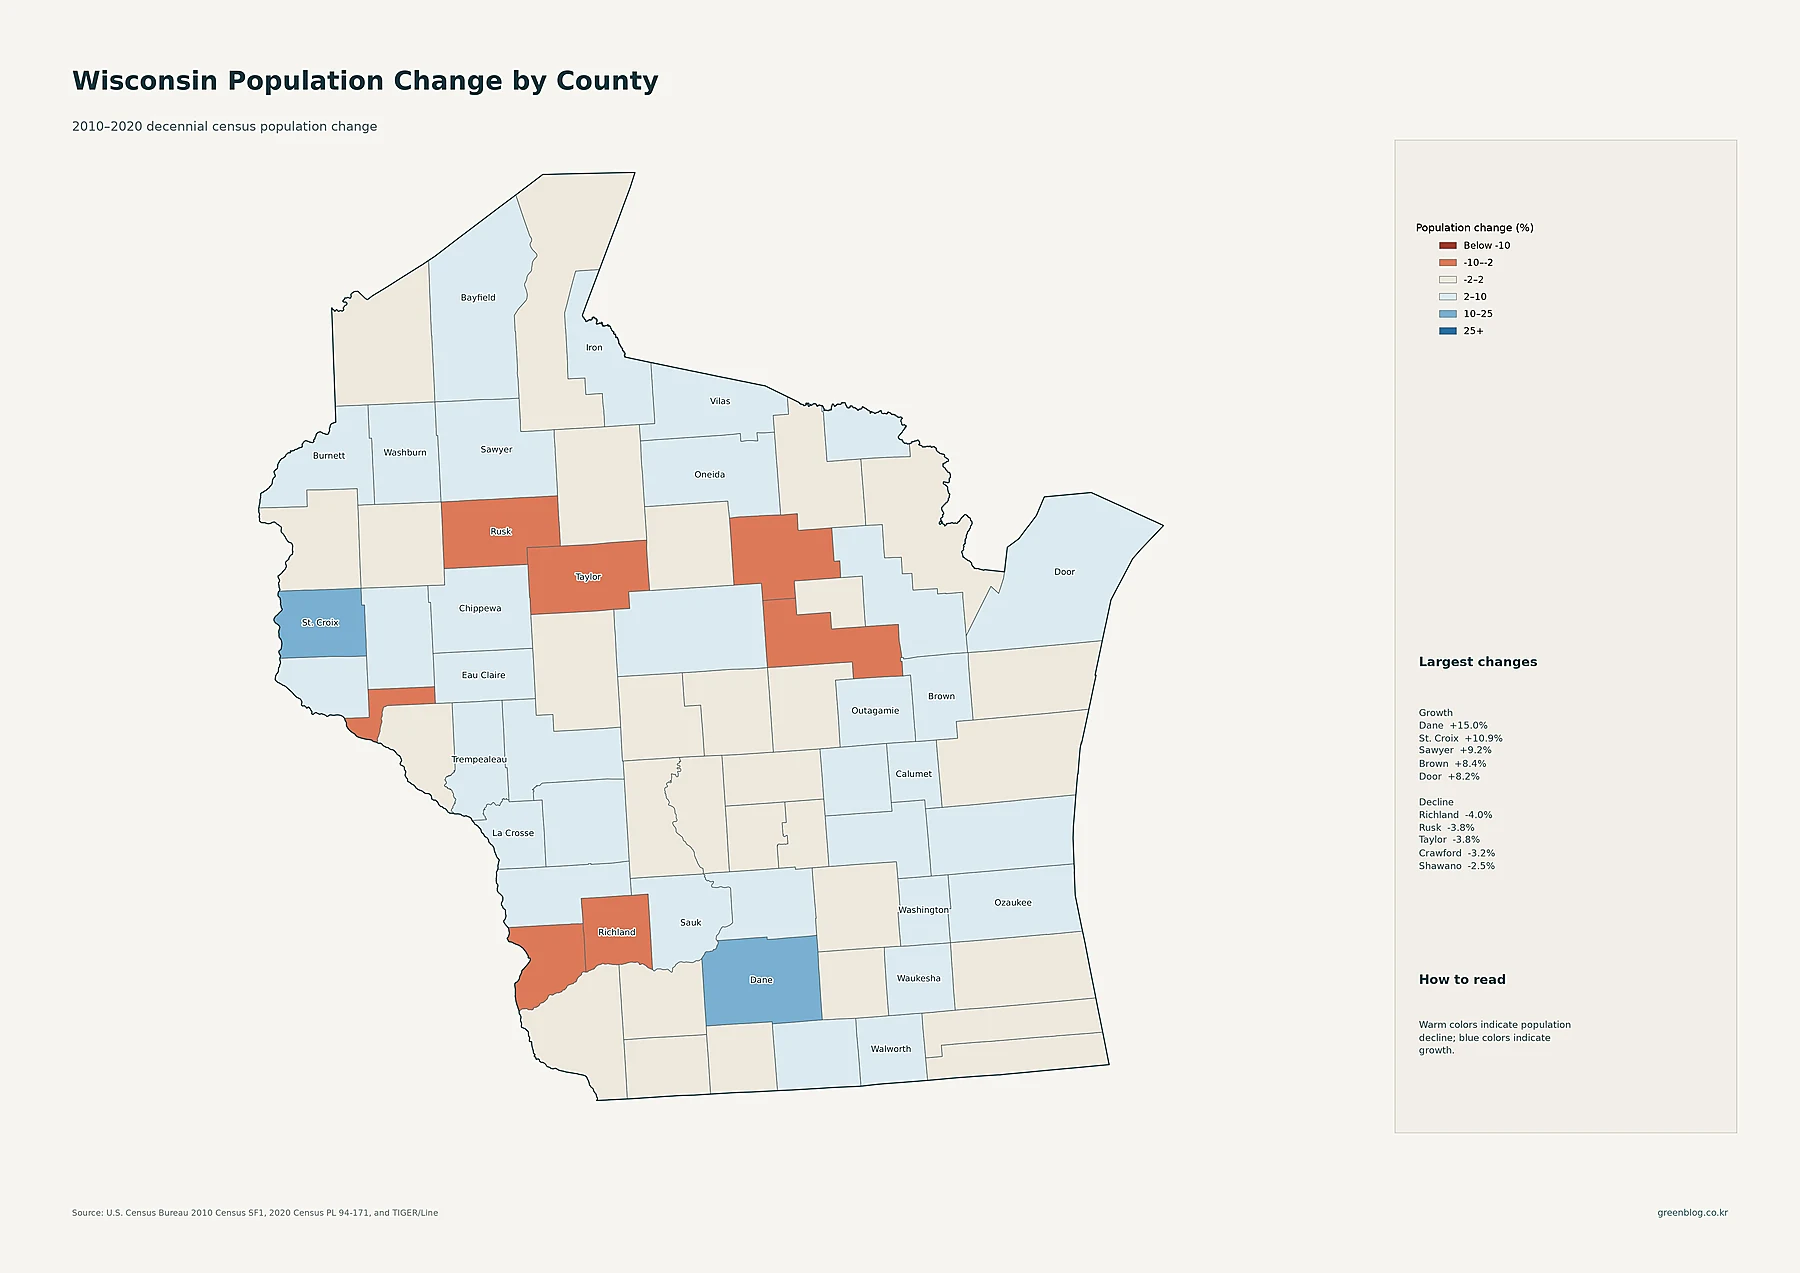
Dane County grew from 488,073 residents in 2010 to 561,504 in 2020, an increase of about 15.0 percent, the highest rate in the dataset. St. Croix grew 10.9 percent, Sawyer 9.2 percent, Brown 8.4 percent, Door 8.2 percent, Bayfield 8.0 percent, Outagamie 7.9 percent, and Vilas 7.5 percent. Eau Claire also grew by about 7.1 percent. Growth was therefore not limited to the largest metropolitan counties; several northern counties also fall into comparatively strong growth classes.
The largest declines were much smaller in magnitude than the strongest gains. Richland County fell about 4.0 percent, Rusk 3.8 percent, Taylor 3.8 percent, Crawford 3.2 percent, and Shawano 2.5 percent. Milwaukee County, despite having the state’s largest current population and by far its highest density, declined about 0.9 percent between the two censuses, from 947,735 to 939,489. This is a useful reminder that present-day size, present-day density and decade-long growth measure three different things.
Three checks make the Wisconsin maps easier to read
- Separate population from density: a large county circle means many residents, while the density map measures residents relative to land area.
- Compare county averages with tract detail: a low-density northern county can still contain a denser local center that is visible at the census-tract scale.
- Keep the dates straight: current distribution maps use 2024 ACS 5-year estimates, while the change map compares the 2010 and 2020 decennial censuses.
Taken together, the maps show a state with several distinct population systems rather than one uniform pattern. Milwaukee is the dominant high-density core and the southeast contains several of the state’s densest counties. Madison and Dane County combine substantial present-day density with the fastest 2010–2020 county growth. Green Bay and the Fox Valley form another prominent chain of population centers, while Eau Claire, La Crosse and Wausau provide regional nodes farther west and north. Much of northern Wisconsin remains sparse, yet some northern counties posted relatively strong decade growth. That combination is why both density and change maps are needed to understand the state.
Download the full Wisconsin population map set
The collection includes the detailed census-tract density map, major cities and urban areas, county population totals, 2010–2020 county population change, and county population density. Use the ZIP below to download the complete set, or open an individual map by selecting its image.
Frequently asked questions
Which Wisconsin county has the highest population density?
Milwaukee County is highest in the supplied 2024 ACS data at about 3,836 people per square mile. Waukesha is next at about 749, followed by Kenosha at about 620.
Which Wisconsin county grew fastest from 2010 to 2020?
Dane County had the largest percentage increase at about 15.0 percent. St. Croix followed at about 10.9 percent and Sawyer at about 9.2 percent. These rates compare the 2010 and 2020 decennial census counts.
Is Milwaukee city population the same as Milwaukee County population?
No. The 2024 ACS data in this package list the Milwaukee Census place at 566,973 residents and Milwaukee County at 926,331. The city map and county map use different geographic units.
Related Maps
Sources
- U.S. Census Bureau — American Community Survey Data: population and small-area estimates used for the 2024 ACS maps.
- U.S. Census Bureau — 2024 TIGER/Line Shapefiles: county, census tract and Census place boundary data.
- U.S. Census Bureau — 2010 Census Summary File 1: 2010 population reference data.
- U.S. Census Bureau — 2020 Census P.L. 94-171: 2020 population reference data.
Note: Values should be read according to the source and year printed on each map. ACS figures are survey-based estimates, while the 2010–2020 change map compares decennial census counts.
Green Map creates custom-edited map images using open geographic data sources such as geoBoundaries, Natural Earth, OpenStreetMap, and government open data. These maps are edited visual materials, not raw data files, and are provided for education, documents, presentations, and graphic reference.