You can download the Sullivan County map files on this page as a ZIP containing high-resolution A3 JPG images, while the WebP previews below make it easy to inspect the county before saving the originals. Sullivan County is not visually uniform. The western half is crowded with places and roads around Kingsport, Blountville, and Bristol, whereas the long eastern end contains far fewer city labels and much more water-and-relief detail around South Holston Lake and the high ridges.
That east–west contrast is the best way to approach the map set. A city-focused view makes Kingsport, Bristol, and Bluff City easy to compare. The terrain-and-water view replaces much of that urban detail with the North Fork Holston River, South Fork Holston River, Watauga River, Boone Lake, and South Holston Lake. The elevation map then explains why the eastern end looks so different: the mapped surface rises from lower western valleys to an actual high near 1,312 meters along the eastern mountain belt.
Table of Contents
A busy western half and a long mountain-and-lake extension to the east
The general county map places most of its named urban features in the west and center. Kingsport anchors the western side, with Bloomingdale, Sullivan Gardens, Colonial Heights, Orebank, and other labels close by. Blountville sits farther east in the central corridor, and Bristol appears near the northern edge. Bluff City is separated from those larger urban labels to the south. The county then narrows and stretches eastward, where settlement labels become sparse and the map is dominated by roads, streams, and the outline of the uplands.
I-81 is one of the clearest long routes through the central and northern part of the county. Around Kingsport, the map also emphasizes 11W and Route 1, while routes 421 and 34 appear in the eastern section. The important point is not the route number list by itself; it is how the road network changes as the county changes. Western Sullivan County has several roads converging around named communities, while the eastern end has fewer major junctions and a stronger relationship with the mountain valleys and reservoir arms.
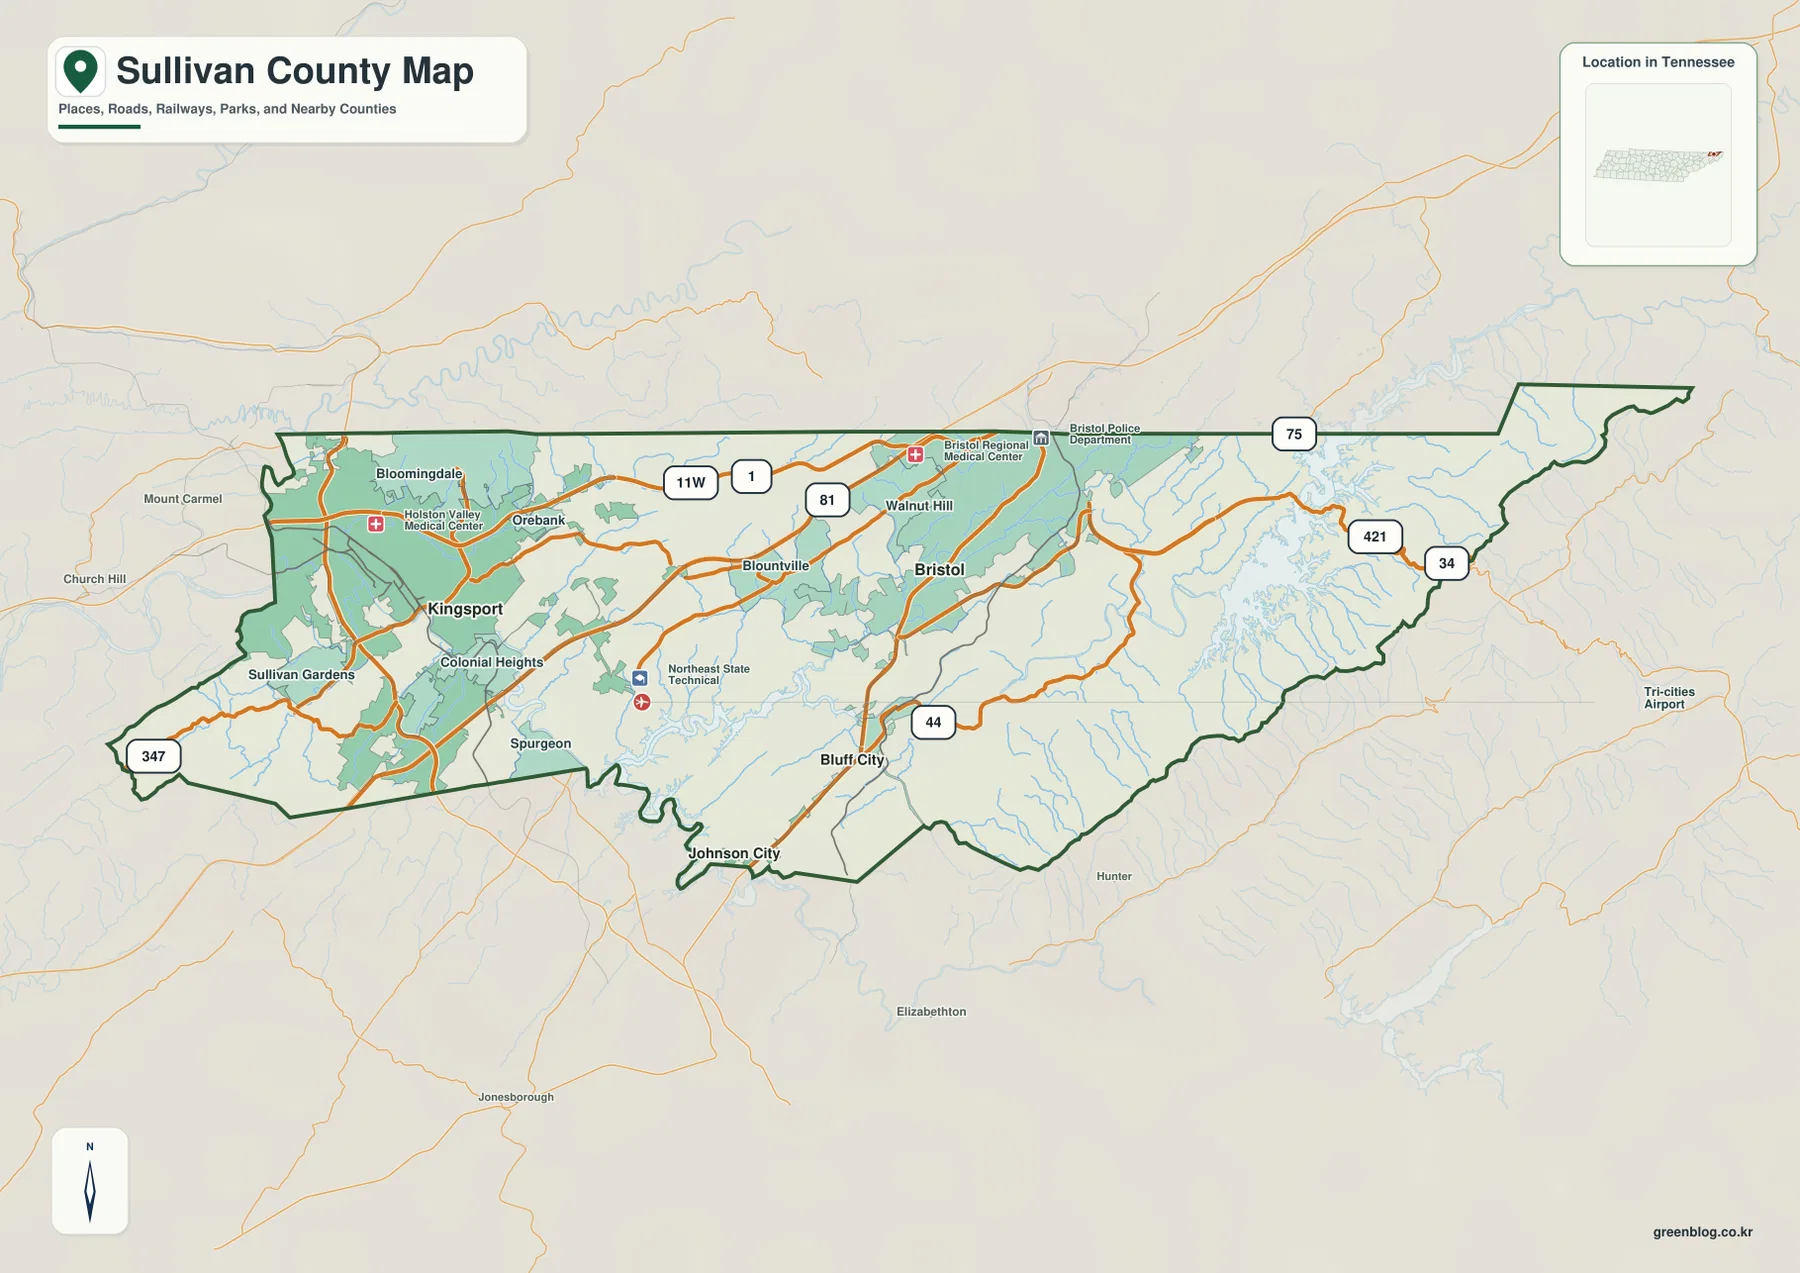
The outline itself deserves attention. The western section is broad enough to contain several closely spaced communities, but the eastern section becomes a long projecting wedge. Bristol is positioned near the northern edge, while Bluff City is closer to the southern water corridor. This geometry means that a place can be relatively close on the page yet still require a route that follows a valley, crosses a water body, or stays within the narrow county shape.
Blountville is the county seat, but Kingsport and Bristol dominate the city view
The supplied county reference identifies Blountville as the county seat. The city map, however, ranks Kingsport, Bristol, and Bluff City rather than treating Blountville as the largest urban center. This is a useful distinction because county government and city size are different questions. A visitor looking for the administrative center should start with Blountville, while someone comparing the county’s largest mapped cities will naturally focus first on Kingsport and Bristol.
The city index printed on the map lists Kingsport at 56,262, Bristol at 27,636, and Bluff City at 2,225. Those figures are part of the map’s city-ranking graphic, so they are best used to understand the relative emphasis of this particular map rather than as a replacement for a current population table. Spatially, the three labels are also separated: Kingsport is in the west, Bristol is farther northeast, and Bluff City sits south of the central corridor.
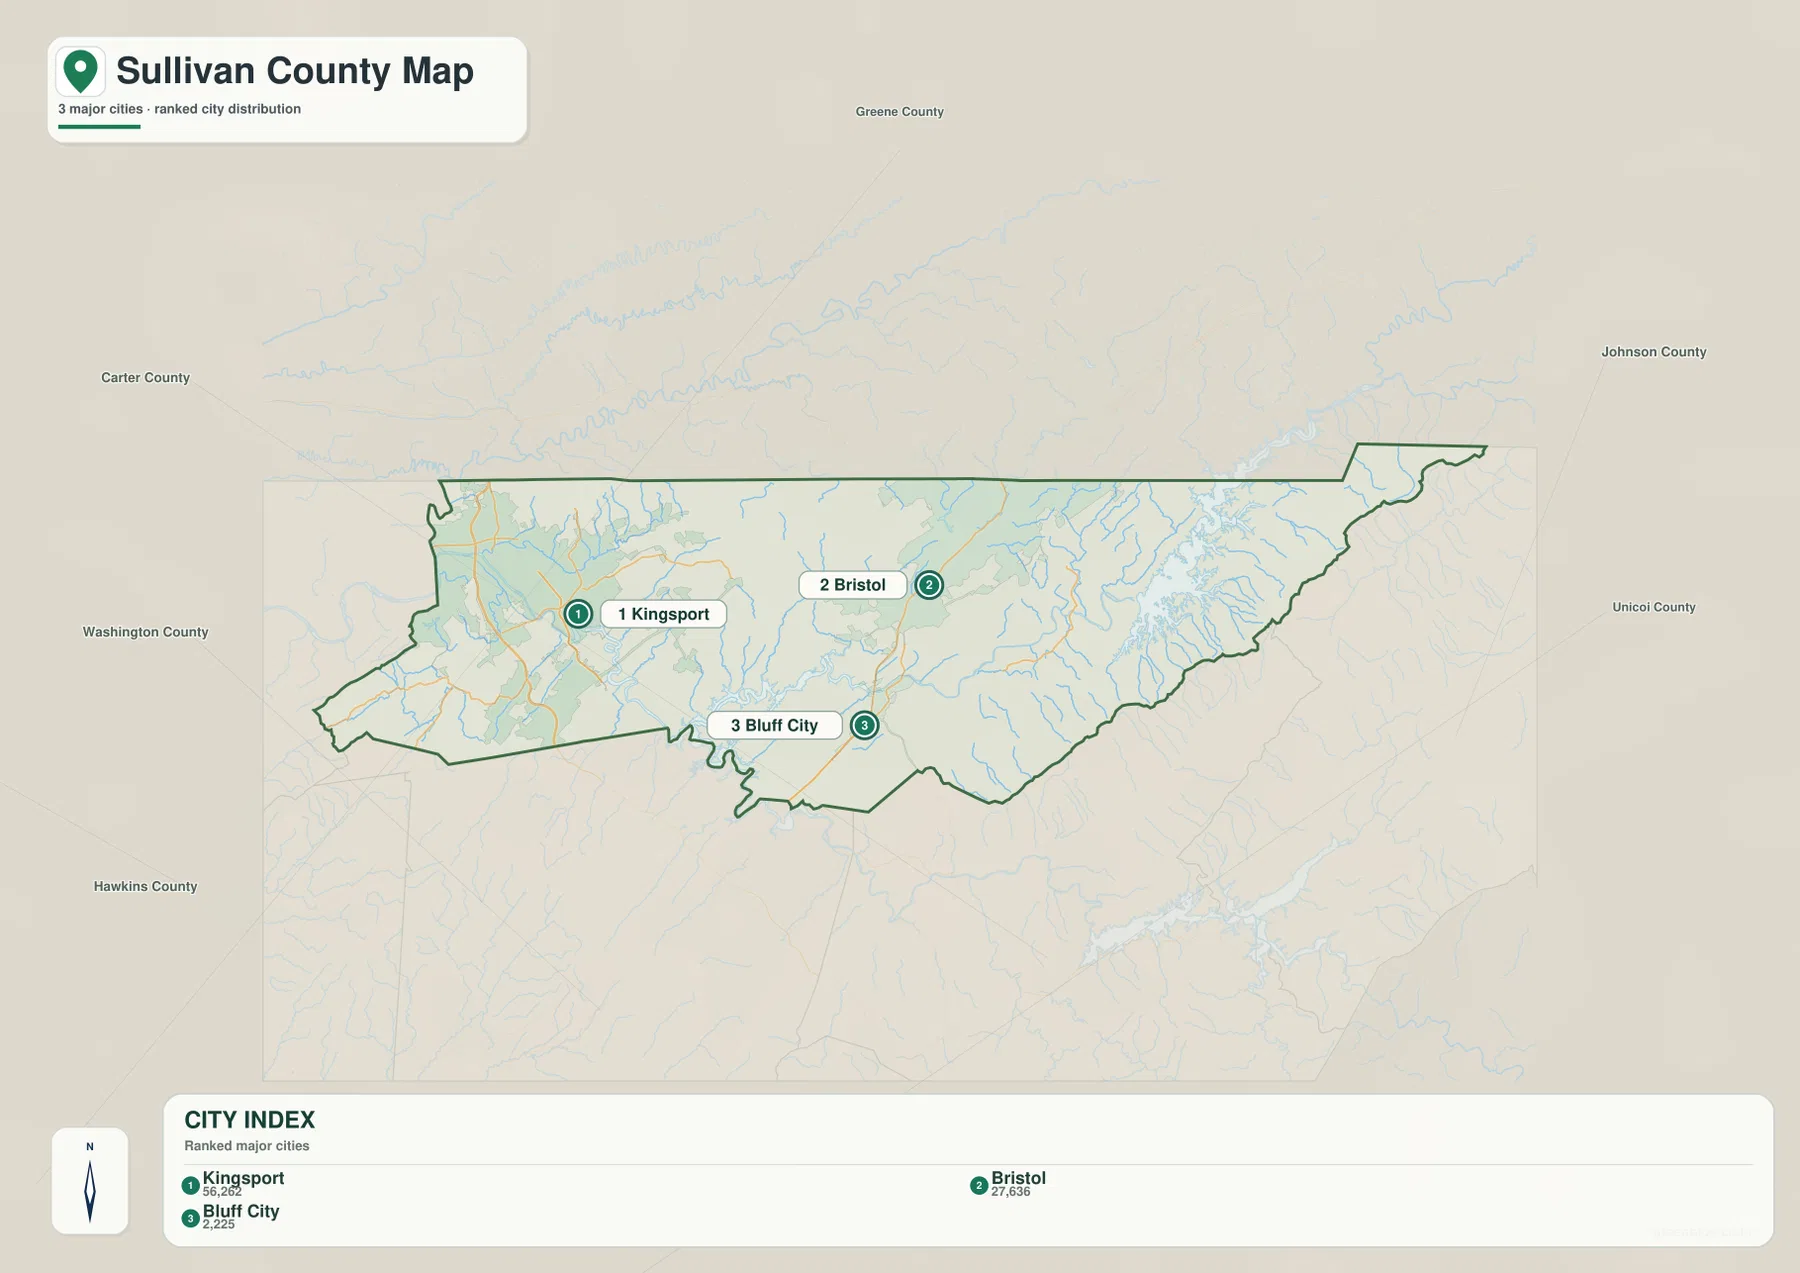
Comparing the city view with the general map adds Blountville back into the picture and shows why it matters. Blountville occupies the central area between the larger city concentrations, close to the county’s main road framework. Bluff City, by contrast, is more closely associated with the southern water corridor. The county therefore has an administrative reference point, a western urban concentration, a northern-edge city, and a smaller southern city that should not be collapsed into one generic “county center.”
Holston forks, the Watauga River, and two very different reservoir settings
The water map changes the way Sullivan County looks. The North Fork Holston River is labeled along the northwestern side, while the Holston River appears farther west. In the eastern half, the South Fork Holston River is tied to South Holston Lake. South of the central corridor, the Watauga River enters the Boone Lake area. These named waters occupy different parts of the county, so the water network is not simply one river running from one end to the other.
Smaller streams fill in the valleys between those larger waters. Horse Creek, Kendrick Creek, Reedy Creek, Fall Creek, Muddy Creek, and Beaver Creek are all labeled on the supplied terrain-and-water map. Their winding courses fit the long parallel ridges visible in the shaded relief. This is especially helpful around the urban west, where a road map alone can look complicated; the creek valleys explain why many local routes bend and why some neighborhoods occupy narrow low corridors between ridges.
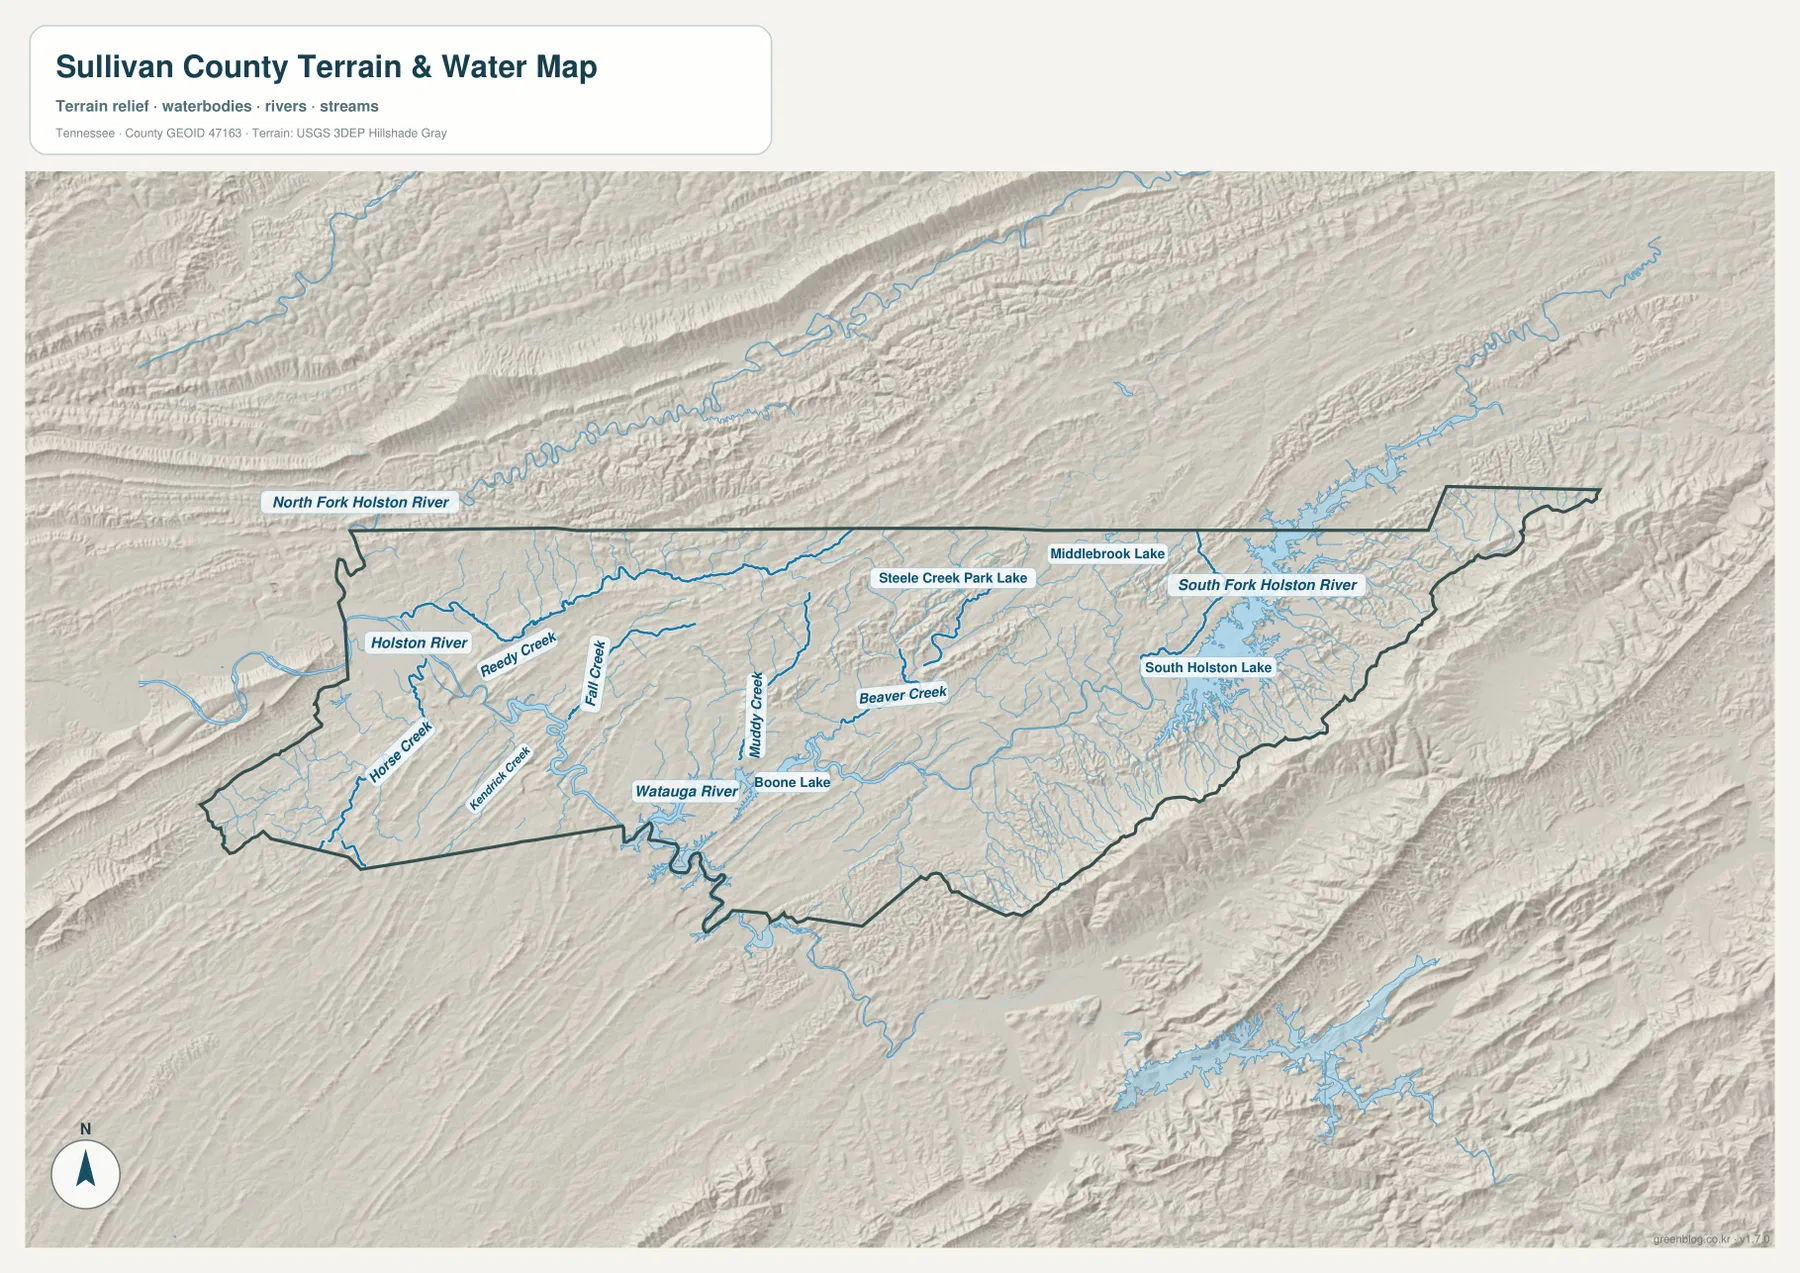
Boone Lake and South Holston Lake have noticeably different settings. Boone Lake lies near the southern-central part of the county and is closely tied to the Watauga River corridor. South Holston Lake occupies the eastern mountain section, where long reservoir arms extend into narrow valleys. Steele Creek Park Lake and Middlebrook Lake are also labeled, but they are much smaller features at county scale. The water map is a geographic reference, not a live lake-level, flood, or boating chart.
Elevation rises sharply toward the eastern end
The elevation map gives Sullivan County an especially clear regional signature. Its legend reports an actual range of about 333 to 1,312 meters and a mean near 519 meters. Most of the west and center appear in green shades, but the eastern and southeastern edge climbs through yellow and brown into the highest class. The strongest elevation change is therefore concentrated toward the long eastern end rather than spread evenly across the county.
The central green area is still far from flat. Closely spaced ridges run in long northeast–southwest bands, with narrow valleys between them. This repeated ridge-and-valley texture is visible even where the color remains relatively low. When the water map is placed beside the elevation map, creeks such as Reedy Creek and Fall Creek fit into those lower corridors, while South Holston Lake sits against much steeper high ground farther east.
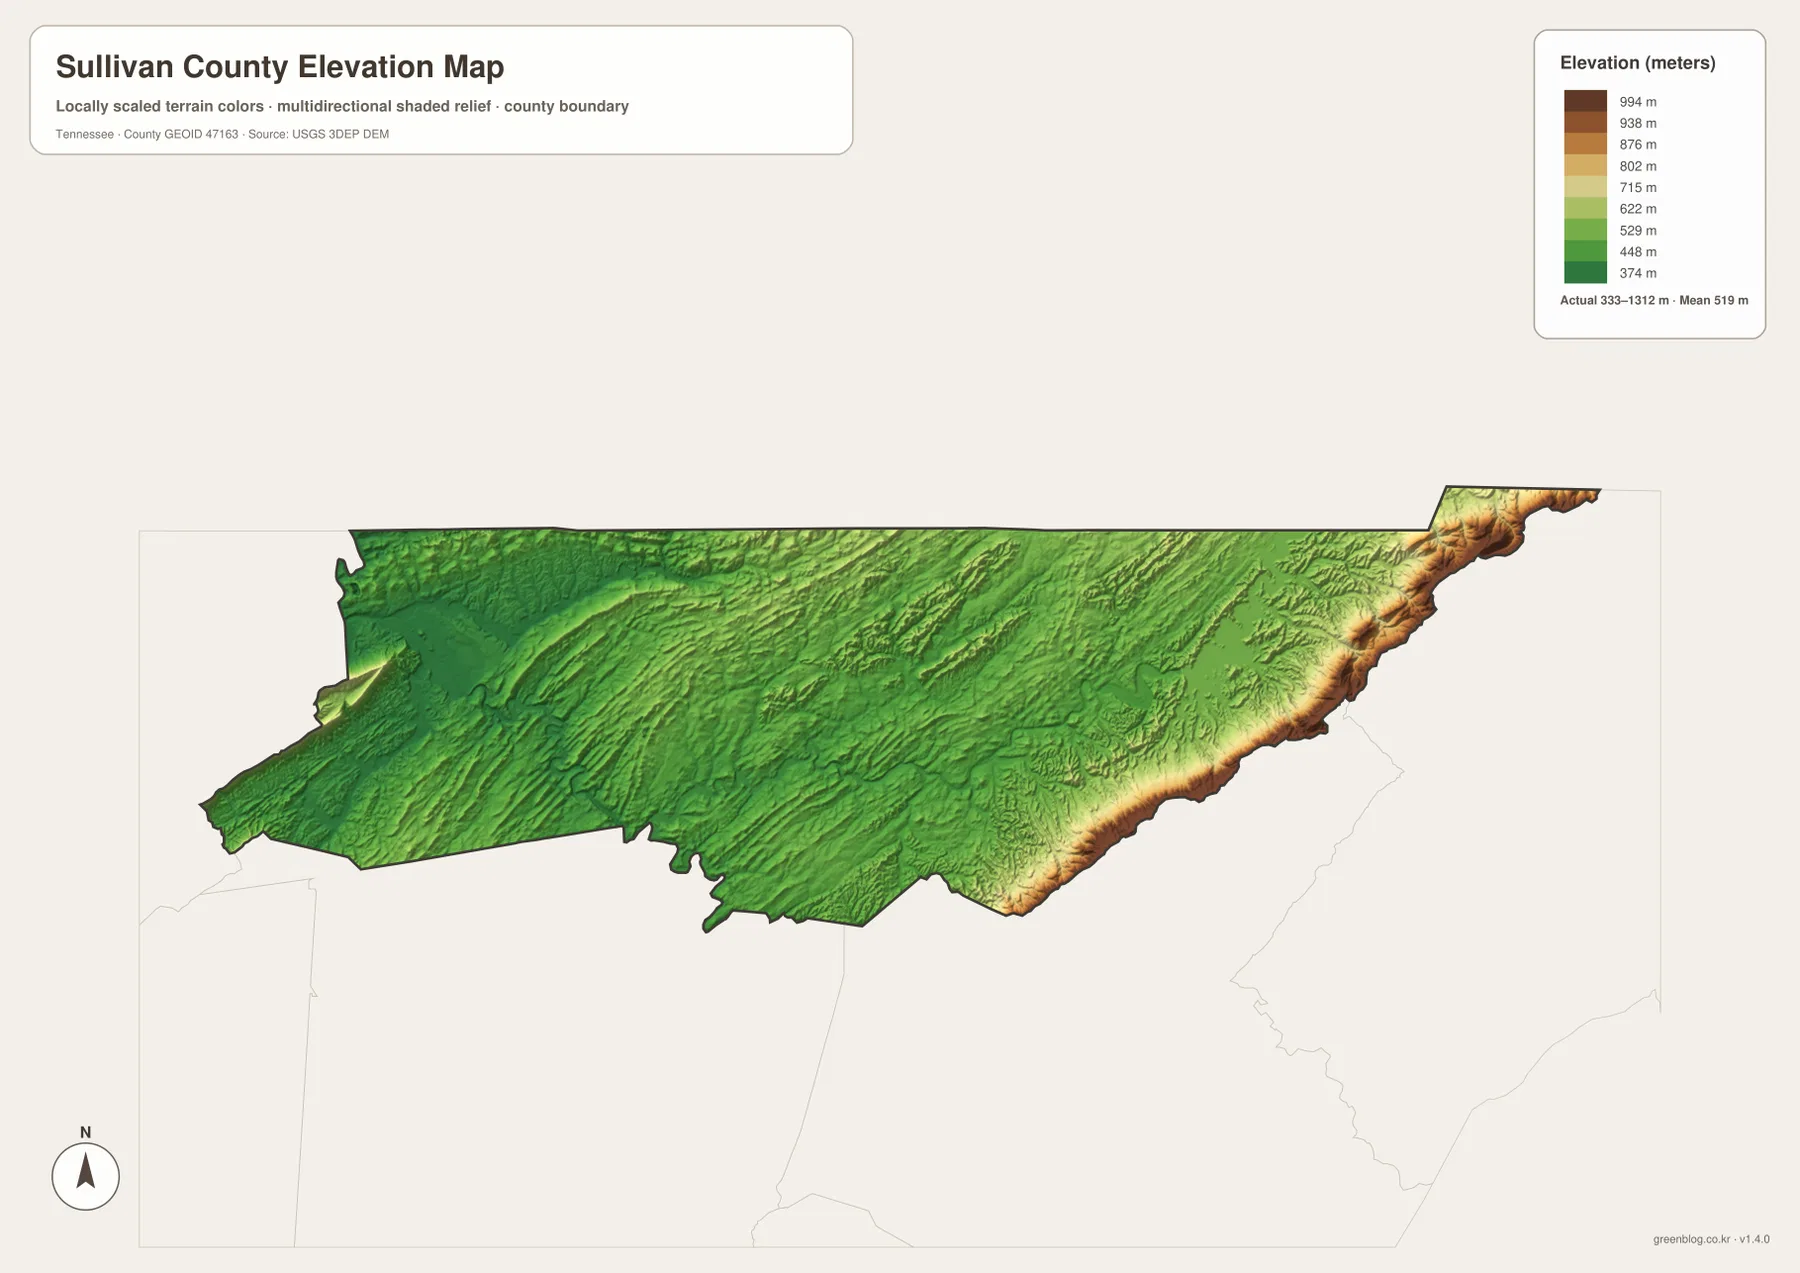
This difference helps explain the distribution seen on the other maps. The Kingsport–Blountville–Bristol side has a denser road and settlement pattern across lower valleys, while the eastern mountain section has fewer large place labels and more terrain constraints. The elevation layer should still be read at county scale. It is not precise enough to establish a parcel elevation, construction slope, driveway grade, or survey benchmark.
Roads make more sense when the rivers and ridges are visible
The general map shows a complicated western transportation network, but the terrain maps explain why that network does not form a simple grid. Roads pass through elongated valleys, cross creeks at selected points, and connect the larger urban labels without ignoring the parallel ridges. I-81 remains a prominent county-scale route, yet local movement around Kingsport, Blountville, Bristol, and Bluff City depends on much more than one highway.
The eastern end demonstrates the same relationship more dramatically. South Holston Lake breaks the landscape into narrow water arms, and the highest ridges rise nearby. A route that looks short in straight-line distance can therefore be shaped by the available valley, reservoir crossing, or mountain pass. This is why the county map is most informative when paired with the water and elevation views rather than used as a stand-alone road diagram.
The supplied reference material lists a 2020 census population of 158,163 and a July 2025 estimate of 163,759. It also lists 413.5 square miles of land and 16.2 square miles of water. Those countywide numbers provide scale, but the maps add the geographic distribution that the totals cannot show: dense urban labeling in the west, a central road corridor, reservoir-influenced southern and eastern areas, and a much higher mountain edge to the east.
Which map should you use for a Sullivan County question?
Start with the county map when you need the broad relationship among Kingsport, Blountville, Bristol, Bluff City, and the major roads. Use the city map when the main task is comparing the three ranked city labels without the extra geographic detail. If the question involves the Holston system, Watauga River, Boone Lake, South Holston Lake, or named creeks, the water map is the clearest choice.
The elevation map becomes most valuable when a location question turns into a terrain question. It shows why the eastern end has a different road and settlement pattern and why some stream valleys create natural low corridors through the central ridges. For printed notes, it can be useful to keep a road-and-city copy separate from a water-and-relief copy so the annotations do not cover the features you are trying to compare.
The historical material supplied with the package says Sullivan County was established in 1779 and identifies Blountville as the county seat. That helps separate historical administration from the modern city pattern. Blountville is the correct administrative reference, Kingsport and Bristol are the dominant city labels in the map set, and South Holston Lake with the eastern ridge is the strongest physical-geography reference. Each answers a different kind of location question.
Frequently Asked Questions
Why is Blountville important if Kingsport is the largest city shown on the city map?
Blountville is identified in the supplied reference material as the county seat, so it is the administrative reference point. The city map ranks Kingsport, Bristol, and Bluff City by the values printed in its city index. The two maps are answering different questions: one helps locate county government, while the other emphasizes major city locations and relative city size.
What is the difference between Boone Lake and South Holston Lake on these maps?
Boone Lake appears in the southern-central part of the county along the Watauga River corridor. South Holston Lake is farther east and is surrounded by much higher relief, with long reservoir arms reaching into mountain valleys. Comparing the water and elevation maps makes this contrast especially clear.
Where does Sullivan County reach its highest elevations on the map?
The highest colors are concentrated along the eastern and southeastern edge. The elevation legend gives an actual county range of about 333 to 1,312 meters, with a mean around 519 meters. Western and central valleys are generally lower, although they still contain many parallel ridges.
Map File Information
The ZIP contains the high-resolution JPG versions of the Sullivan County map, city map, water map, and elevation map used in this article. All four originals use the A3-format layout and are better suited to printing or enlarged viewing than the WebP previews in the page body.
- Included Files: County map, city map, water map, and elevation map
- File Type: ZIP containing 4 JPG images
Related Maps
- Alamo to Gadsden: A Crockett County Tennessee Map
- Altamont, Monteagle, and Plateau Valleys — Grundy County Tennessee Map
- Around Chattanooga: Hamilton County Tennessee Map
Sources and References
- Tennessee State Library and Archives Sullivan County fact sheet
- Tennessee Department of Transportation Sullivan County map
- U.S. Census Bureau Sullivan County QuickFacts
- USGS National Hydrography
- USGS 3D Elevation Program
Green Map creates custom-edited map images using open geographic data sources such as geoBoundaries, Natural Earth, OpenStreetMap, and government open data.
These maps are edited visual materials, not raw data files, and are provided for education, documents, presentations, and graphic reference.