Pike County is one of the most clearly forest-dominated counties in this Arkansas map series. The 2025 summary assigns 63.86% of the county to forest, while agriculture accounts for 12.45%, shrubland 7.18%, grassland 6.14%, and developed cover 5.69%. Lake Greeson forms the most prominent water feature inside the county, with a broad blue shape surrounded by extensive wooded land.
Four views are provided here: current land cover, a forest-and-farmland emphasis, impervious surface and developed land, and a 1985–2025 class comparison. The page previews are designed for quick viewing, and the four original JPG maps are available together in one download farther down the article. Using the set side by side makes it easier to separate a heavily wooded landscape from its smaller farming areas, settlement clusters, and long-term mapped differences.
Table of Contents
A 2025 county view dominated by forest rather than one continuous farm belt
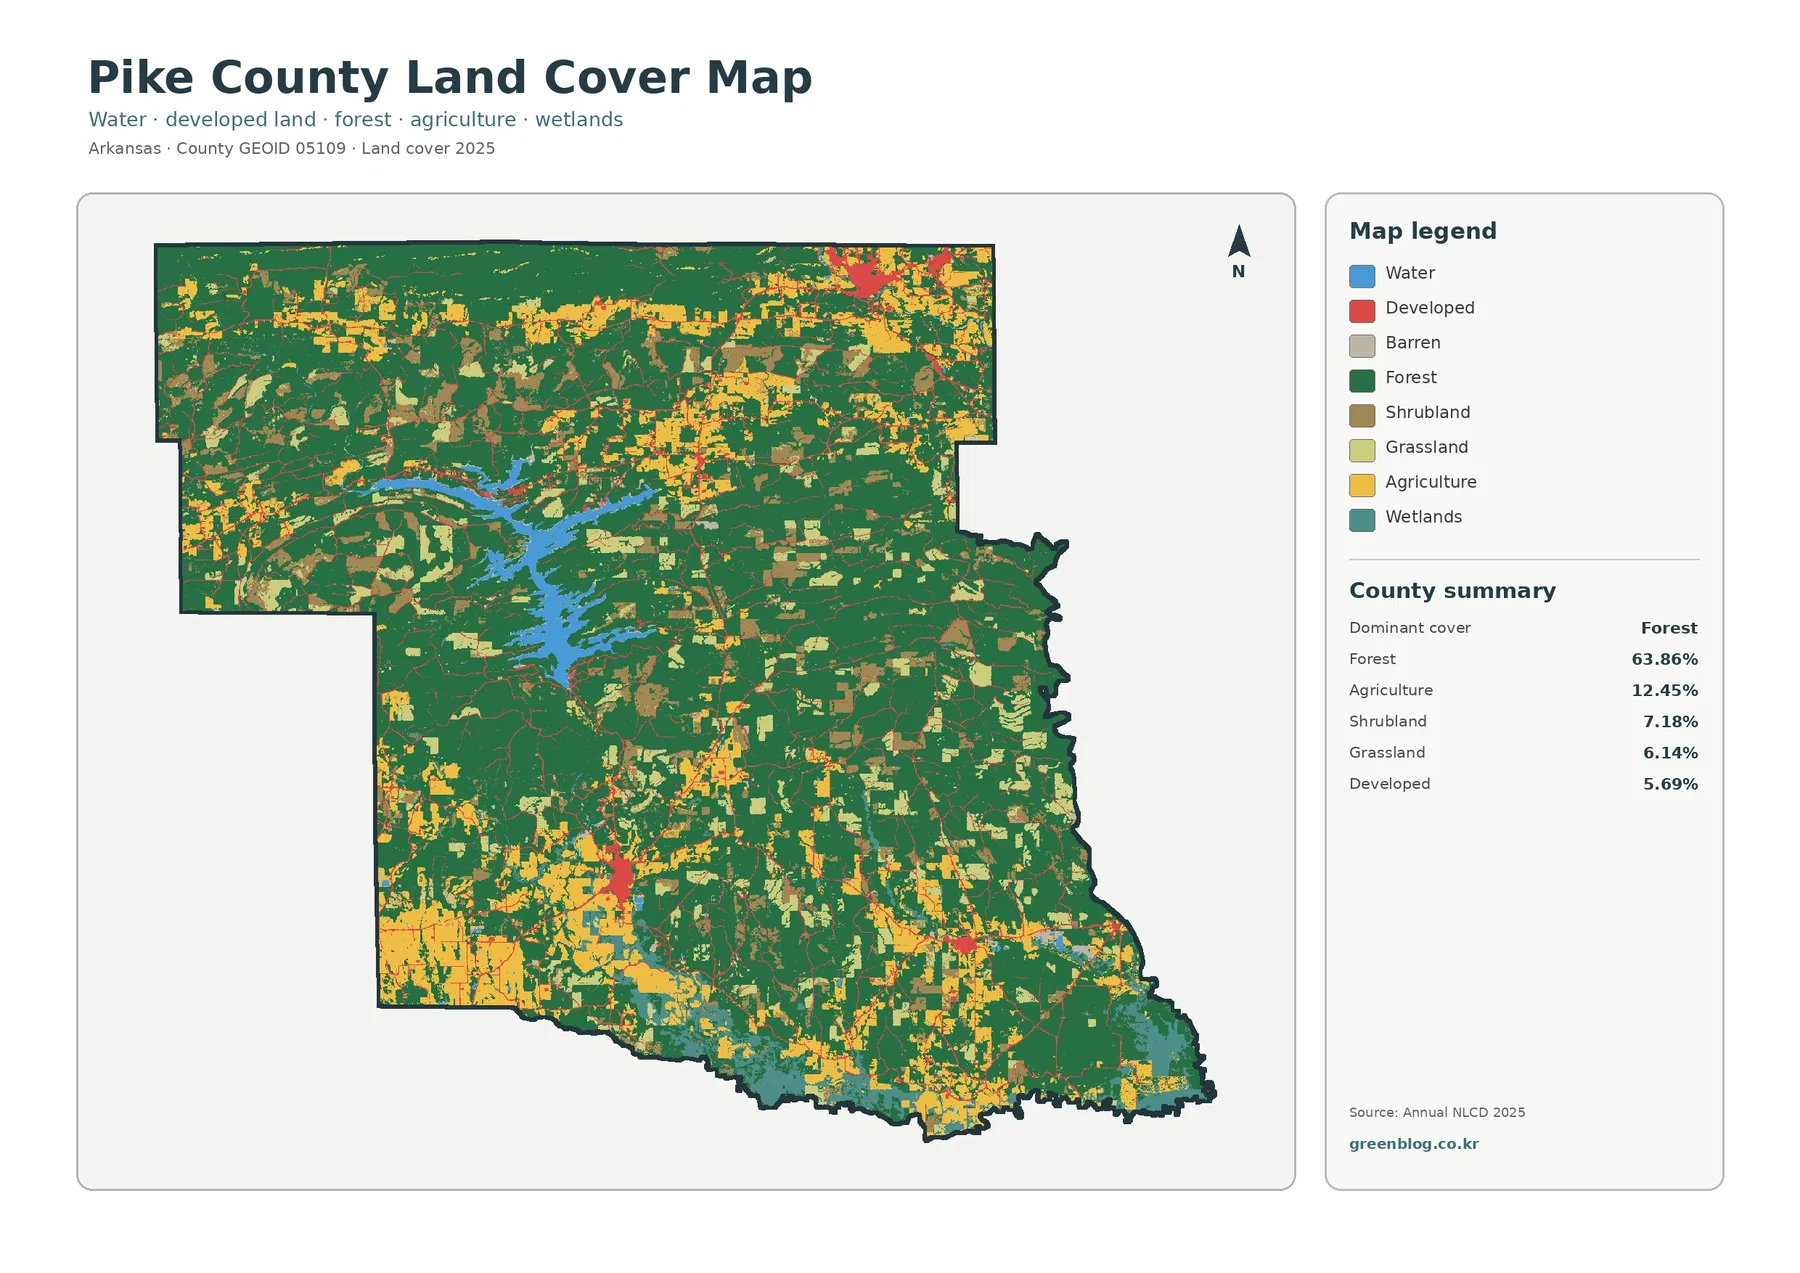
The general map gives the quickest overview of how different covers share the county. Dark green forest fills most of the interior, eastern side, and large parts of the north. Agricultural cover is much more fragmented, appearing in a series of yellow patches near the northern edge, the southwest, the south, and smaller openings elsewhere. Shrub and grass classes add another layer of open land between the larger wooded blocks, so the nonforest portion cannot be described simply as farmland.
Land cover should not be confused with ownership, zoning, or legal land use. A green cell means the surface was classified as forest in the dataset; it does not identify a national forest boundary, a timber company holding, or a private parcel. A yellow agricultural cell likewise does not provide a farm boundary or crop name. The map is best used to compare broad surface conditions across the county before turning to parcel records or local planning sources for legal detail.
Lake Greeson anchors the most recognizable water-and-forest pattern
Pike County’s official website highlights the Caddo River, Little Missouri River, and Lake Greeson among the county’s major natural features, and the lake is immediately recognizable in the supplied maps. The U.S. Army Corps of Engineers identifies Lake Greeson as a reservoir on the Little Missouri River in Pike County. On the land-cover image, its branching shoreline cuts into a broad field of forest, producing one of the clearest contrasts on the page.
Impervious surfaces reveal the settlement network without overwhelming the county
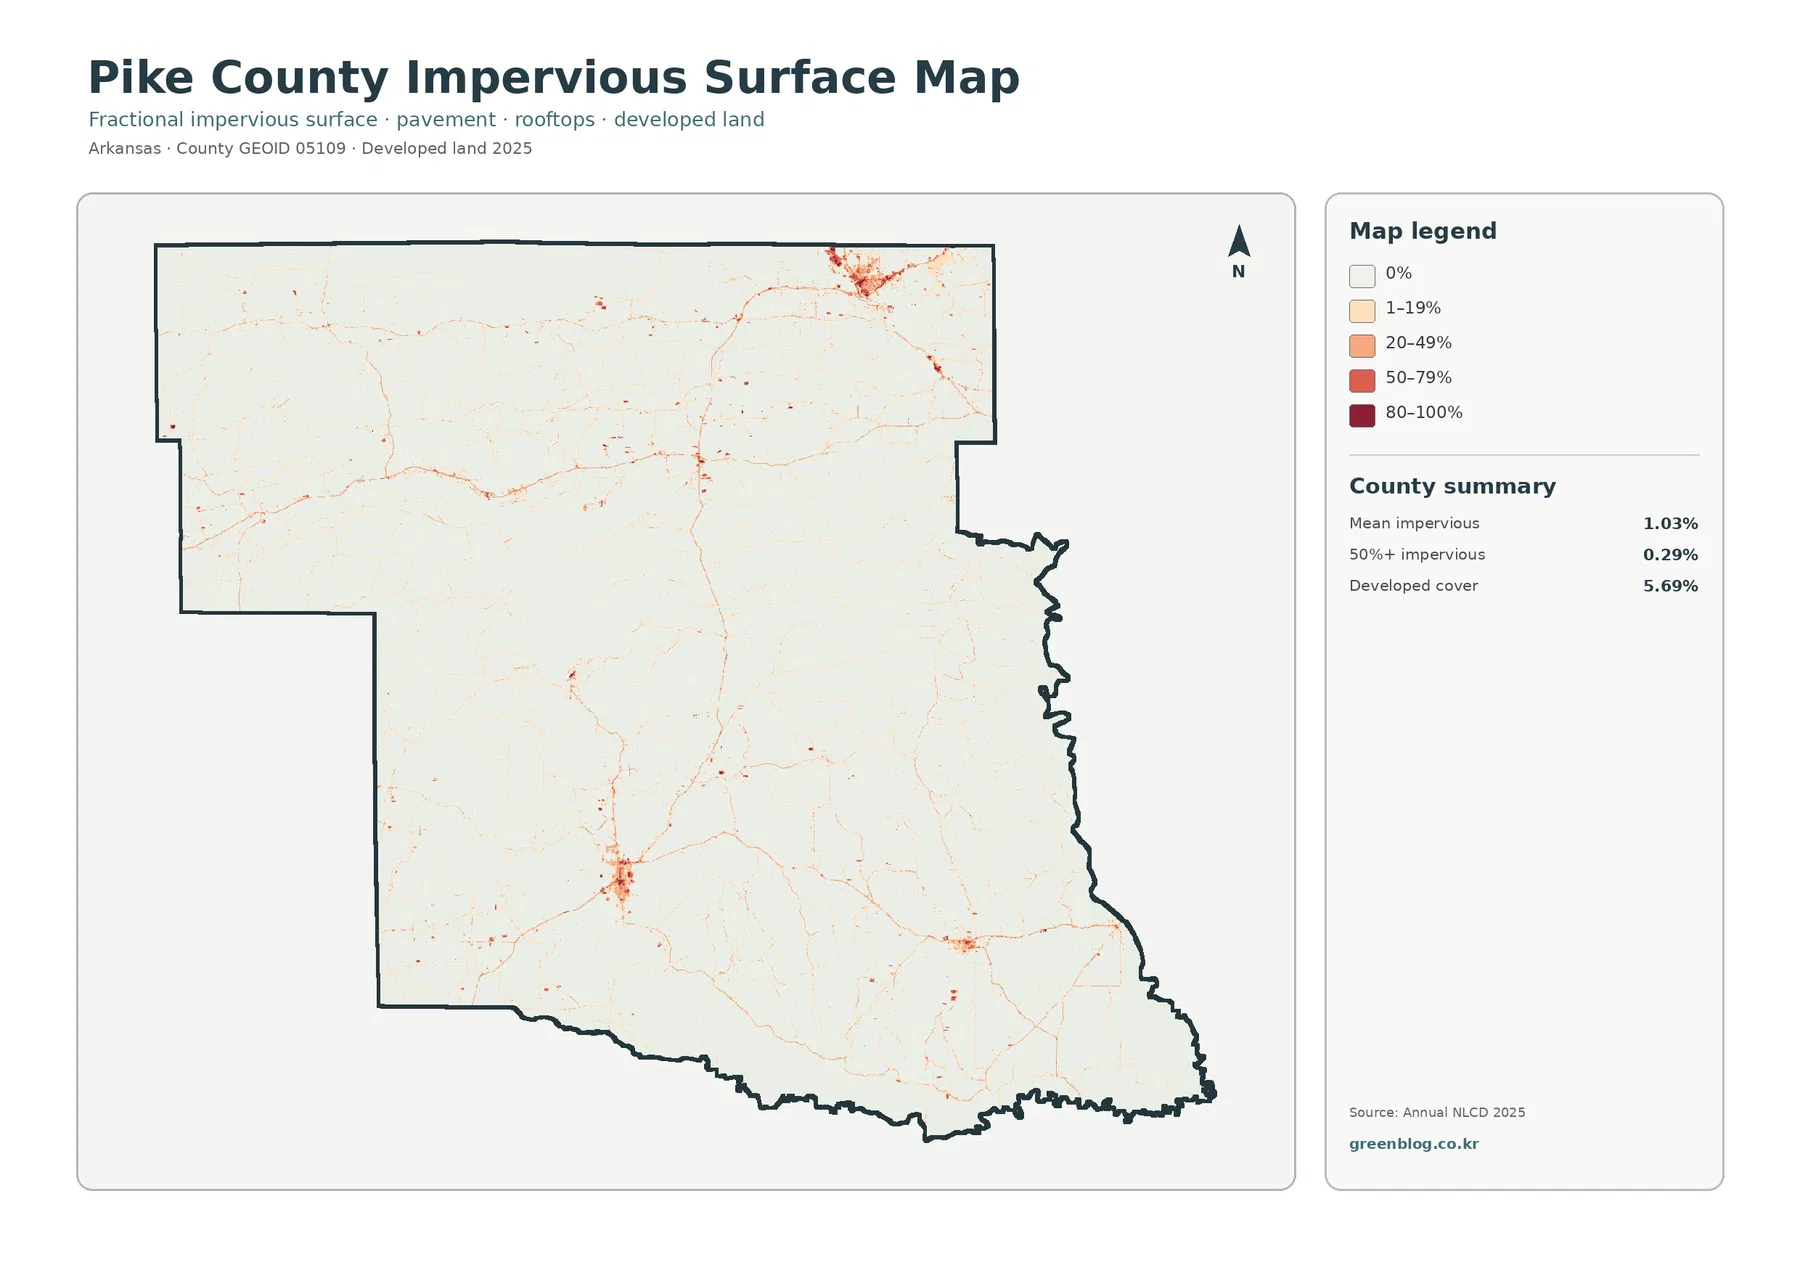
Impervious surface means pavement, rooftops, parking areas, and other hard surfaces that do not readily absorb rainfall. Pike County has a mean impervious value of 1.03% in the supplied 2025 summary. Only 0.29% of the county is summarized in cells with 50% or more impervious surface, even though the broader developed land-cover class reaches 5.69%. This difference is expected because developed land can include vegetation and other permeable surfaces around buildings and roads.
Once forest and farmland colors are removed, the transportation and settlement pattern becomes much easier to see. The strongest red concentrations occur as compact nodes rather than wide urban fields. A notable cluster appears near the northeastern edge, with additional nodes in the southern half and thin lines joining parts of the county. Visitors comparing this image with a place or road map can relate those hard-surface concentrations to communities such as Murfreesboro and other Pike County towns, while still recognizing that the raster map does not draw municipal boundaries.
The forest-and-farmland view separates open patches from the wooded majority
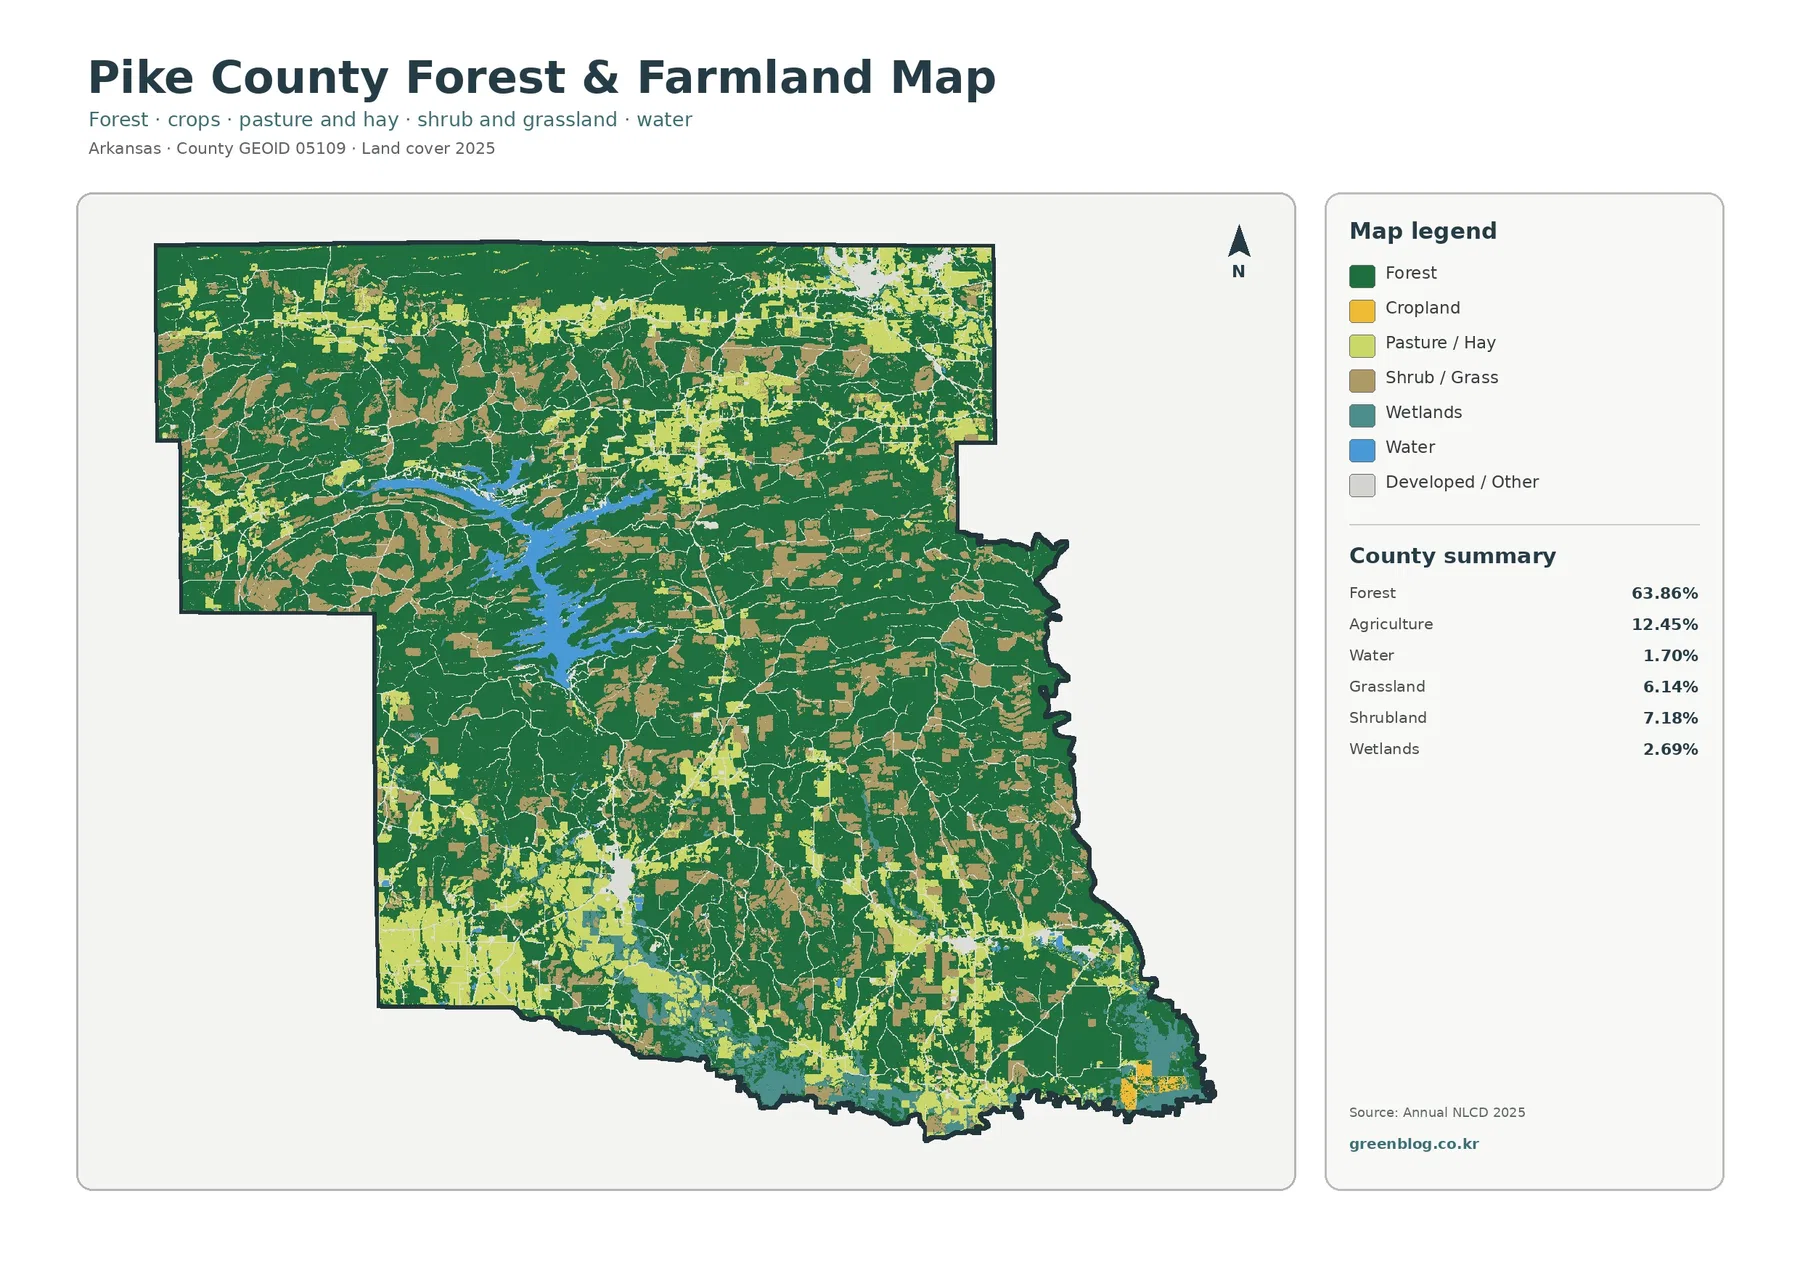
The simplified forest-and-farmland map is the better choice when the main question is not development but the relationship between wooded and open ground. Forest still dominates, but the lighter agricultural and grass colors stand out more clearly. Rather than forming one continuous belt, agricultural areas appear as separated patches, especially toward the north, southwest, and south. This is a very different pattern from counties where cropland fills nearly every space between towns and waterways.
Shrubland at 7.18% and grassland at 6.14% are important because they prevent an overly simple forest-versus-farm reading. Some open areas are neither cropped fields nor dense forest. In the map, these classes appear along edges and in patches among the larger forest blocks. For environmental education, that distinction helps explain why a landscape can look open in aerial imagery without necessarily being agricultural land.
The county’s public sources also provide local context for this mixture. Pike County describes commercial forestry and family farms as part of its economic base, while the University of Arkansas Cooperative Extension office in Murfreesboro supports local programs in agriculture and natural resources, including forestry and forage topics. These references do not replace the land-cover classification, but they help explain why both wooded land and working open land matter to the county.
The 1985–2025 comparison contains substantial class difference, not a simple development story
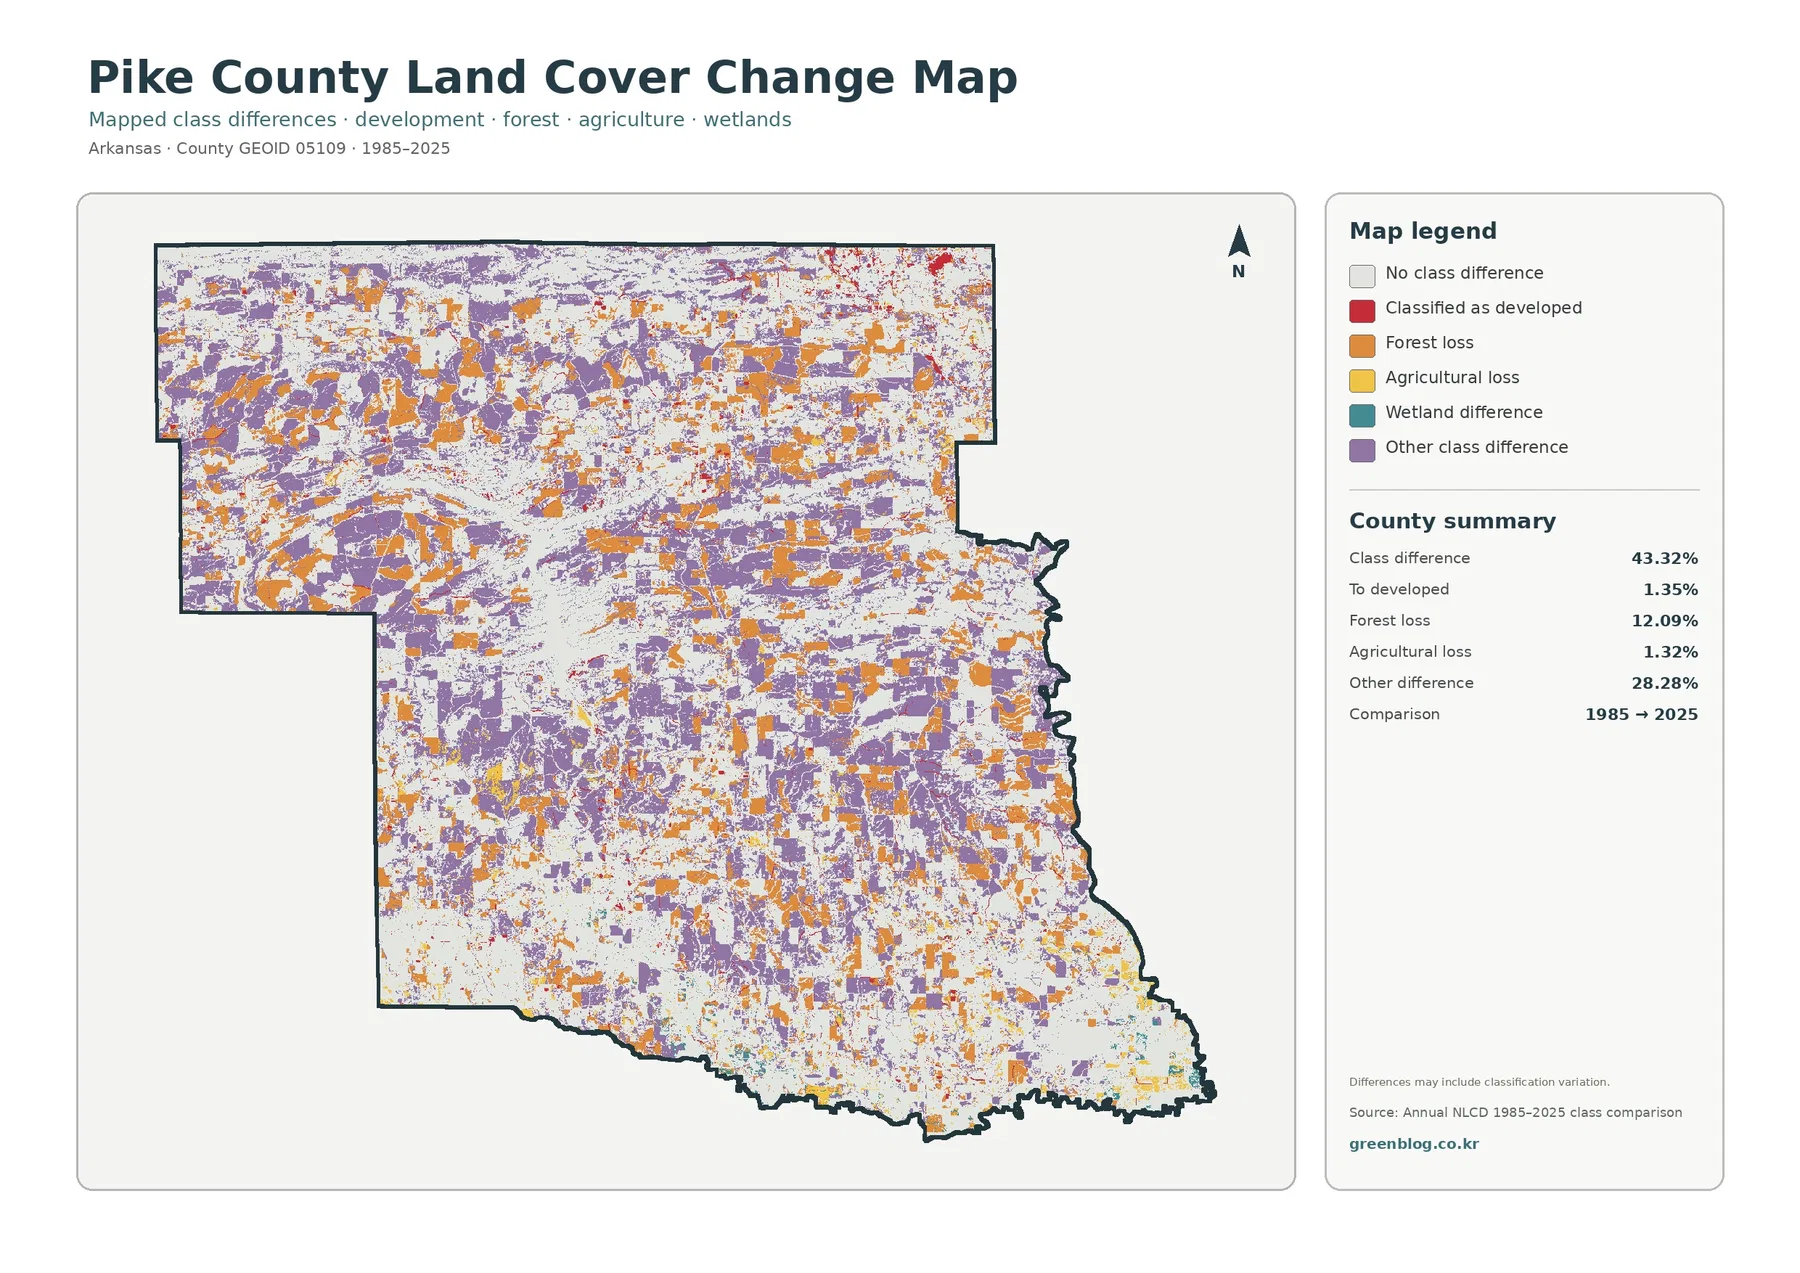
The change map needs more caution than the current-cover maps because its colors represent differences between two classifications. The supplied summary reports class difference across 43.32% of the county. Forest loss accounts for 12.09%, change to developed land 1.35%, agricultural loss 1.32%, and other class difference 28.28%. Wetland difference has a separate legend color, but the summary does not provide a standalone percentage for it, so no extra value should be calculated from the remaining total.
The large “other difference” category is an immediate warning against treating every colored cell as a known land-use conversion. Purple and orange patches are distributed across much of the county, including wooded areas and open-land zones. Some of those differences may represent real changes on the ground, but a two-date land-cover comparison can also reflect how mixed pixels and class boundaries were assigned in each year.
Which Pike County map should you use?
For printed reports, local-history displays, classroom lessons, or county comparisons, it can be useful to place two maps side by side rather than shrinking all four onto one page. A forest-and-farmland map beside the impervious map makes the contrast between open or wooded land and hard surfaces immediately visible. The original JPG files for all four views are bundled below so they can be used outside the web page without relying on the smaller previews.
Scale, date, and classification limits that matter for Pike County
Annual NLCD land-cover products are generalized raster data, commonly represented with 30-meter cells. That scale is appropriate for countywide patterns, but it is not a parcel survey. A narrow stream, field edge, road, or small building can share a cell with another surface type. The resulting mixed pixel may look more simplified than the real boundary visible in recent aerial photography.
Frequently Asked Questions
What is the dominant 2025 land cover in Pike County, Arkansas?
Forest is the dominant class at 63.86% of the supplied 2025 summary. Agriculture is 12.45%, shrubland 7.18%, grassland 6.14%, and developed cover 5.69%, while water and wetlands occupy smaller shares.
Which map is best for seeing Lake Greeson and the surrounding landscape?
Start with the general land-cover map because the reservoir appears as a large connected water feature inside extensive forest. The forest-and-farmland map is a useful second view when you want fewer classes and a clearer comparison between wooded and open land.
Does the 43.32% class difference from 1985 to 2025 mean that 43.32% of Pike County changed legal land use?
No. It means the mapped land-cover class differs between the two comparison years across 43.32% of the summarized area. Real landscape change may be included, but classification variation and mixed pixels can contribute, and the map does not show legal zoning or parcel use.
Sources and reference material
- MRLC Annual NLCD Data – official Annual NLCD data access and product information
- USGS Annual NLCD Land Cover Classification – official class definitions and interpretation guidance
- U.S. Census Bureau TIGER/Line Shapefiles – administrative boundary reference
- Pike County, Arkansas official website – county-seat, forestry, farming, river, and lake context
- U.S. Army Corps of Engineers – Lake Greeson – official information about Lake Greeson and the Little Missouri River
- University of Arkansas Cooperative Extension – Pike County – local agriculture, forestry, and natural-resources reference
Map File Information
The four original Pike County maps used on this page are packaged in one ZIP file. The JPG files are larger than the web previews and work well for printing, classroom reference, presentations, and county-to-county comparisons.
- Included Files: Use only the versions confirmed in the article and supplied images
- File Type: Use the confirmed download contents
- Intended Use: Printing, education, presentations, and map-based projects
Related Maps
- A Craighead County Arkansas Land Cover Map
- Arkansas County Arkansas Land Cover Map
- Ashley County Arkansas Land Cover Map
Green Map creates custom-edited map images using open geographic data sources such as geoBoundaries, Natural Earth, OpenStreetMap, and government open data.
These maps are edited visual materials, not raw data files, and are provided for education, documents, presentations, and graphic reference.