Phillips County sits in eastern Arkansas beside the Mississippi River, and its 2025 land-cover summary is unmistakably agricultural. Agriculture accounts for 70.54% of the mapped county, while wetlands cover 16.05%. Water, developed land, and forest make up much smaller shares, but their locations matter: wetlands and water follow the river edge and winding lowland channels, developed land clusters most strongly around Helena-West Helena, and the clearest forest concentration appears in the northeast.
Four map views are provided so those patterns can be separated instead of compressed into one image. The page includes a general land-cover map, a forest-and-farmland view, an impervious-surface map, and a 1985–2025 change map. The four original JPG files are available together in one download farther down the page, while the WebP images in the article are quick previews for reading on screen.
Table of Contents
A Mississippi Delta county where farm cover dominates the interior
The broad interior of Phillips County is covered by a nearly continuous agricultural pattern. On the general map, yellow agricultural cells extend across most of the northwestern, central, western, and southern parts of the county. Wetlands interrupt that pattern along drainage features and near the Mississippi side, so the county does not read as one uniform farm block. Instead, large cultivated areas are threaded by wet lowlands and water, especially toward the east and around the county’s curving river boundary.
That map pattern fits the county’s agricultural context without making the mistake of treating two different datasets as identical. The USDA 2022 Census of Agriculture reports 380,542 acres of land in farms in Phillips County, including 370,463 acres listed as cropland. Those farm statistics use agricultural reporting definitions, while Annual NLCD classifies what covers the ground in raster cells. They should not be substituted for one another, but together they explain why cultivated land is such a strong visual feature here.
Helena-West Helena marks the county’s strongest built-surface concentration
Arkansas tourism information describes Helena-West Helena as the place where Crowley’s Ridge meets the Mississippi River. That setting helps frame a striking map contrast. The county’s broad agricultural interior is lightly developed, while the northeastern side contains the most obvious cluster of red developed cells. A forested patch also stands out nearby, creating a sharp transition between cropland, wooded land, the city, and the river corridor.
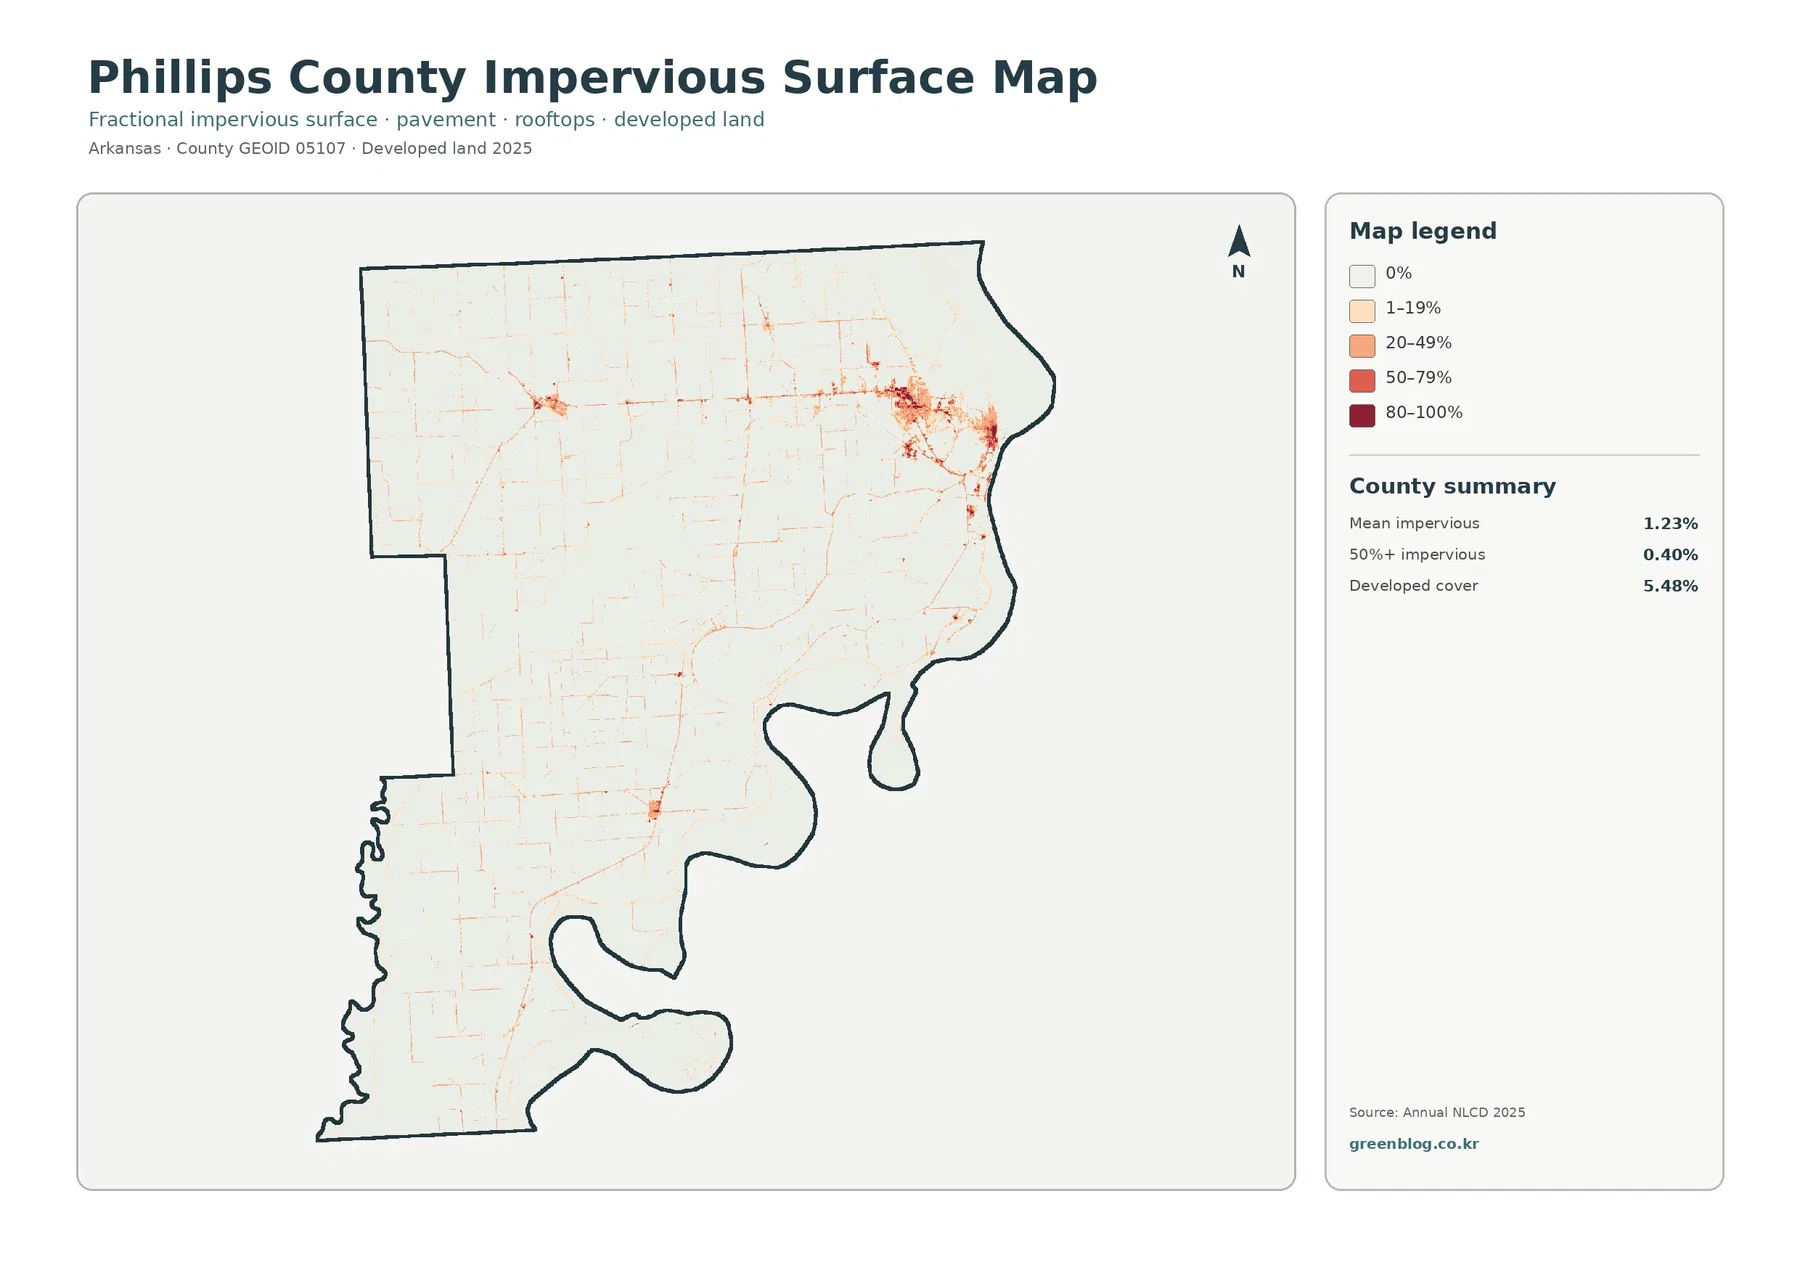
The impervious-surface map makes the urban concentration easier to see because farm and wetland classes are removed from the display. Impervious surface means hard cover such as pavement and rooftops where water does not readily soak into the ground. The county summary gives a mean impervious value of 1.23%, and only 0.40% of the mapped area is in cells with at least 50% impervious cover. Developed land as a land-cover class is higher, at 5.48%, because “developed” can include areas with vegetation as well as hard surfaces.
The general 2025 map shows farms, wetlands, water, forest, and development together
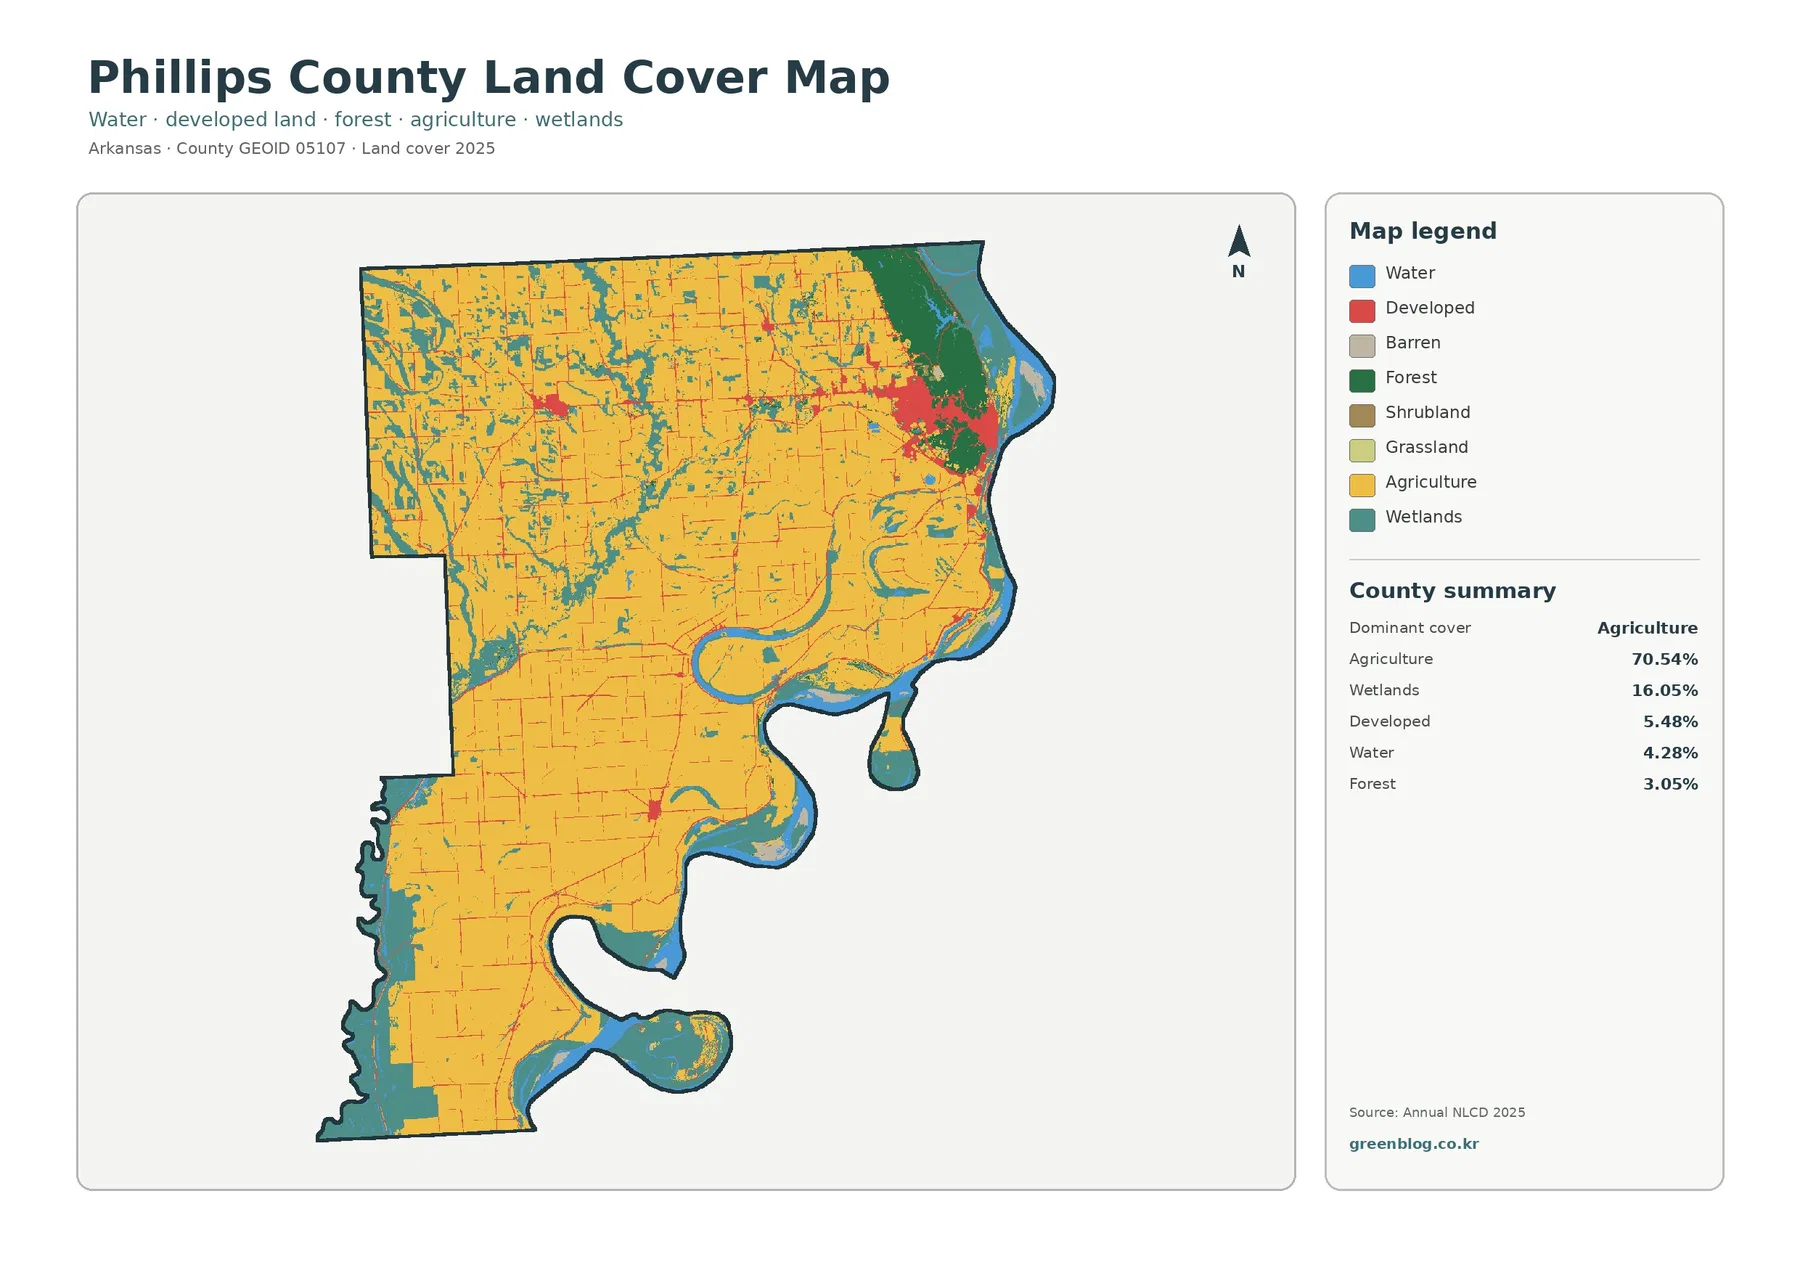
The general map is the best starting point when you want the entire county in one view. Its summary lists agriculture at 70.54%, wetlands at 16.05%, developed land at 5.48%, water at 4.28%, and forest at 3.05%. Agriculture supplies the dominant background, but the smaller classes are not randomly scattered. Water and wetlands are particularly visible along the Mississippi side and in sinuous features that cut through or border the agricultural plain.
A simplified forest-and-farmland view makes the farm–wetland contrast easier to read
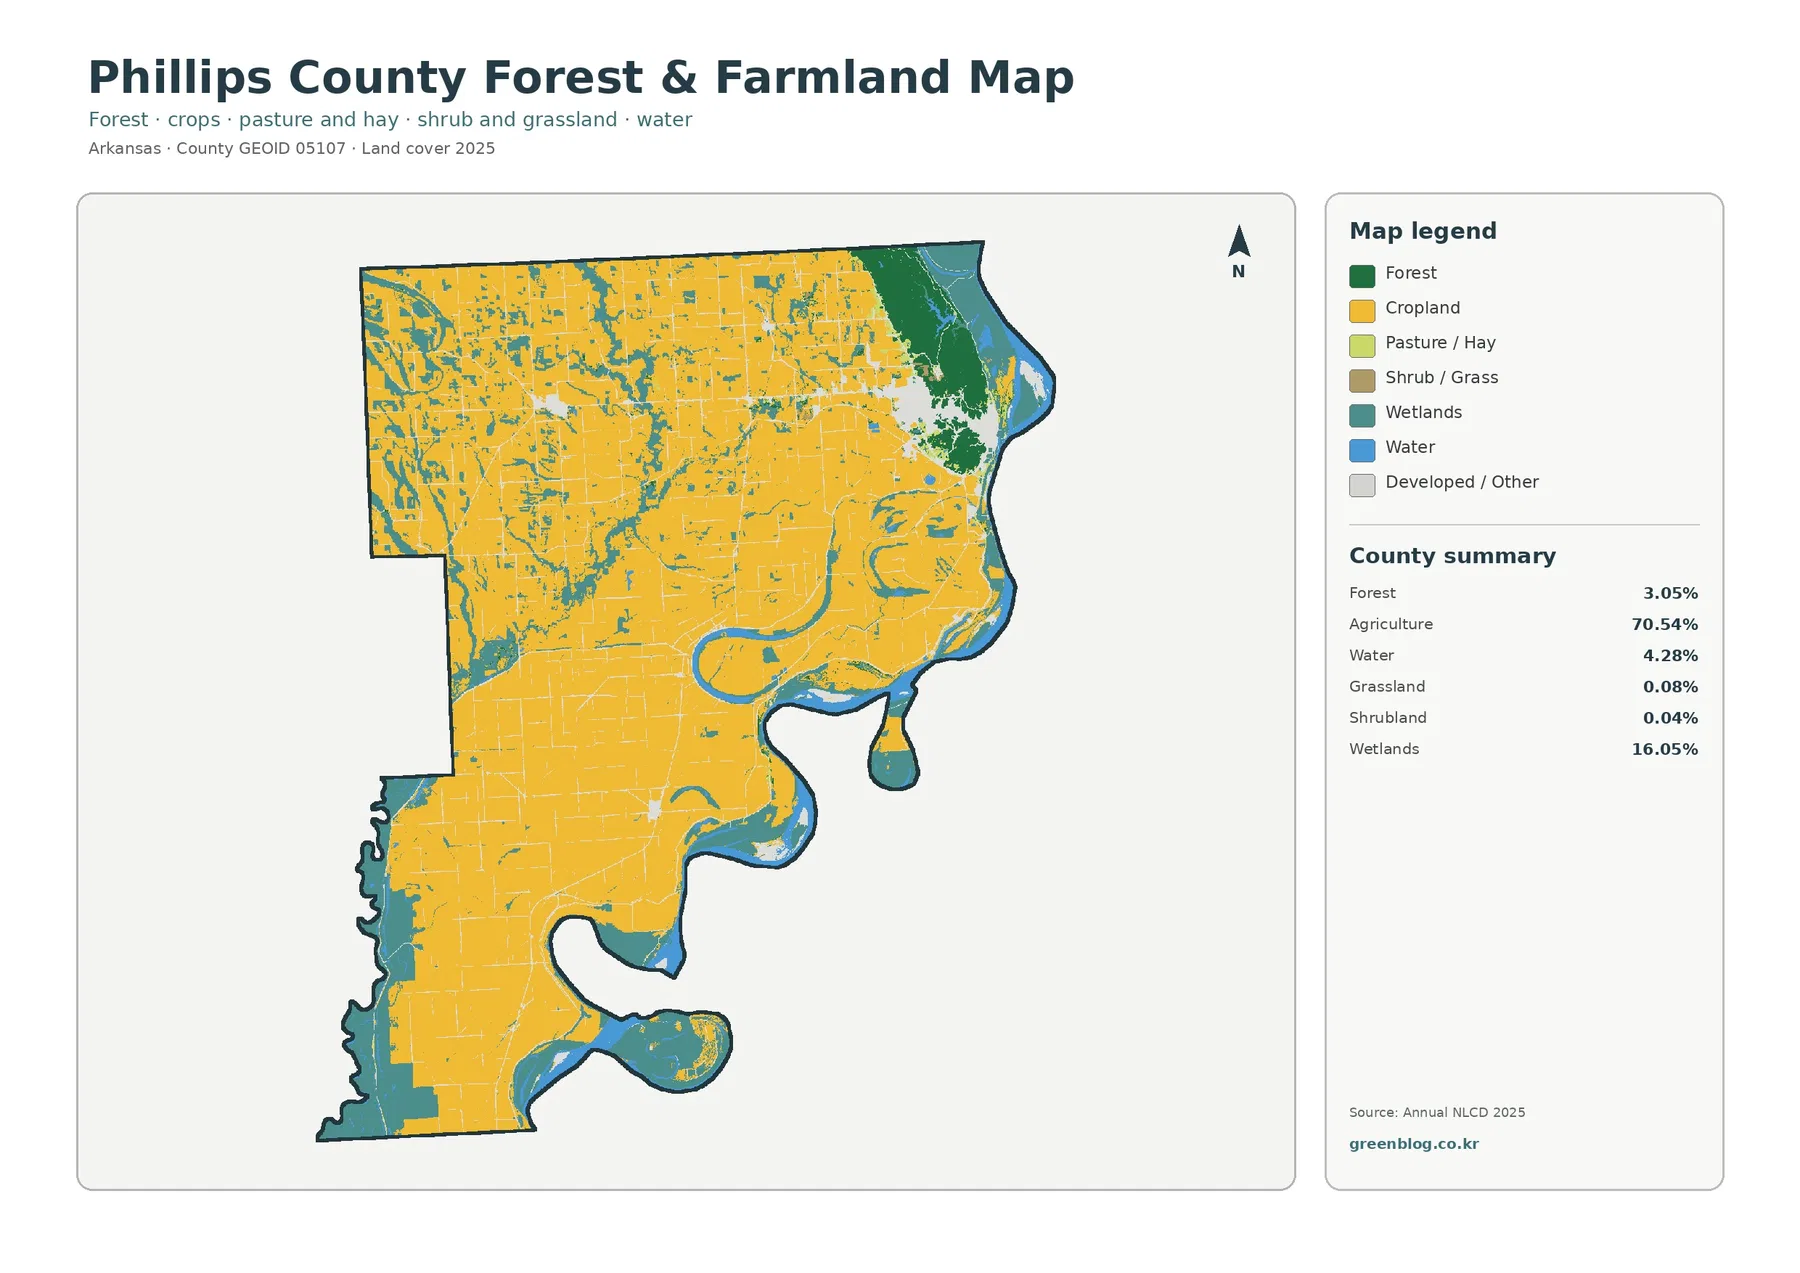
The forest-and-farmland map removes much of the visual competition from developed classes and focuses attention on cropland, forest, pasture or hay, shrub and grass cover, wetlands, and water. Cropland remains the dominant class by a wide margin. Grassland is only 0.08% and shrubland 0.04% in the supplied summary, so neither is a defining countywide feature. The important contrast is between extensive cropland, wet areas, and the smaller but concentrated northeastern forest.
This view is especially useful when comparing the county’s agricultural core with its wetter margins. Wetland cells appear along the eastern river corridor and as branching or elongated features across the interior. Water follows some of the same lowland shapes but is mapped separately. When the two classes are read together, they break up the apparent uniformity of the Delta farm landscape and show how much hydrologic structure remains visible inside an overwhelmingly agricultural county.
What changed between 1985 and 2025—and what the change map cannot prove
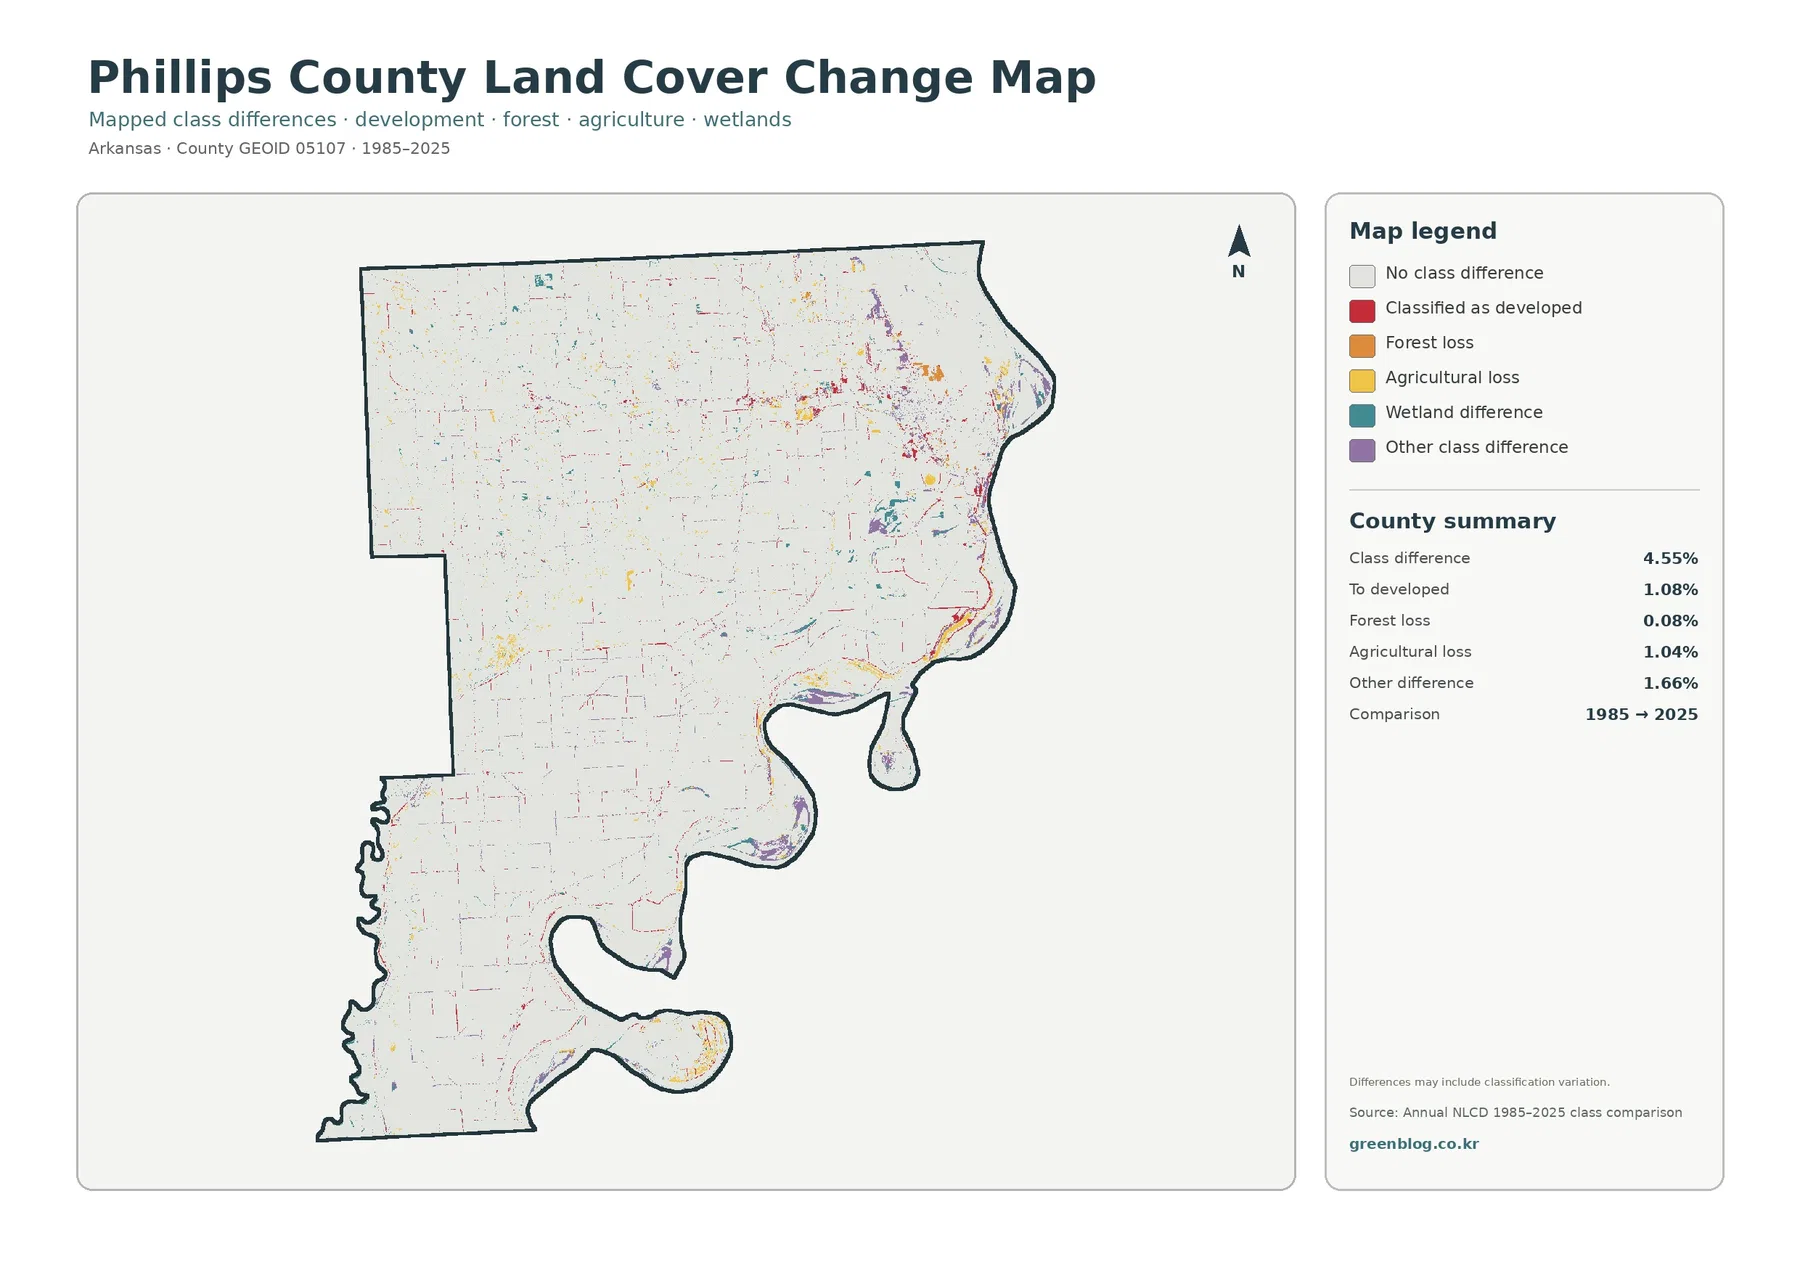
The long-term comparison is visually quieter than the current land-cover map. Most of Phillips County is mapped as “No class difference,” while the supplied summary reports a class difference on 4.55% of the area. Within that total, 1.08% is classified as a change to developed land, 1.04% as agricultural loss, 0.08% as forest loss, and 1.66% as other class difference. Wetland difference has its own legend category, but the map summary does not provide a separate percentage for it, so no additional number should be inferred.
The map itself warns that the comparison can include classification variation. Annual NLCD is raster data, meaning the landscape is divided into grid cells and each cell receives a class based on the data and method used. A narrow road, field edge, wet ditch, or small pond can share a cell with another cover type. Those mixed pixels can produce small differences between years even when the real-world boundary is more complicated than the map suggests.
Choosing the right Phillips County map for a specific question
Start with the general map when you need one image that explains the county’s dominant agricultural cover and its wetland, water, forest, and developed contrasts. Switch to the forest-and-farmland map when the main question is how cropland relates to natural cover. Use the impervious map for Helena-West Helena, road corridors, rooftops, and other hard surfaces. Open the change map only after understanding the current pattern, because it answers a different question: where the 1985 and 2025 classifications differ.
Scale, date, and classification limits to keep in mind
Annual NLCD products are generalized raster maps, commonly based on 30-meter cells. That scale is appropriate for regional and county patterns but not for parcel decisions. When a question depends on an exact county line, combine the land-cover image with an administrative boundary source such as Census TIGER/Line data. When a question depends on a parcel, use parcel and local planning records instead of trying to extract legal boundaries from the colored land-cover cells.
Frequently Asked Questions
What is the dominant land cover in Phillips County, Arkansas?
Agriculture is the dominant 2025 class at 70.54% of the supplied county summary. Wetlands are second at 16.05%, followed by developed land at 5.48%, water at 4.28%, and forest at 3.05%.
Which map best shows development around Helena-West Helena?
The impervious-surface map is the clearest choice because it isolates pavement, rooftops, and other hard surfaces. The strongest impervious concentration appears in the northeastern Helena-West Helena area, while most of the agricultural interior remains lightly impervious.
Does the 1985–2025 change map prove that every colored cell represents a real land-use conversion?
No. It shows where the mapped land-cover class differs between the two comparison years. Real landscape change may be involved, but mixed pixels and classification variation can also contribute, so parcel-level conclusions require other records and field evidence.
Sources and reference material
- MRLC Annual NLCD Data – Annual NLCD data access and product information
- USGS Annual NLCD Land Cover Classification – class definitions and interpretation guidance
- USDA NASS 2022 Census of Agriculture: Phillips County – county farming and cropland context
- University of Arkansas Cooperative Extension Service – Phillips County – local agriculture and natural-resources information
- U.S. Census Bureau TIGER/Line Shapefiles – administrative boundary reference
- Arkansas.com: Helena-West Helena – geographic context for Crowley’s Ridge and the Mississippi River
Map File Information
The four original maps on this page are packaged in one ZIP file. The JPG files are larger than the in-page previews and are convenient for printing, classroom reference, presentations, and side-by-side county comparisons.
- Included Files: Use only the versions confirmed in the article and supplied images
- File Type: Use the confirmed download contents
- Intended Use: Printing, education, presentations, and map-based projects
Related Maps
- A Craighead County Arkansas Land Cover Map
- Arkansas County Arkansas Land Cover Map
- Ashley County Arkansas Land Cover Map
Green Map creates custom-edited map images using open geographic data sources such as geoBoundaries, Natural Earth, OpenStreetMap, and government open data.
These maps are edited visual materials, not raw data files, and are provided for education, documents, presentations, and graphic reference.