Perry County sits in central Arkansas where wooded Ouachita terrain, the Fourche La Fave River corridor, small communities, and scattered open land meet. The 2025 land-cover maps make that contrast easy to see: forest is the dominant class at 65.41%, while agriculture accounts for 15.67% and developed land only 5.01%. The county therefore reads first as a forested landscape rather than a built or farm-dominated one.
Four different views are provided here: a full land-cover map, a simplified forest-and-farmland map, an impervious-surface map, and a 1985-to-2025 class-comparison map. The four original JPG files are available together in one ZIP from the download section below. Use the on-page WebP images for quick comparison and the JPG set when you need the full map files for printing, presentations, or closer inspection.
Table of Contents
Forest and open land form the clearest contrast
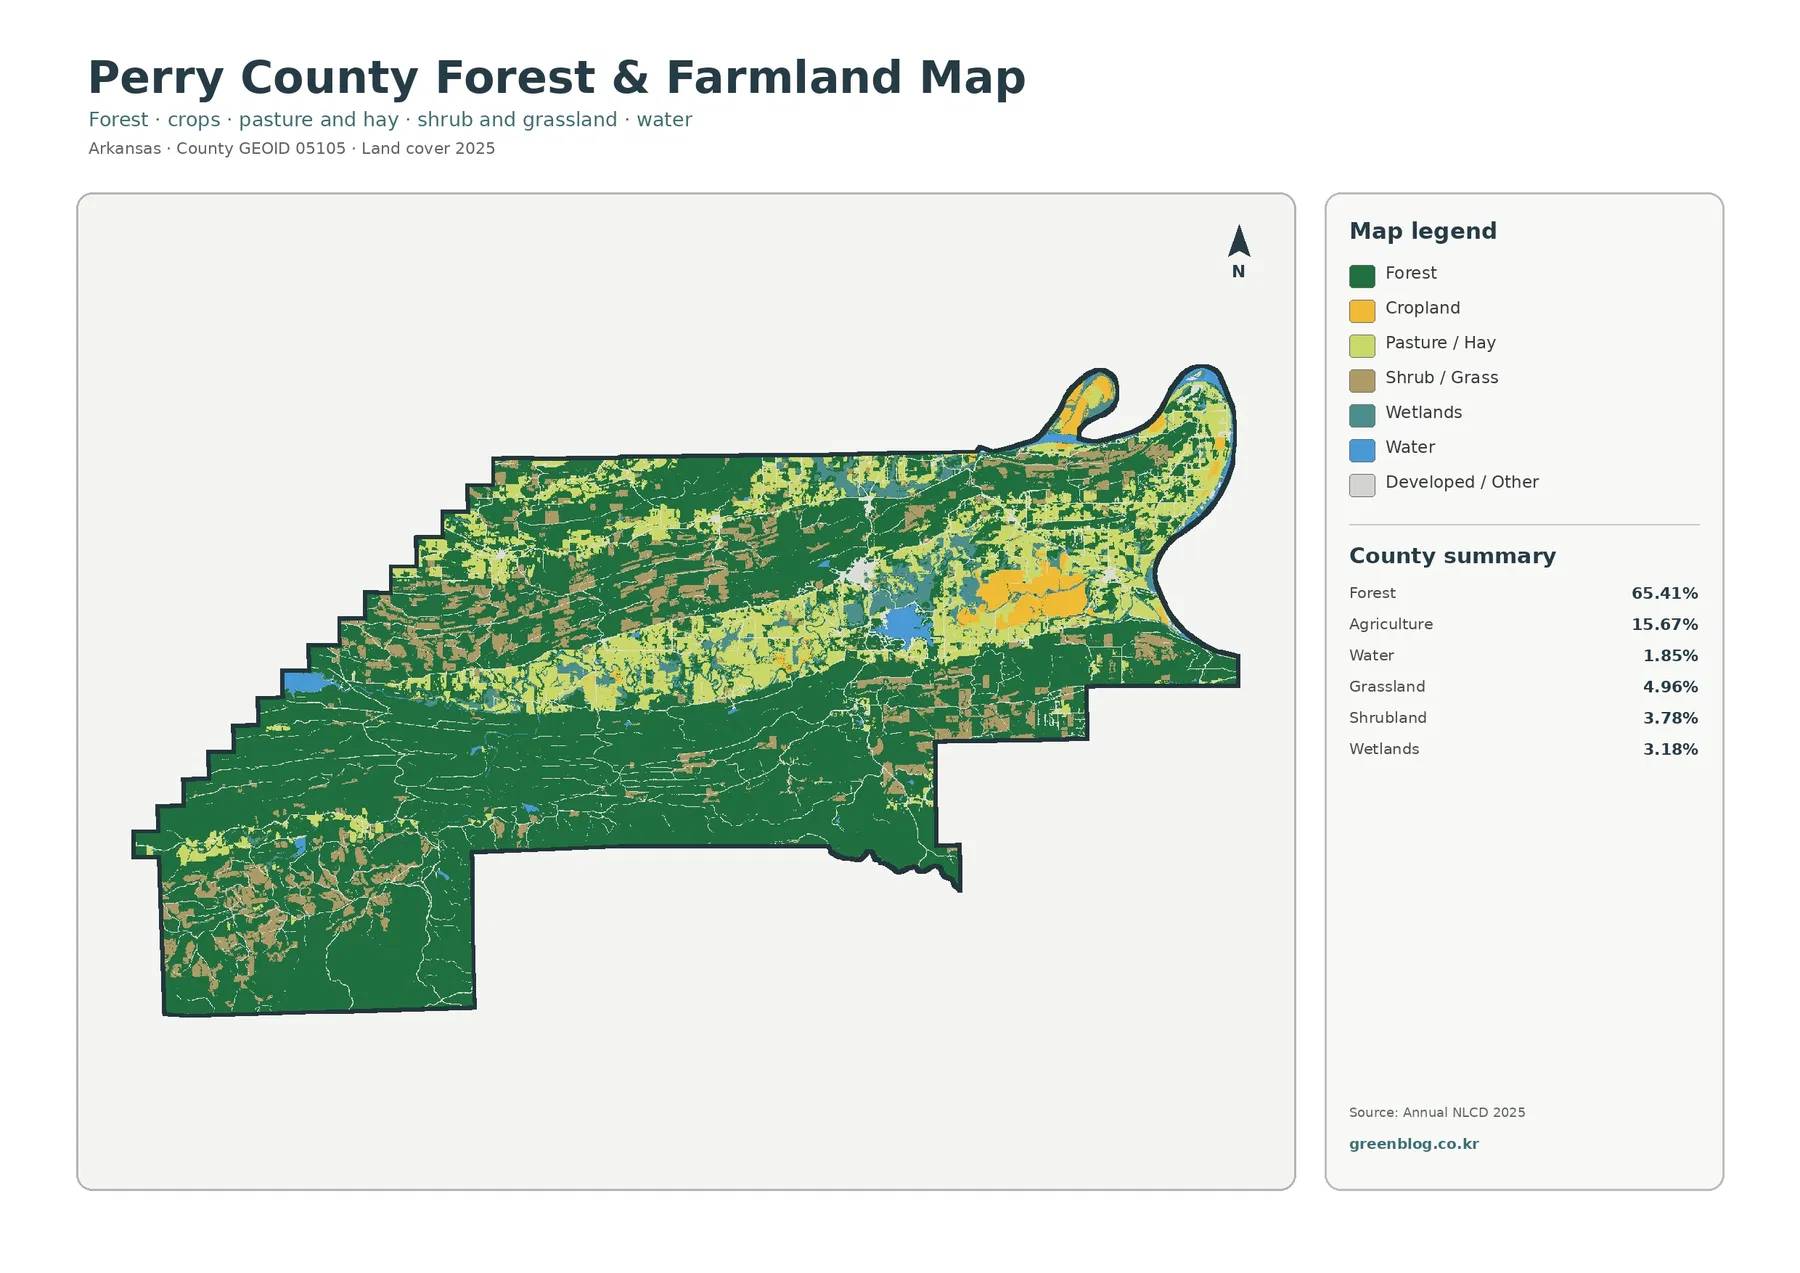
The forest-and-farmland view gives the quickest picture of Perry County because it reduces the legend to the classes that matter most across this landscape. Dark green forest covers broad connected areas through much of the county, especially across the southern and central portions. Cropland, pasture or hay, grass, and shrub cover appear more often in the north and northeast, with smaller openings scattered elsewhere rather than one continuous agricultural belt.
The summary on this map lists forest at 65.41% and agriculture at 15.67%. Grassland adds 4.96% and shrubland 3.78%, so the county contains a meaningful amount of open cover even though forest remains dominant. Water is 1.85% and wetlands are 3.18%. Those last two classes occupy much less total area, but they stand out locally where they follow river corridors or collect around larger water bodies.
This pattern fits Perry County’s broader physical setting. The county lies in the Ouachita Mountains, and the Fourche La Fave River crosses it from west to east. Perryville occupies the river valley at the base of the Ouachita National Forest. That context helps explain why the map is better read as a mix of wooded uplands and more open valley or lowland patches, rather than as evenly distributed land-cover classes.
Nimrod Lake is another useful geographic reference for understanding the county. The U.S. Army Corps of Engineers describes the lake as lying between the Ouachita and Ozark Mountains and identifies it as Arkansas’s oldest Corps lake. On a land-cover map, water and wetland classes should be read together with the adjacent forest and open land, because the shoreline and river environments often create narrow transitions that are easy to miss when looking only at countywide percentages.
The full 2025 map puts every major class back together
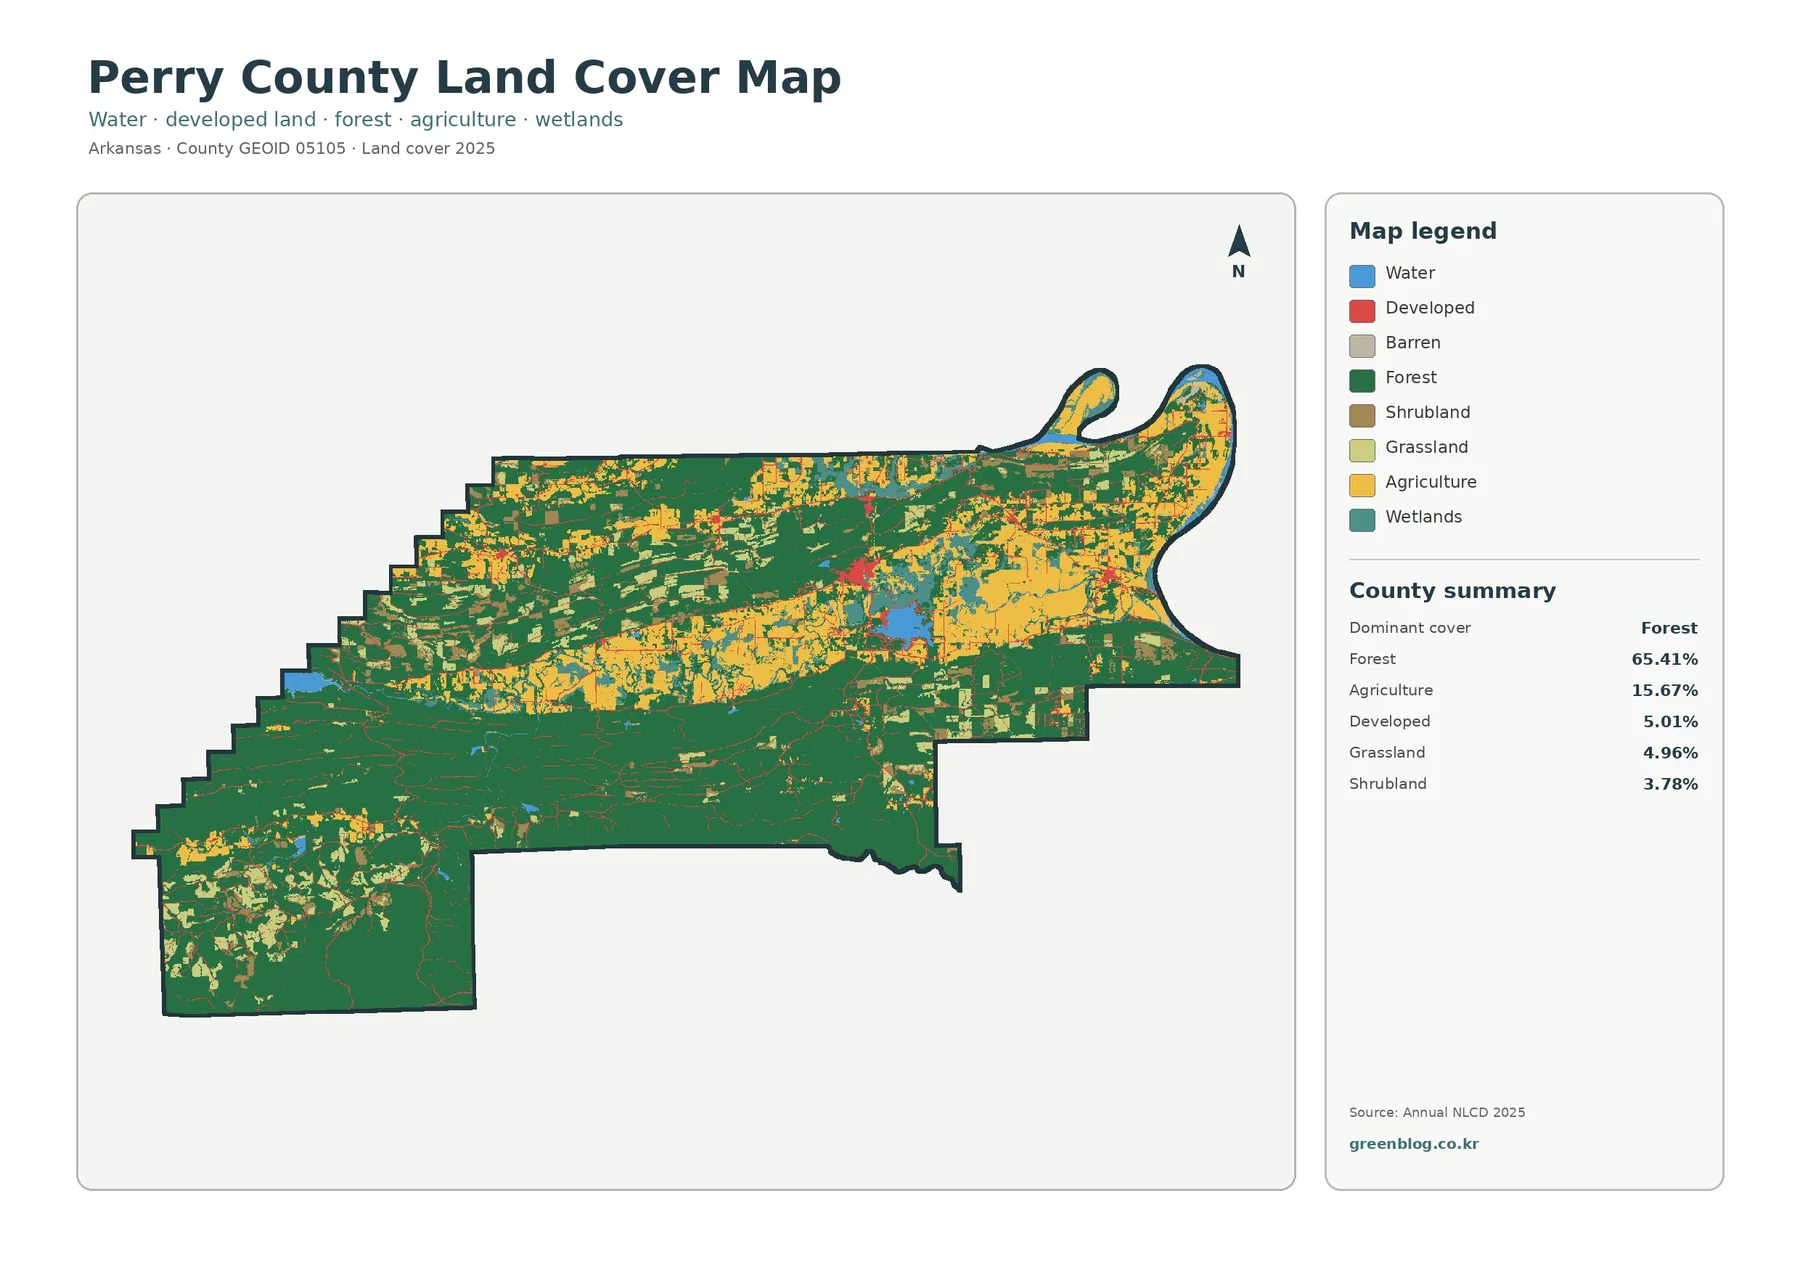
The general land-cover map restores developed, barren, forest, shrubland, grassland, agriculture, wetland, and water classes in one view. Forest remains the visual foundation, but the additional colors reveal how fragmented the northern half becomes compared with the more continuously wooded interior and south. Agricultural cover is especially noticeable in the north and northeast, while smaller open patches break up the forest in several western and interior locations.
Built surfaces are concentrated rather than widespread
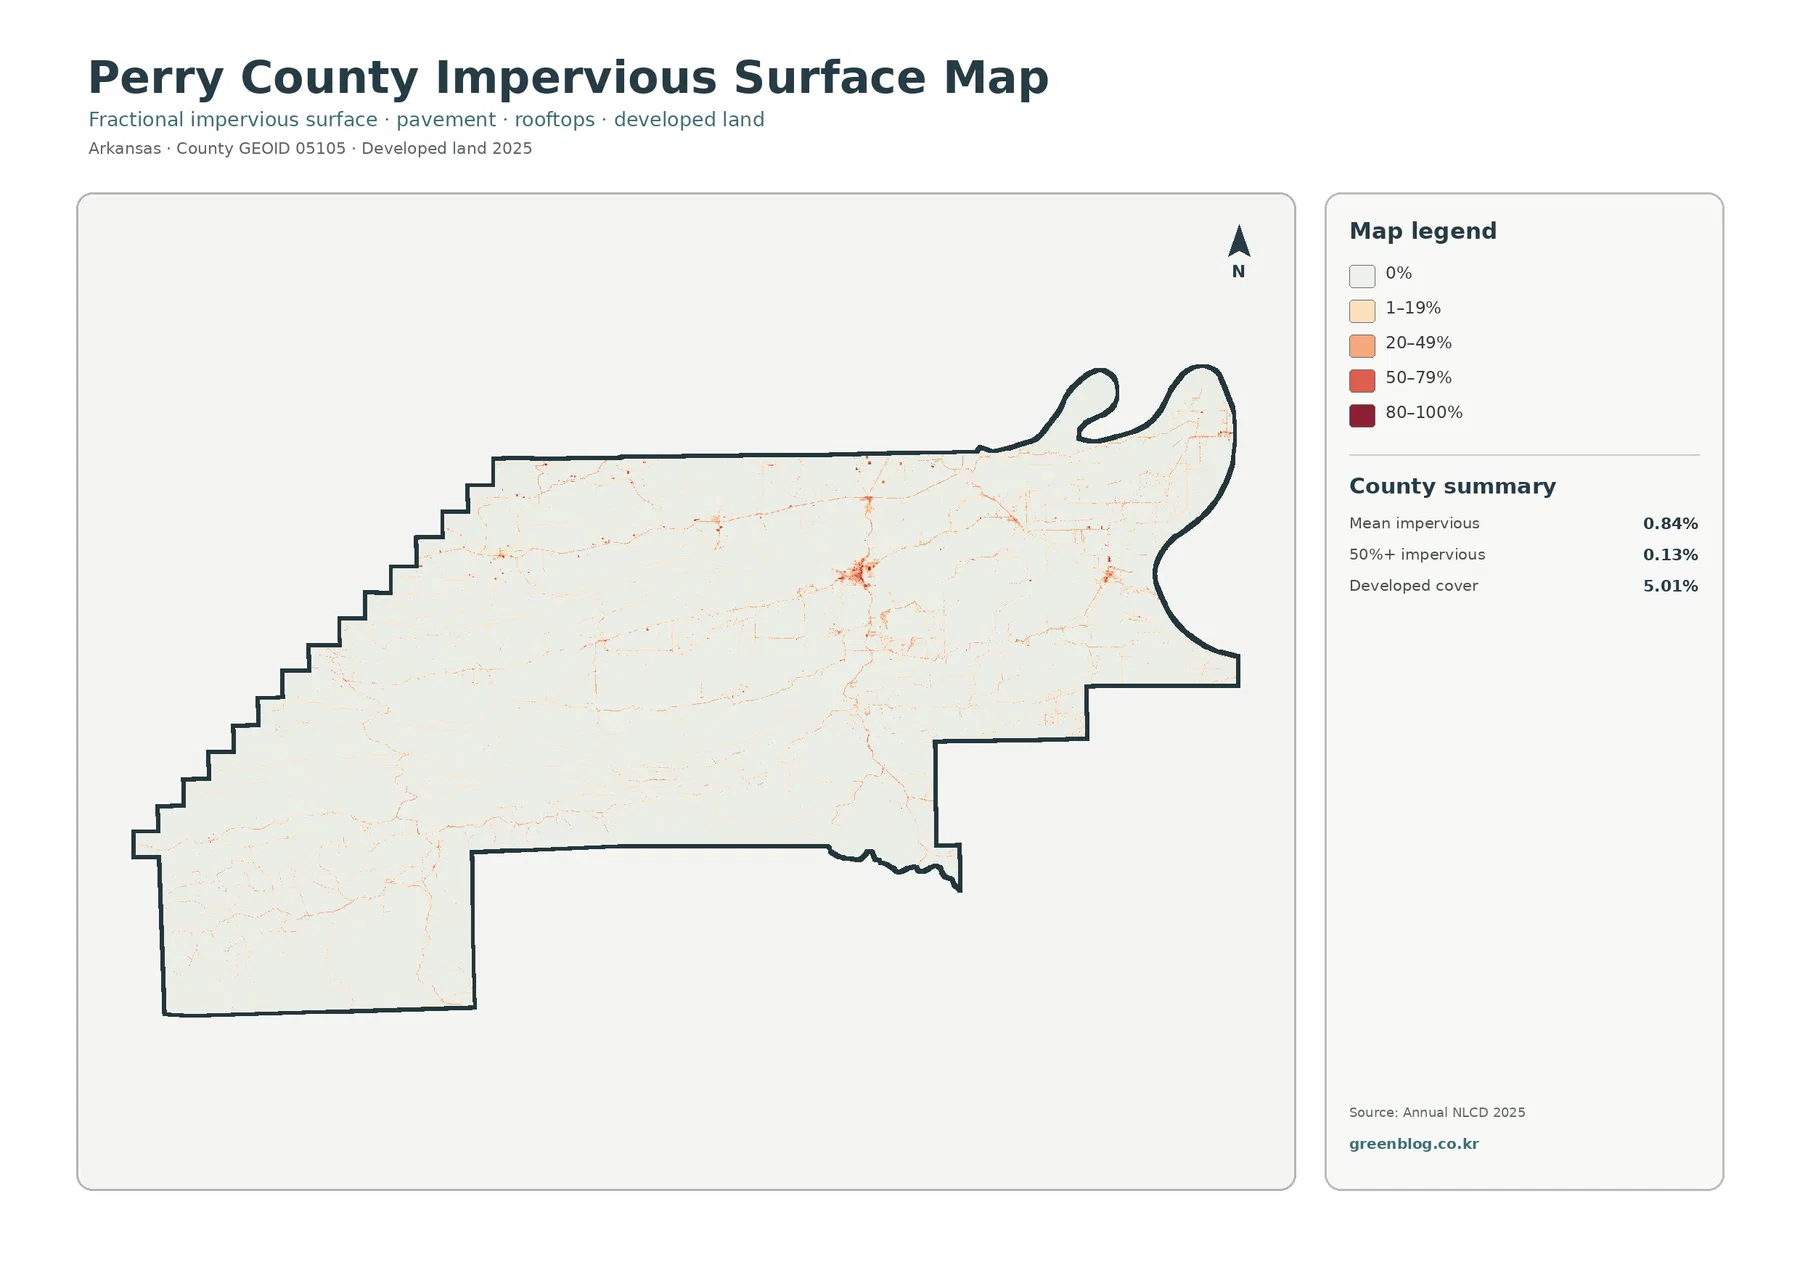
The impervious-surface map removes most land-cover colors and focuses on surfaces that do not readily absorb water, such as pavement and rooftops. Almost the entire county is shown in the lowest range, while stronger orange and red values appear only in small clusters and thin linear features. The clearest concentration corresponds to the Perryville area, with lighter traces extending along transportation and settlement corridors.
The statistics explain why the county looks so pale on this view. Mean imperviousness is only 0.84%, and areas with at least 50% impervious cover account for 0.13% of the county. Developed land on the general land-cover map is 5.01%. Taken together, those numbers show that Perry County contains developed places, but highly paved or roofed surfaces occupy only a very small fraction of the county as a whole.
The 1985–2025 comparison needs a cautious reading
The change map compares the class assigned to each mapped cell in 1985 with its class in 2025. Its summary reports a class difference of 24.85%. It also lists 1.10% as change to developed, 7.48% as forest loss, 0.98% as agricultural loss, and 14.96% as other class differences. These categories are useful for screening, but they should not be treated as a complete history of what physically happened on every cell.
The note on the map is important: differences may include classification variation. A cell can receive a different class because the land actually changed, but differences in imagery, processing, class definitions, seasonal conditions, or mixed-pixel decisions can also move a boundary. The 24.85% figure therefore means that the two classifications differ across that share of the mapped county, not that one-quarter of Perry County was necessarily cleared, built, or converted.
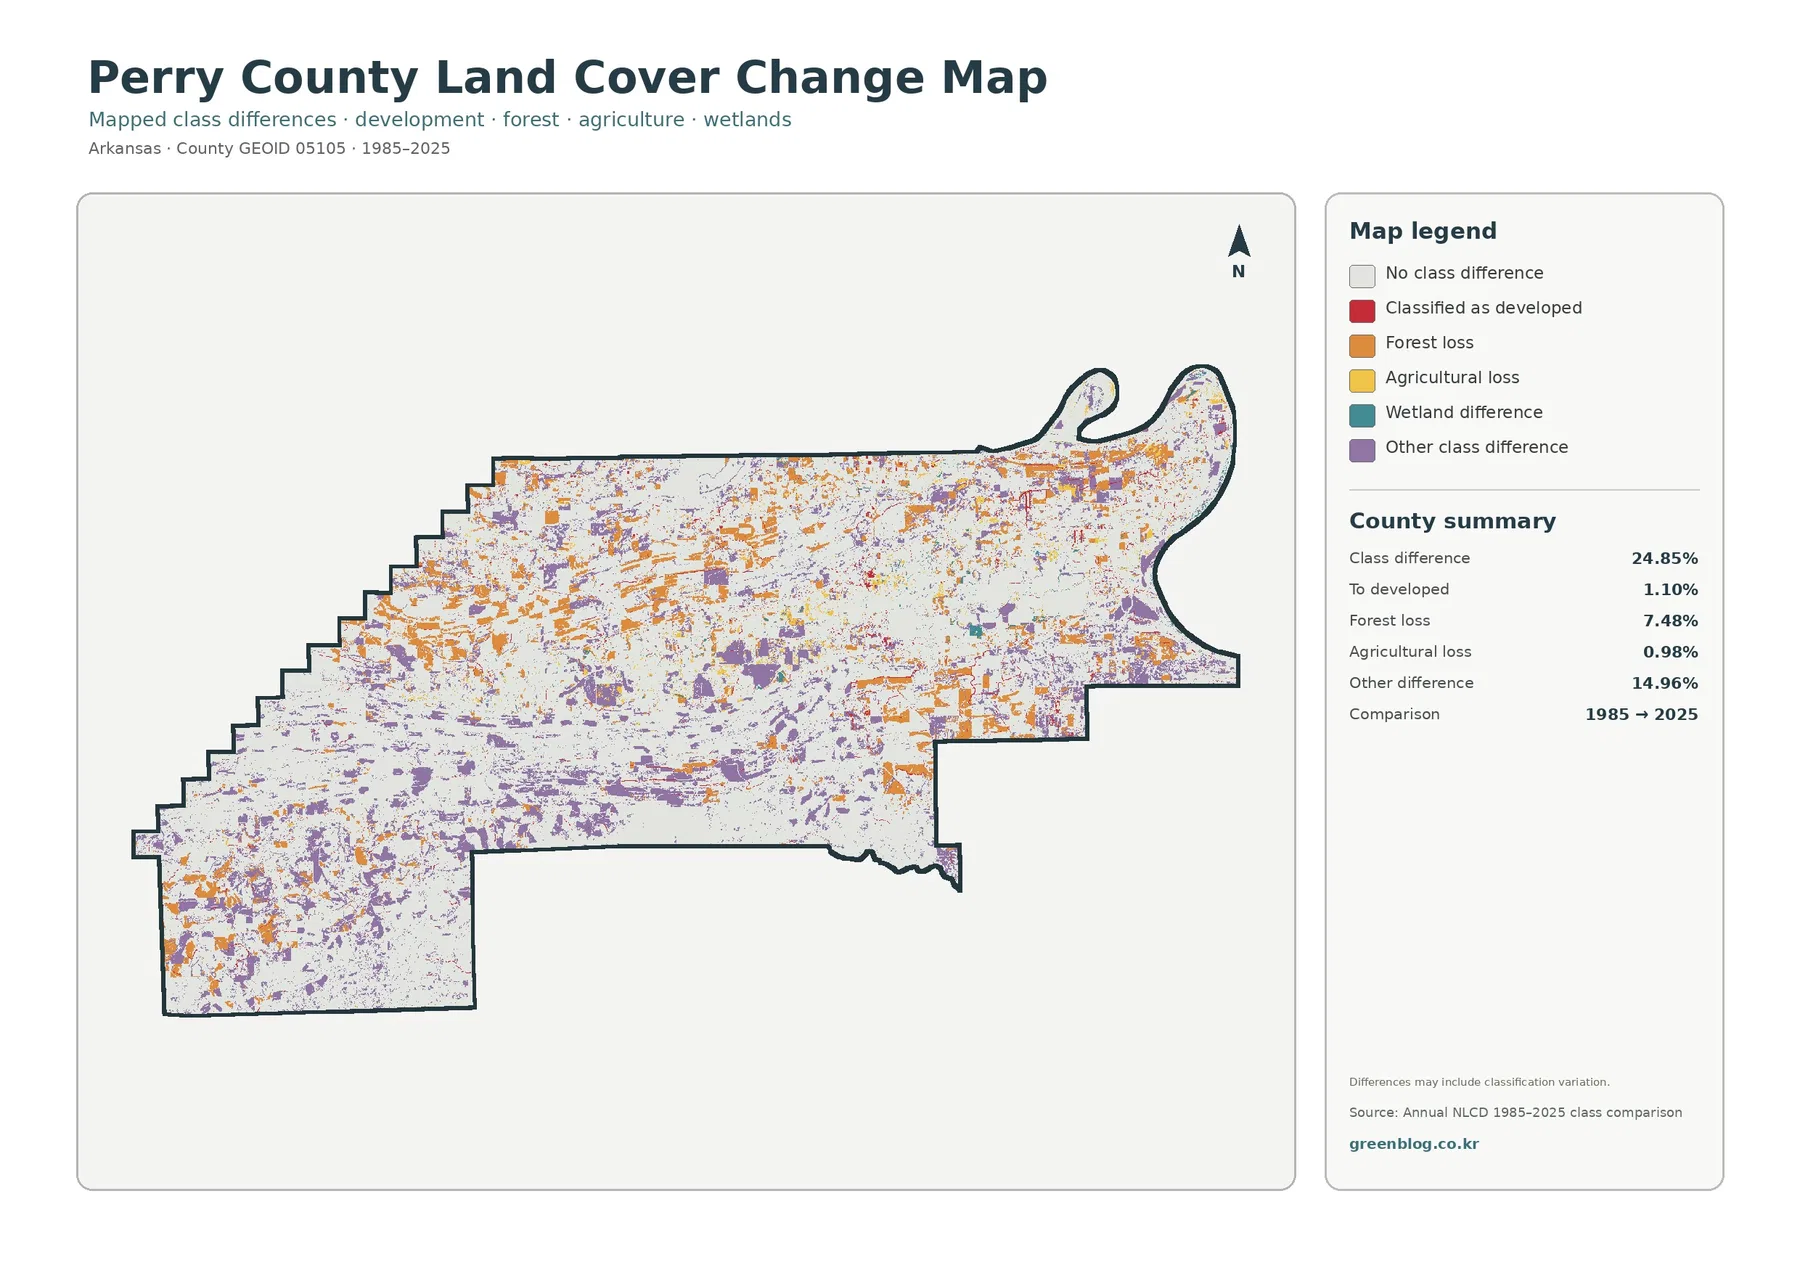
The change colors are distributed as many small patches rather than one dominant block. They are common where the present-day map already contains a finer mosaic of forest, agriculture, grass, and settlement cover, and they also occur along forest edges. That makes this map useful for locating candidate areas for follow-up. It is less suitable for making a definitive claim about a specific site without checking dated aerial photography or another source.
How to choose the right Perry County map
Use the forest-and-farmland map when you want a clean comparison between the county’s dominant wooded cover and its more open areas. It is also the easiest of the four for locating water and wetlands without a crowded legend. Use the full land-cover map when you need the broader mix of forest, agriculture, grass, shrub, developed land, wetlands, and water in one figure.
The impervious map answers a different question: where are the most intensively built surfaces? Its low countywide values make compact settlement clusters and road-related traces easy to identify. The change map is best reserved for a time-based question—where did the classification differ between 1985 and 2025? Because these maps measure different things, their colors should not be compared as though the legends were interchangeable.
Map File Information
The original Perry County land-cover set is provided as four JPG maps in one ZIP. Use the download when you need the map files rather than the smaller on-page previews.
- Area: Perry County, Arkansas
- Included maps: general land cover, forest and farmland, impervious surface and developed land, and 1985–2025 land-cover change
- Format: ZIP containing four JPG files
Scale and classification limits matter
The 2025 maps are based on Annual NLCD-style raster classification. Raster means the landscape is divided into grid cells rather than mapped as exact property polygons. At roughly 30-meter resolution, a cell can include more than one real-world surface, and the classification assigns the most appropriate category or fractional value. Narrow streams, small clearings, forest edges, and scattered buildings can therefore look simplified.
Date is another essential part of interpretation. The general, forest-and-farmland, and impervious maps represent the 2025 classification shown in the supplied figures. The change map compares 1985 and 2025. A new road, timber harvest, regrowth, construction project, farm change, or water-level condition after the observation period may not appear. For current site decisions, compare the map with recent aerial imagery and local information.
Frequently Asked Questions
What is the largest land-cover class in Perry County?
Forest is the largest 2025 class at 65.41%. Agriculture follows at 15.67%, while developed land accounts for 5.01%. The forest dominance is visible across broad central and southern parts of the county.
Which map is best for seeing Nimrod Lake, river corridors, and wetlands?
The forest-and-farmland map is the simplest choice because water and wetlands are separated from forest, agriculture, grass, and shrub cover. The full land-cover map is useful when you also want to compare nearby developed and other classes.
Does the 24.85% class difference mean 24.85% of the county physically changed?
No. It means the 1985 and 2025 classifications differ across 24.85% of the mapped cells. Real land change can contribute, but classification methods, imagery, mixed pixels, and boundary decisions can also create differences.
What is included in the download ZIP?
The ZIP contains four original JPG maps: the general land-cover map, forest-and-farmland map, impervious-surface and developed-land map, and the 1985–2025 land-cover change map.
Map File Information
Download the map files associated with this page for reference, printing, and compatible visual projects.
- Included Files: Use only the versions confirmed in the article and supplied images
- File Type: Use the confirmed download contents
- Intended Use: Printing, education, presentations, and map-based projects
Related Maps
- A Craighead County Arkansas Land Cover Map
- Arkansas County Arkansas Land Cover Map
- Ashley County Arkansas Land Cover Map
Sources and references
The supplied map statistics come from the map figures themselves. The links below provide the underlying land-cover documentation, county boundary source, and additional official context for Perry County’s water and forest setting.
- MRLC Annual NLCD Data – access to land-cover and impervious-surface datasets
- USGS Annual NLCD Land Cover Classification – definitions of mapped land-cover classes
- U.S. Census Bureau TIGER/Line Shapefiles – county boundary data
- U.S. Army Corps of Engineers – Nimrod Lake – official lake information
- USDA Forest Service – Ouachita National Forest – official forest and recreation context
- Encyclopedia of Arkansas – Perry County – county geography and Fourche La Fave River context
Green Map creates custom-edited map images using open geographic data sources such as geoBoundaries, Natural Earth, OpenStreetMap, and government open data.
These maps are edited visual materials, not raw data files, and are provided for education, documents, presentations, and graphic reference.