Download high-resolution JPG map files for Clay County, South Dakota, from the ZIP provided on this page. Vermillion sits near the southern center of the county and is the easiest place to use for orientation, while Wakonda is farther northwest. Meckling lies between those areas, and Burbank appears near the southeastern boundary. The supplied maps also show the Missouri River, Vermillion River, named creeks and ditches, Rose Lake, and an elevation range of 339 to 458 meters.
Clay County is more varied than the road map alone suggests. The Missouri River bends along the southern boundary, Vermillion River runs through the middle, and the elevation surface shows a broad low corridor through the center and south with higher ground on the western and eastern sides. Following Vermillion across the road, water, and elevation views is therefore a practical way to understand the county without turning the article into a list of separate map types.
Table of Contents
Vermillion ties together the southern road network
On the general county map, Vermillion is the most prominent settlement near the southern center. SD 19 approaches from the north, while SD 50 comes in from the west through the Meckling area before reaching Vermillion. SD 48 is labeled along the eastern side, and Burbank appears near the southeastern boundary. These roads and places provide a clear way to orient the southern half of Clay County.
Wakonda is farther northwest, separated from Vermillion by a broad rural interior. Meckling sits southwest of the county center, and Gayville is visible outside the western boundary, adding useful surrounding context. The county courthouse is labeled east of Vermillion, while the urban area itself is shown more prominently than the smaller communities. The map is designed for location reference rather than live navigation, so current road conditions and travel time should be checked separately.
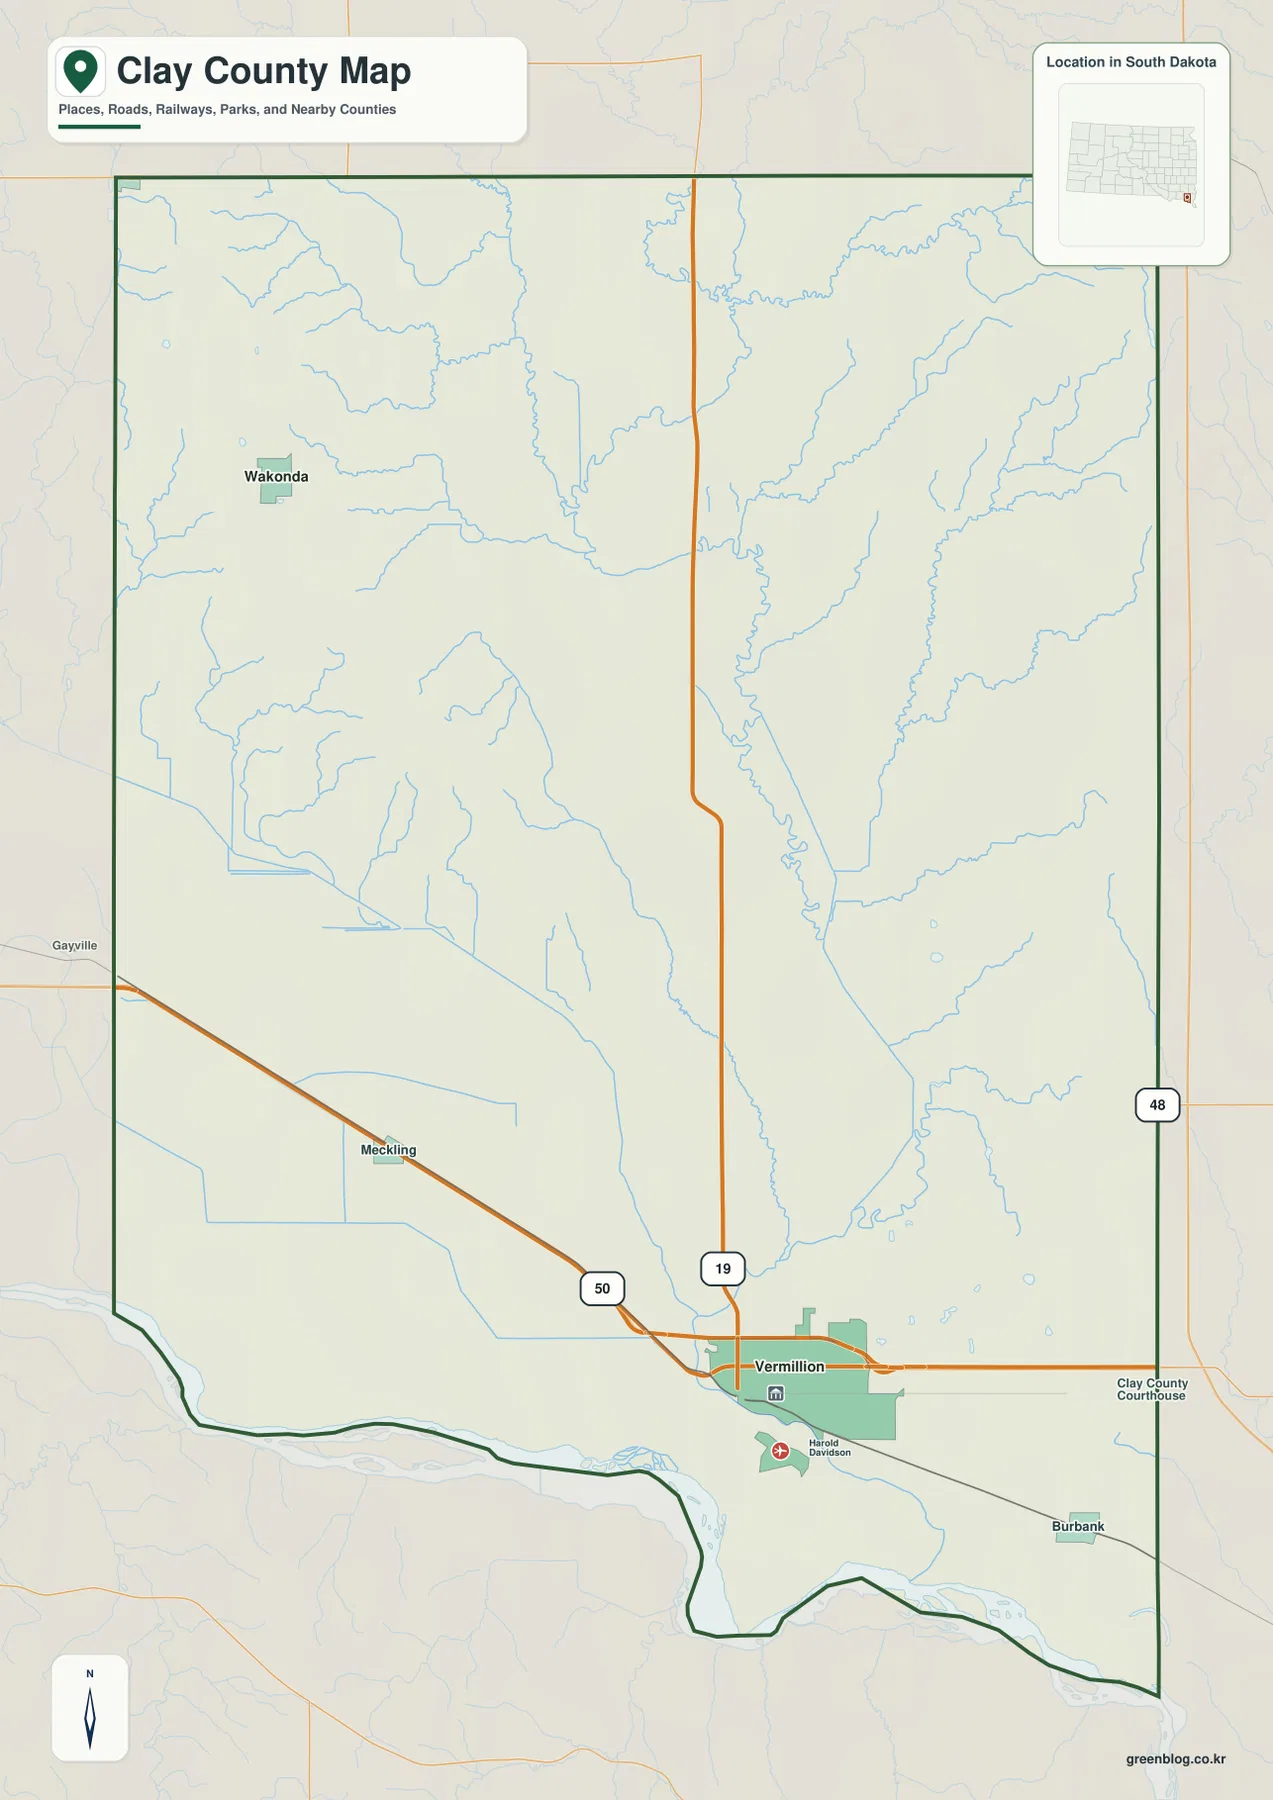
The county outline is especially recognizable along the south. Much of the west and east follows straighter boundary segments, but the southern edge bends with the Missouri River. Near Vermillion, the boundary curves around the river lowland rather than following a simple horizontal line. That river-shaped edge can be matched directly with the water and elevation views later in the page.
The northern and central parts contain many small drainage lines even where the road map shows few place labels. This is one reason the terrain-and-water view is useful after the road map: it fills in the large rural spaces between Wakonda, Vermillion, and the county edges.
Vermillion and Wakonda define the ranked city distribution
The city-index image is intentionally simple. It shows Vermillion in the southern part of the county and Wakonda in the northwest, making the contrast between the two main labeled communities easy to understand. Turner County is shown to the north, Union County to the east, Lincoln County to the west, and Yankton County toward the northwest-western side, providing a quick regional frame around Clay County.
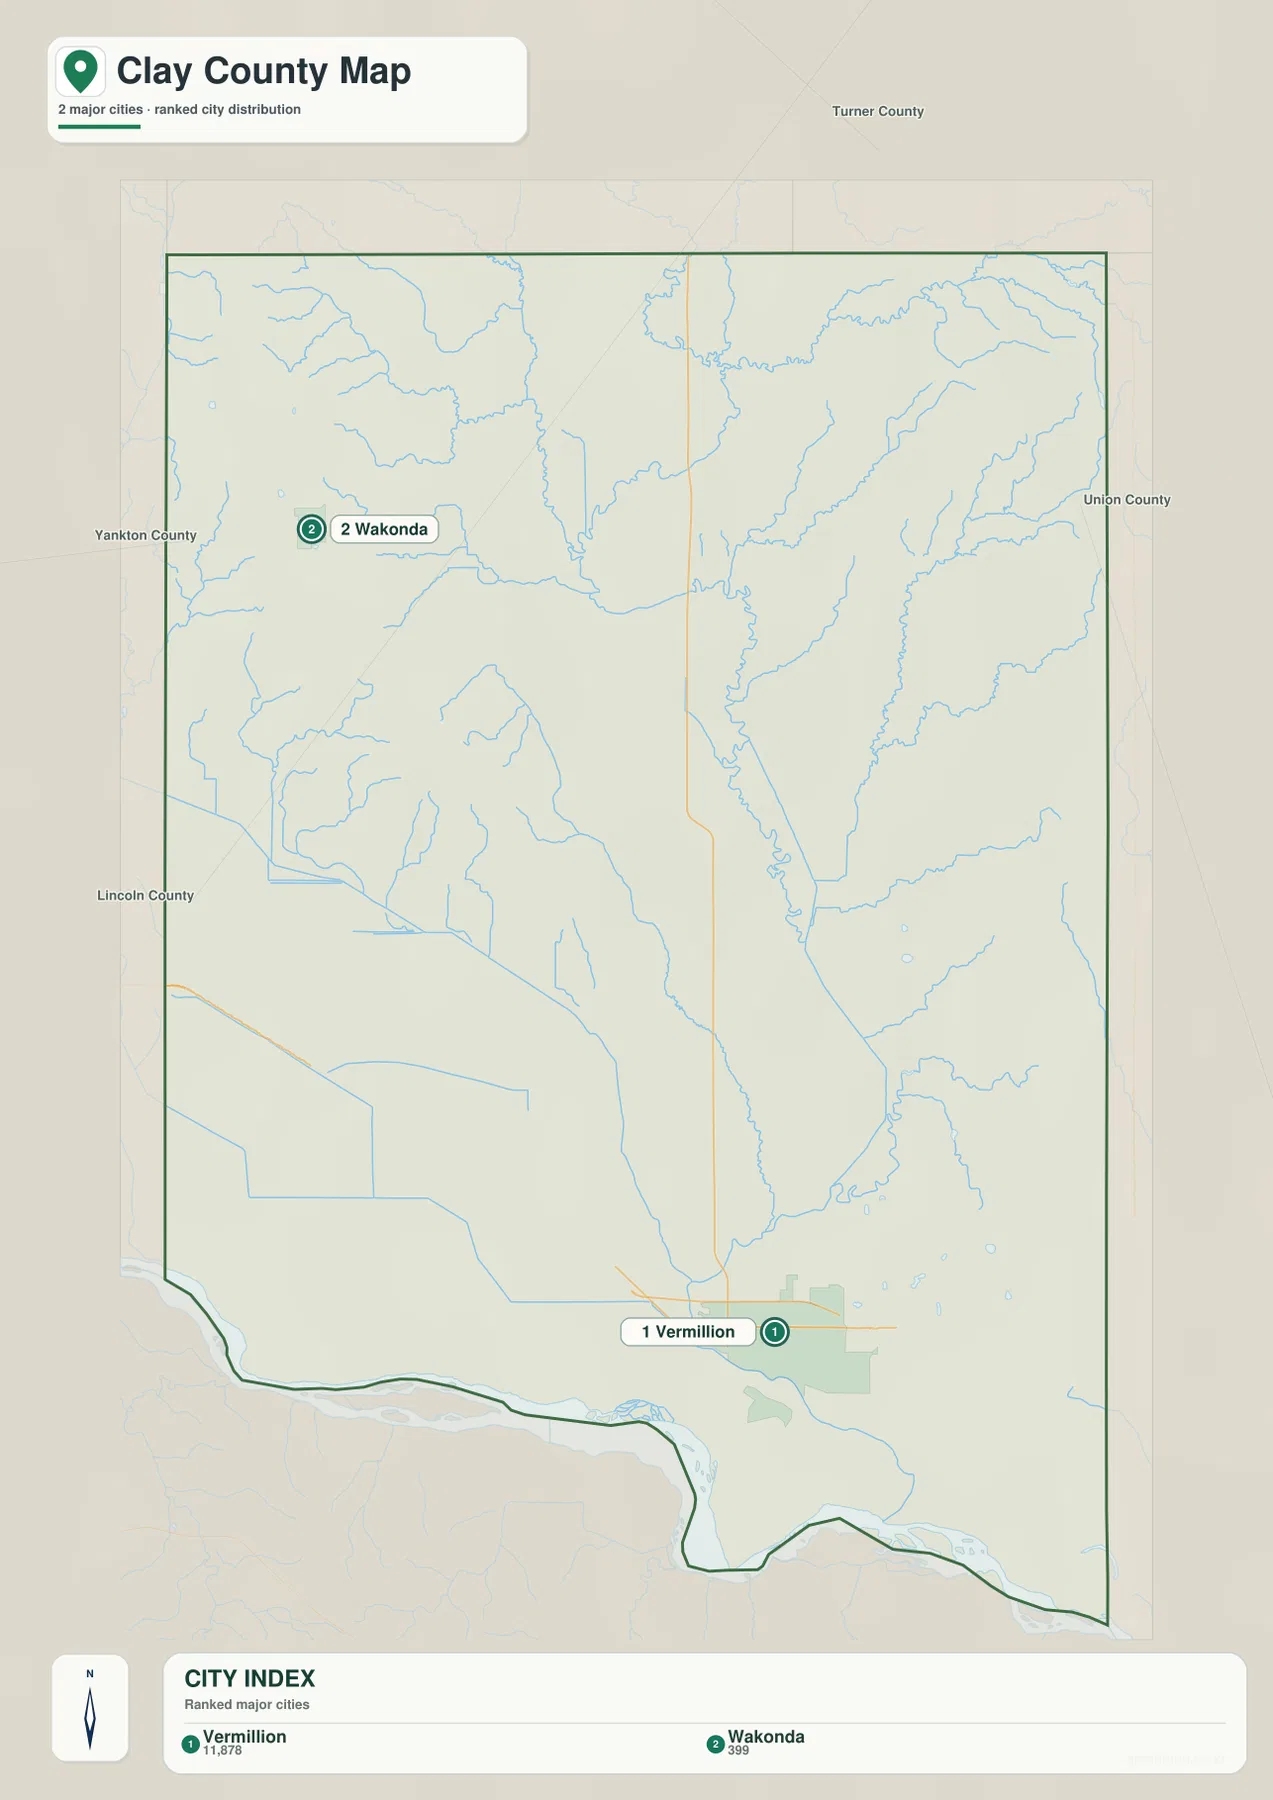
The CITY INDEX prints Vermillion 11,878 and Wakonda 399. This article treats those values only as numbers printed in the supplied image, not as a claim that they are the latest population estimates. Current population should be checked separately with the U.S. Census Bureau when it matters.
This is not a hub-and-distance diagram, so the two ranked labels should not be interpreted as straight-line mileage or driving distance. The image is useful for comparing settlement positions. For actual routes between Vermillion and Wakonda, return to the general county map and use a current navigation source for mileage and travel time.
Vermillion River connects the interior with the Missouri River lowlands
The terrain-and-water view makes Vermillion River the central named waterway. It enters from the north, bends through the middle of the county, and continues south toward the Missouri River corridor. The Missouri River forms the broad southern boundary and is the largest water feature on the map. Together, the two rivers provide the clearest natural frame for the county.
Spring Creek and Frog Creek are labeled in the northwestern and north-central area. Blind Creek and Ash Creek appear farther east, while Baptist Creek runs along the eastern half. In the southwest, Clay Creek Ditch and Yankton Clay Ditch are labeled, and Rose Lake appears in the southeast. These smaller names are easier to follow here than on the road-focused county image.
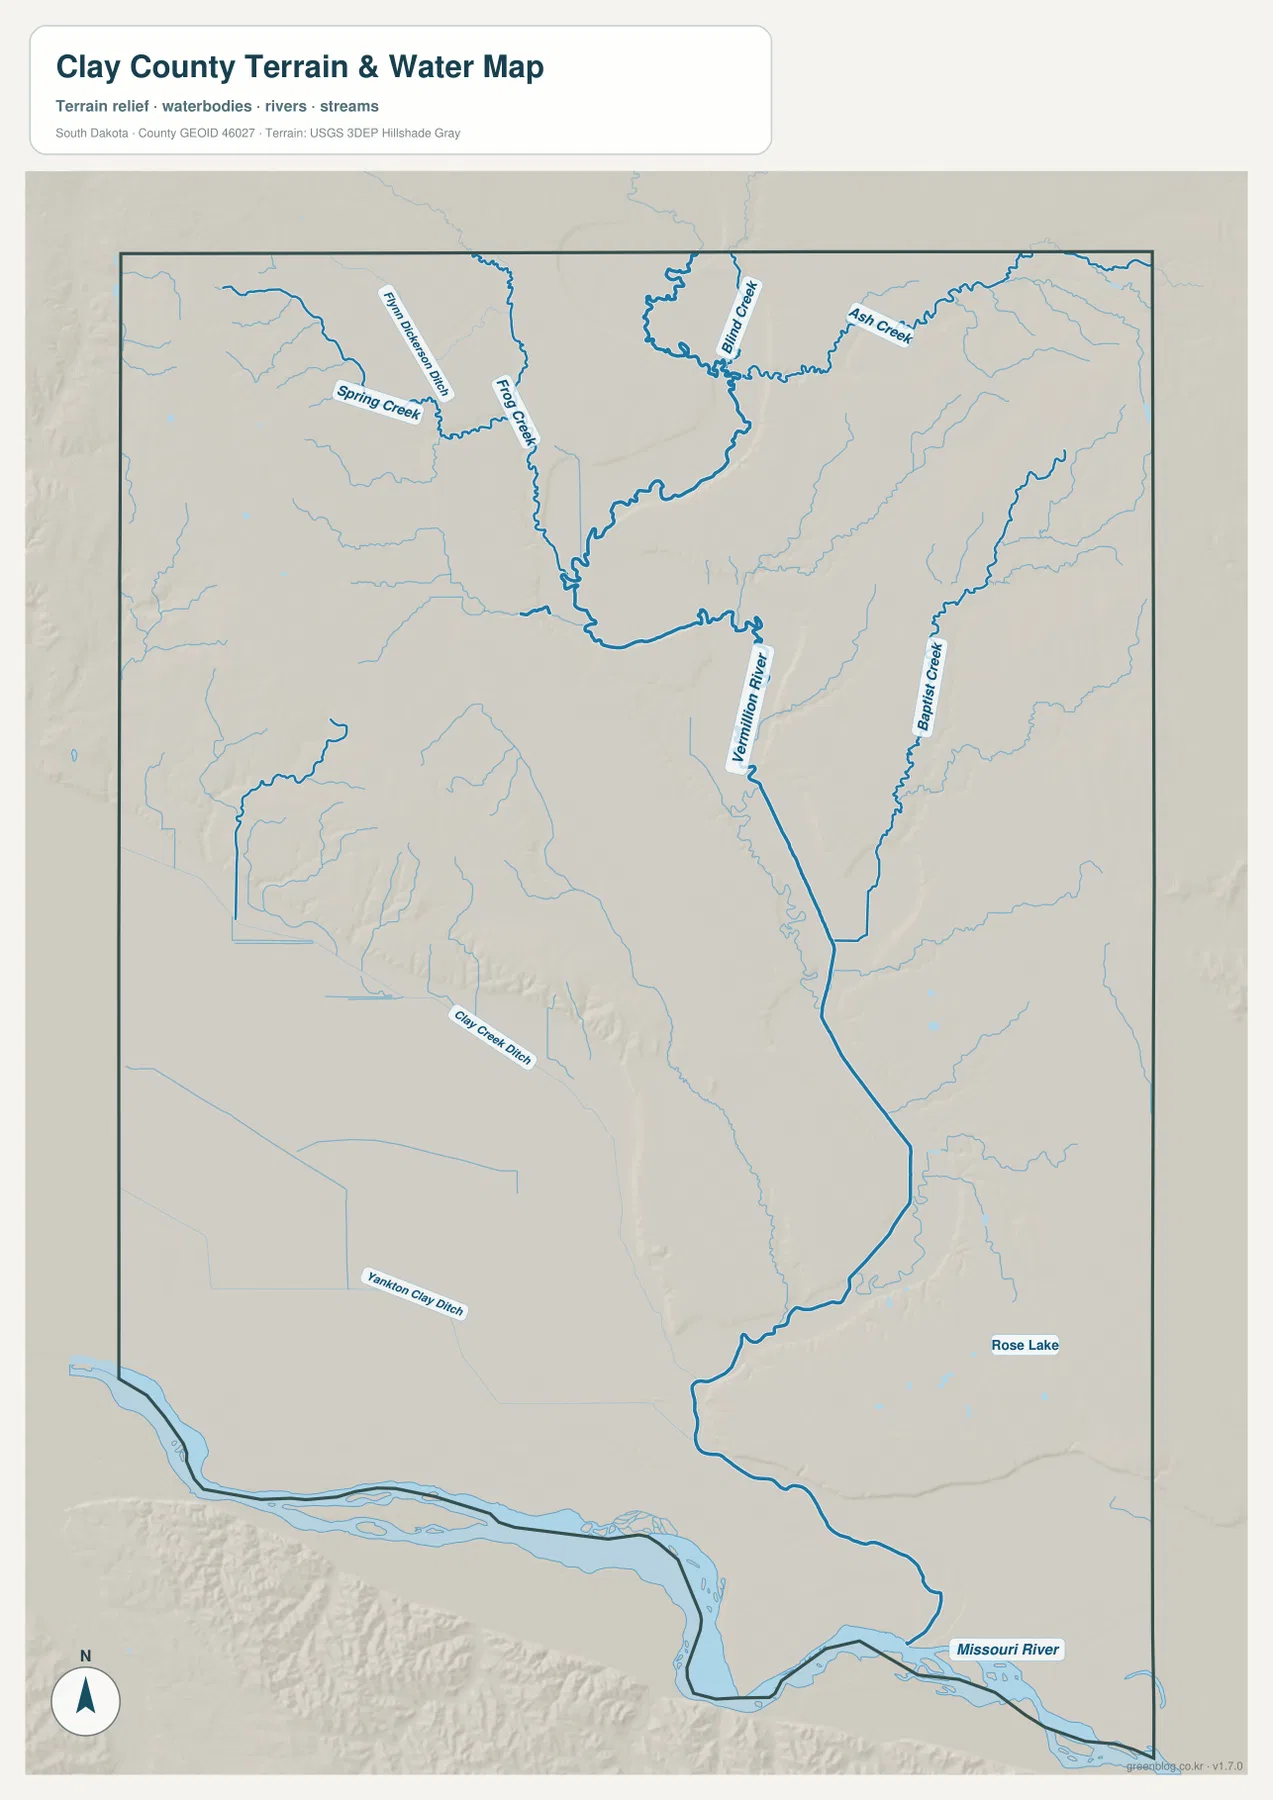
The central river corridor also explains why several small waterways approach from both sides. Northern creeks split into multiple branches, while the southern part opens into a wider lowland near the Missouri River. Rose Lake sits away from the main river line in the southeast, showing that not every named water feature belongs to one obvious continuous channel on the map.
This image is a location reference, not a live hydrologic product. It does not report current river stage, discharge, flood risk, water quality, fishing conditions, or boating safety. Anyone planning activity along the Missouri River, Vermillion River, or smaller waterways should use current USGS or local information.
A low central corridor separates higher western and eastern ground
The elevation view reports an actual county range of 339 to 458 meters and a mean of 374 meters. Dark green follows much of the Vermillion River corridor and spreads across the Missouri River lowland along the south. Higher yellows and browns appear on the western side, especially toward the northwest, and elevated terrain also returns along the eastern edge.
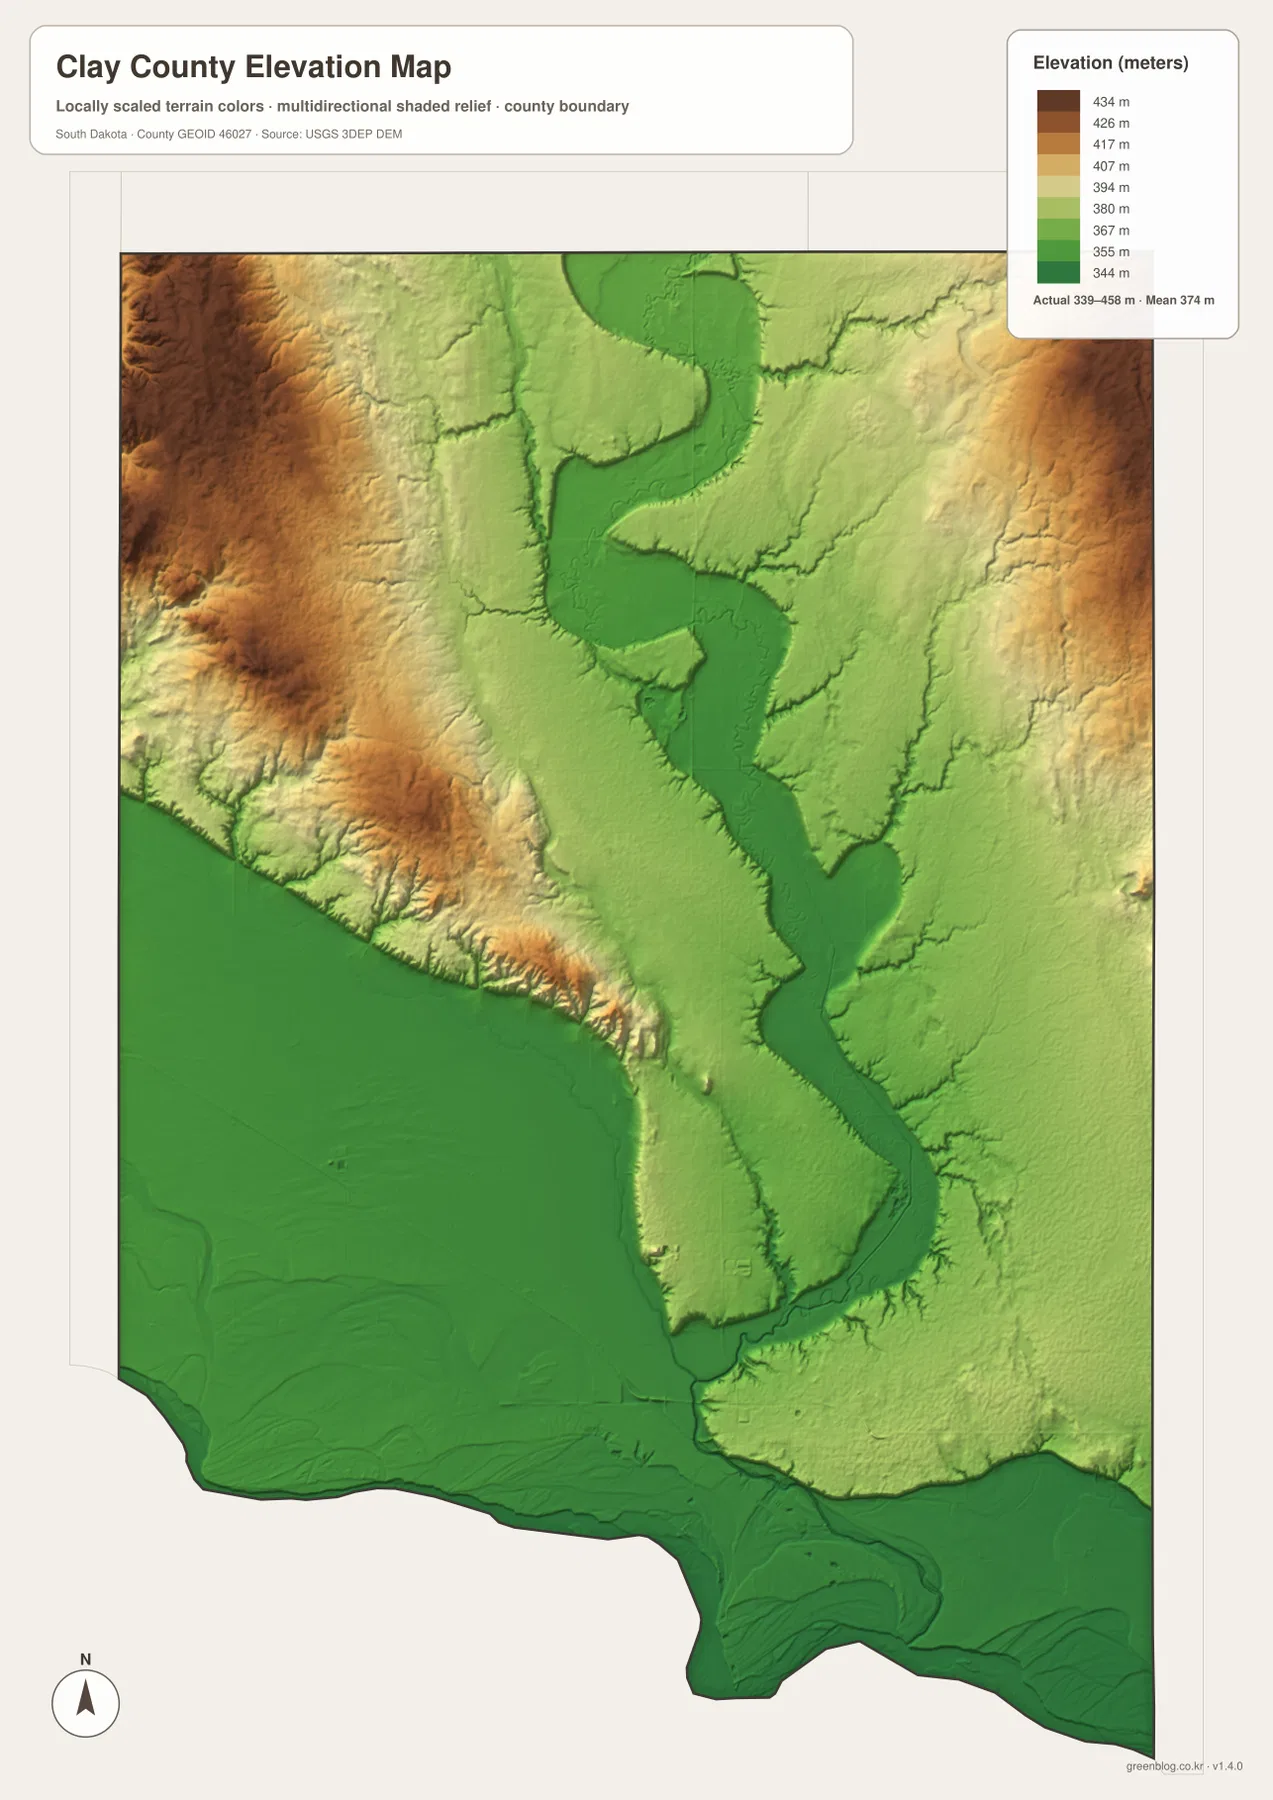
The relief is not a simple one-direction slope. Instead, the central and southern lowlands are bordered by higher terrain on both sides. The western uplands are especially visible, but the eastern edge also rises above the broad green corridor. This pattern helps explain why the rivers and creeks occupy such visually distinct low areas in the terrain view.
The 339–458 meter range is suitable for county-scale comparison, not parcel, building, or engineering measurement. A precise elevation for a road point or property should be checked with detailed USGS 3DEP data or a professional survey.
Use Vermillion to connect roads, rivers, and relief
Vermillion works as a cross-map anchor. The general map ties it to SD 50 and SD 19, the city index shows its position relative to Wakonda, the water map places it beside the central river corridor, and the elevation surface shows the same area within the broader lowland. Following one place through the views is more useful than treating each image as an unrelated inventory.
Wakonda provides a second reference in the northwest. It lies closer to the higher western side and the smaller creek network, while Burbank helps mark the southeastern edge near the rising eastern terrain. Meckling adds another road reference between the west and Vermillion. These place-based links make the county easier to remember and help readers choose the map that best matches their question.
The ZIP below contains the general county, city, terrain-and-water, and elevation maps as original high-resolution JPG files. Each image is 2572 × 3638 pixels in an A3-friendly format, suitable for printing, classroom handouts, presentations, and close viewing. Legal boundaries, live road conditions, current water information, flood decisions, and survey-grade elevation require current authoritative data in addition to these reference maps.
Frequently Asked Questions
Are Vermillion 11,878 and Wakonda 399 current population figures?
This article treats those numbers only as values printed in the supplied CITY INDEX. They should not be assumed to be the latest population estimates. Check current U.S. Census Bureau data if present-day population is important.
Can Vermillion River and the Missouri River be seen on the same map?
Yes. The terrain-and-water view follows Vermillion River through the center of Clay County and shows the Missouri River along the southern boundary. Spring Creek, Frog Creek, Blind Creek, Ash Creek, Baptist Creek, Rose Lake, and two named ditches are also visible.
Can the 339–458 meter elevation range be used for a specific property?
No. The range is useful for broad county-scale comparison. A property-specific or engineering elevation should be checked with detailed USGS 3DEP data or professional survey information.
Map File Information
The Clay County general, city, terrain-and-water, and elevation views are packaged as high-resolution JPG files.
- Included Files: Use only the versions confirmed in the article and supplied images
- File Type: Use the confirmed download contents
- Intended Use: Printing, education, presentations, and map-based projects
Related Maps
Sources and References
The article is based first on the names, roads, water features, and elevation values visible in the supplied Clay County maps. These official sources provide additional boundary, hydrography, and elevation reference information.
Green Map creates custom-edited map images using open geographic data sources such as geoBoundaries, Natural Earth, OpenStreetMap, and government open data.
These maps are edited visual materials, not raw data files, and are provided for education, documents, presentations, and graphic reference.