Stewart County, Tennessee is shaped by water, and the map files on this page are available to download as one ZIP containing four high-resolution A3 JPGs. Dover sits near the middle of a broad network of channels, while the western edge is lined with named bays and the east and south are cut by narrow valleys and short ridges. The maps compare Dover, Cumberland City, major roads, bays and creeks, and the county’s 108–234 meter elevation range, so readers can use the page as both a geographic guide and a direct route to the original map files.
The county map is the quickest reference for Dover, Big Rock, Cumberland City, routes, and the county outline. A simpler city map reduces the view to the two major-city labels used in the supplied graphic. The terrain-and-water sheet identifies Rushing Bay, Ginger Bay, Clay Bay, Byrd Bay, Hughes Bay, Panther Bay, Neville Bay, Saline Creek, Bear Creek, North Cross Creek, Standing Rock Creek, Long Creek, and other drainages. The elevation map then shows why many of those waterways occupy green low corridors between tighter yellow and brown ridges.
Table of Contents
Dover at the meeting point of roads and broad water corridors
Dover appears slightly west of the county’s visual center on the general map. Its importance is not limited to being the county seat. Several mapped roads approach or leave the town in different directions, and a large water corridor passes nearby. Route numbers 79 and 76 are shown around Dover, while 49 and 120 provide northward references. Farther east and southeast, the map labels 233, 351, 46, and 149, with 574 and 232 appearing toward the southern and southwestern side.
Big Rock is marked north and east of Dover, and Cumberland City is placed near the southeastern edge of Stewart County. This arrangement makes the county look less like a single town with evenly radiating roads and more like several local areas separated by water and broken relief. A route that looks short on a small-scale image can become longer once the channel crossings and winding terrain are taken into account.
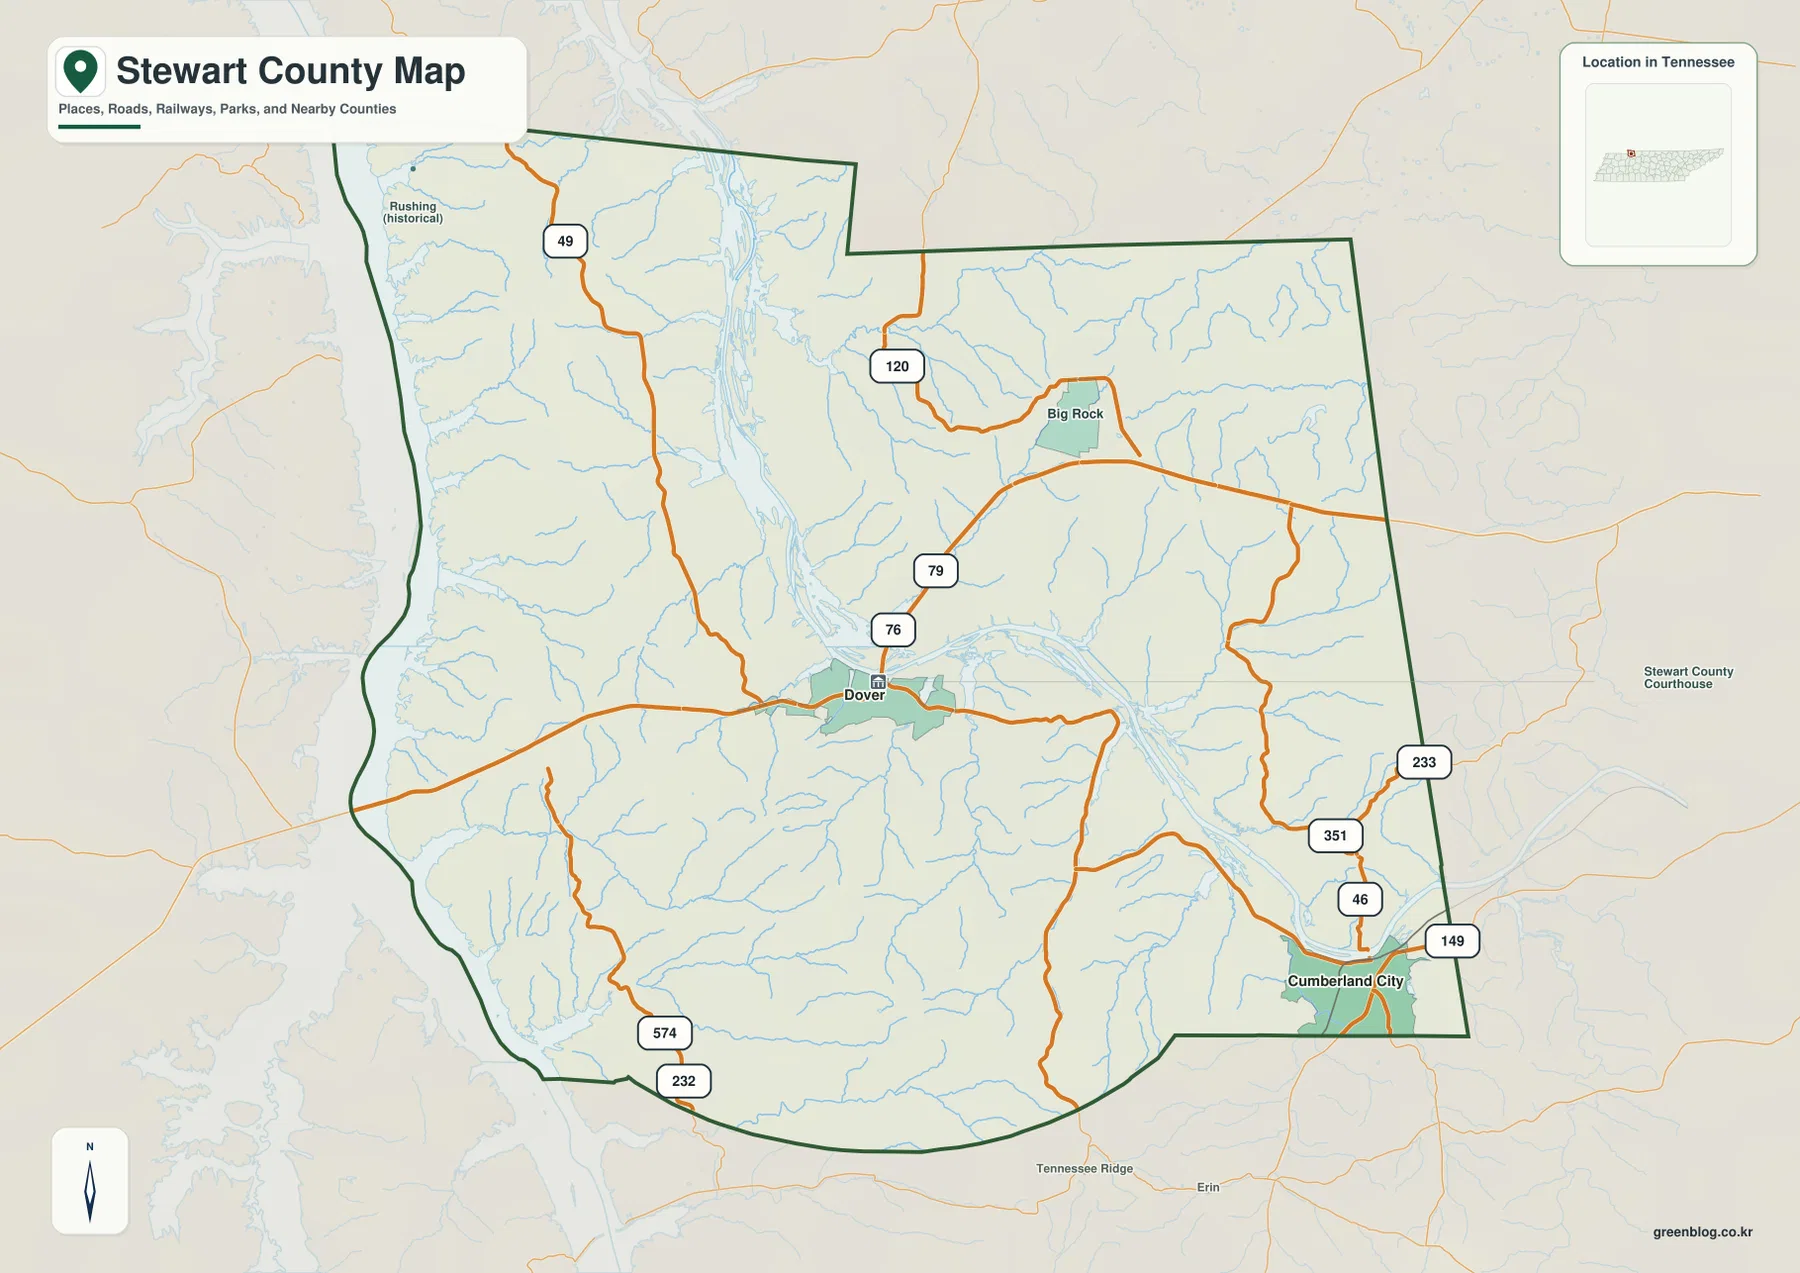
The county boundary itself deserves attention. The northern edge steps inward near the middle, the west side follows a broad water-influenced curve, and the southern edge is rounded rather than straight. The supplied county references identify Kentucky neighbors Trigg and Christian counties along with Montgomery, Houston, Benton, Henry, and Calloway County as surrounding reference areas. These outside names help explain where roads and water continue after leaving Stewart County, but they should be kept separate from places inside the county line.
What the two-city map reveals about Dover and Cumberland City
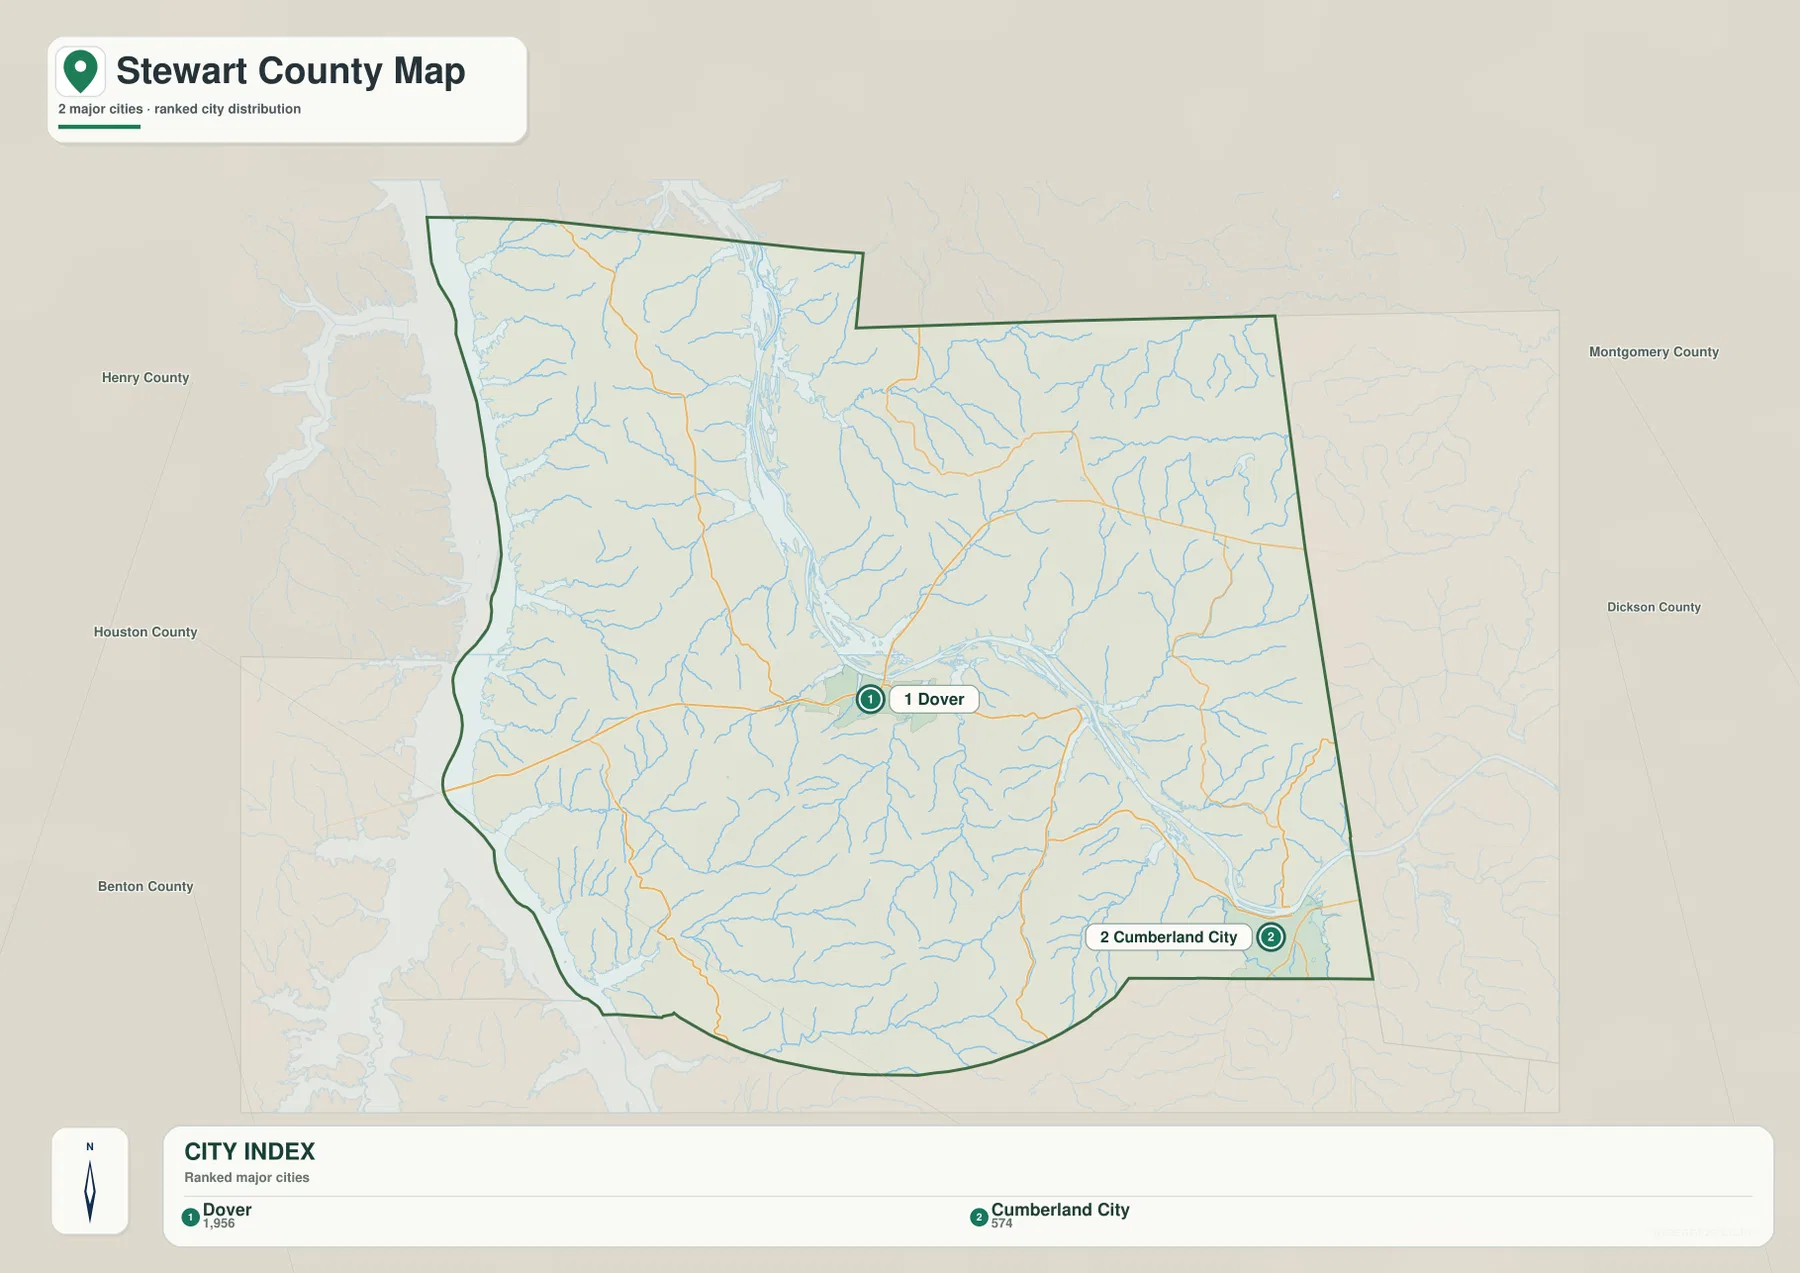
The city graphic intentionally removes much of the detail and emphasizes two labels: Dover in the central part of the county and Cumberland City in the southeast. Their separation is useful because it prevents a reader from assuming that the county’s population and road activity are concentrated in one compact center. Dover anchors the middle of Stewart County, while Cumberland City provides a second reference near a different set of roads and a different part of the water network.
The City Index printed on the supplied image lists Dover at 1,956 and Cumberland City at 574. Those figures are best read as the values attached to this city-ranking graphic rather than as a complete population summary for the county. The existing county material separately gives a 2020 census population of 13,657 and a July 2025 estimate of 14,439, so most of the county’s population is not represented by the two city numbers alone.
Dover is the county seat in the supplied historical reference, and Stewart County was established in 1803. That administrative role makes Dover the first place to locate for county-government orientation, but it is not the only useful geographic anchor. Cumberland City, Big Rock, the western bays, and the major water corridor all add context that a county-seat-only map would miss.
A western chain of bays and a branching network of creeks
The water map gives Stewart County a very different appearance from the road map. Along the western boundary, Rushing Bay, Ginger Bay, Clay Bay, Byrd Bay, Hughes Bay, and Panther Bay are labeled from north to south. Rather than forming a clean land edge, this side of the county is cut by repeated fingers of water. The sequence of bay names is one of the most county-specific details in the entire map set and makes the western side easy to recognize.
Neville Bay occupies a long north-central corridor, and Saline Creek approaches from the northeast. Bear Creek is labeled west of the main central channel, while North Cross Creek drains from the eastern side. South of Dover, Standing Rock Creek, North Fork, East Fork, and Long Creek follow separate valleys through the hills. The waterways do not form a tidy parallel pattern; they branch and bend according to the relief, which is why the shaded terrain background is especially helpful on this map.
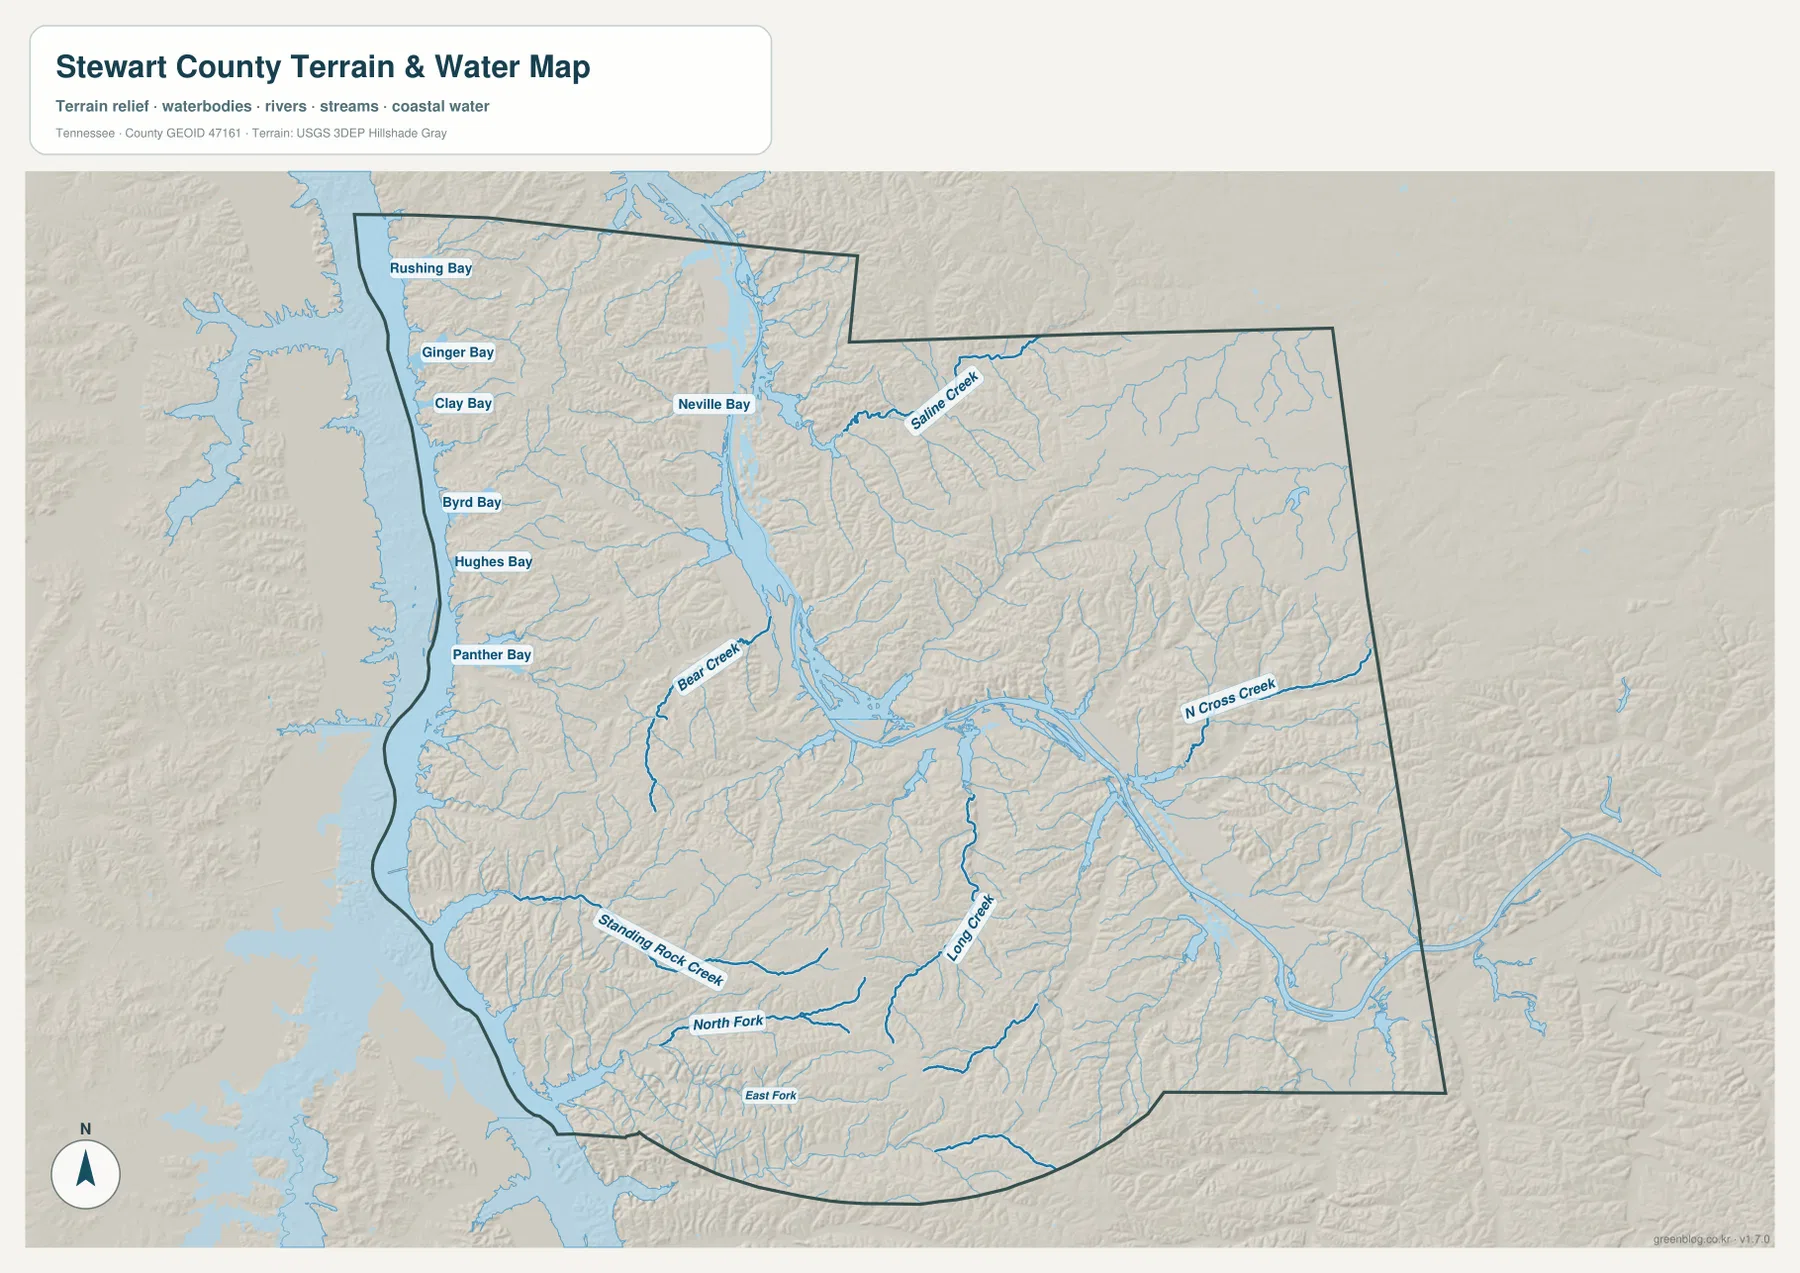
The supplied county reference material also uses Cumberland River, Lake Barkley, Tennessee River, and Kentucky Lake as major geographic anchors. Taken together with the map, those names explain why water has such a strong influence on the county’s shape and internal travel. This static sheet is not a navigation or flood product, however. It does not provide current water level, depth, boat-channel status, flood limits, or temporary access conditions.
Relief from 108 to 234 meters across a deeply cut hill landscape
The elevation legend gives Stewart County an actual mapped range of about 108 to 234 meters and a mean of about 155 meters. The absolute elevations are modest, yet the shaded surface is far from flat. Green follows the major waterways and many smaller drainage valleys, while yellow, tan, and brown occupy the ridges between them. The result is a dense texture of short hills and narrow low corridors across much of the county.
The northwest and west-central sections contain many small valleys dropping toward the large western water body. Similar branching relief covers the south. The east includes some broader areas of higher tan and brown terrain, although green creek valleys still cut into them. One of the clearest comparisons is the broad green central channel against the tightly folded ridges on either side: the water network and elevation pattern match each other closely.
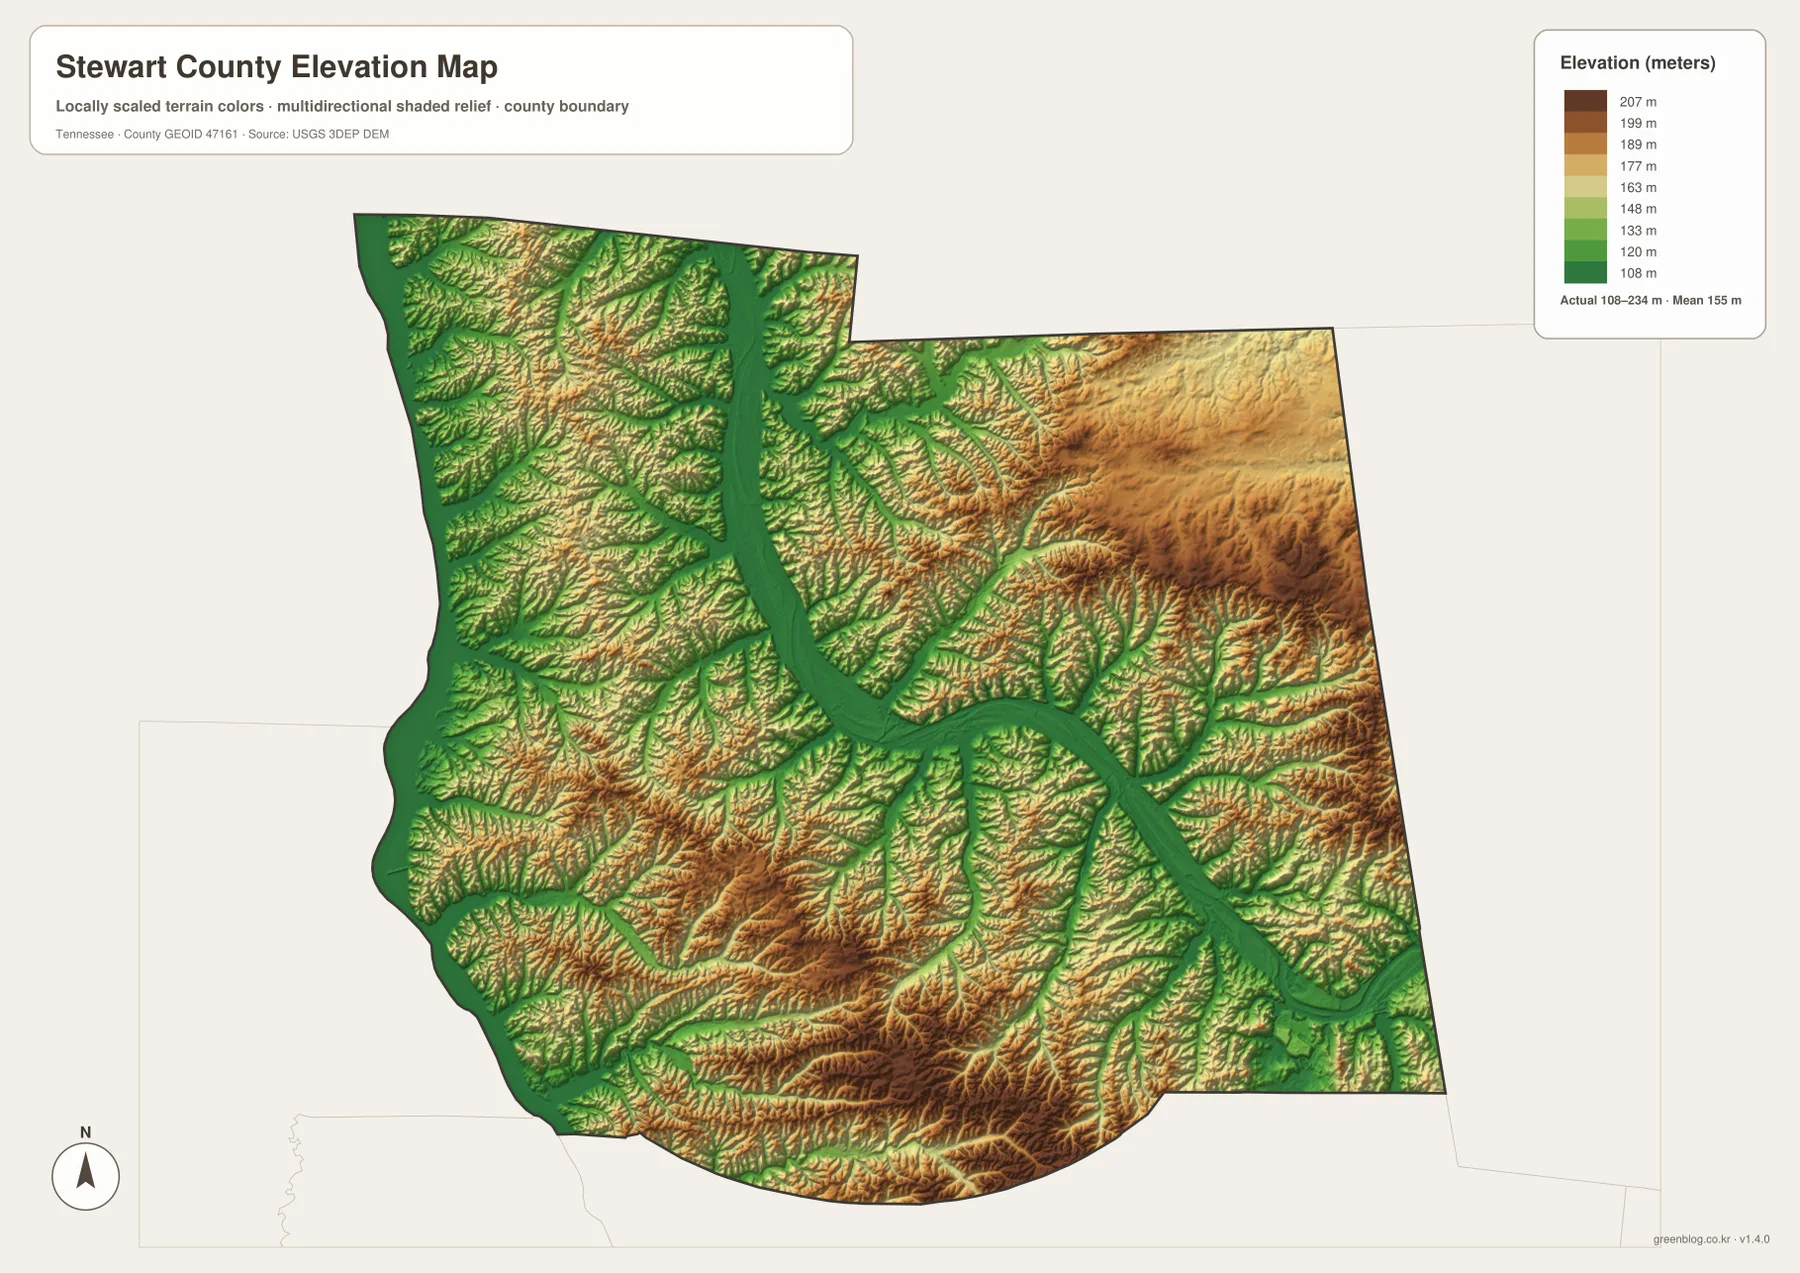
This helps explain why local roads often bend through valleys instead of following a rigid grid. A road heading north or south from Dover may have to work around both the large channel and several smaller creek valleys. The map is appropriate for county-scale terrain comparison, but it should not be used to determine the exact elevation, slope, drainage design, or buildability of an individual parcel.
Why 33.2 square miles of water matter more than the percentage suggests
The existing Gazetteer figures list about 459.8 square miles of land and 33.2 square miles of water in Stewart County. Land clearly accounts for most of the total area, but the map shows why an area percentage alone can be misleading. Water follows long boundaries, reaches inland through bays, and divides the central landscape, so it can affect orientation and route choice far beyond the acreage that it occupies.
Using the supplied 2020 population of 13,657 and the listed land area gives a countywide density of roughly 29.7 people per square mile. That average describes overall scale, not an even settlement pattern. Dover and Cumberland City are labeled urban reference points, while broad sections of the west, north, and south contain bays, hills, creeks, and few city labels. Reading the population figure beside the maps makes that contrast clearer than reading the number on its own.
The source package also identifies Cross Creeks National Wildlife Refuge, part of Fort Donelson National Battlefield, part of Land Between the Lakes National Recreation Area, and Barkley Wildlife Management Area as important managed-land references in Stewart County. Those names help explain why some large areas are better understood as landscape or conservation blocks than as town-centered space. The county maps do not replace official management maps for entrances, closures, legal boundaries, or permitted activities.
Which Stewart County map is most useful for each question?
Start with the general county map if your main question involves Dover, Cumberland City, Big Rock, road numbers, or the county boundary. The city map is faster when you only need to compare the two major-city labels. The water map is the strongest choice for the western bay chain and named creeks, while the elevation map adds the missing explanation for why those creeks occupy narrow branching valleys.
For a printed study copy, it is often clearer to separate transportation and physical geography. A road-focused sheet might mark Dover, Cumberland City, 79, 76, 120, 233, and the major crossings. A physical-geography copy could emphasize Neville Bay, Saline Creek, Bear Creek, North Cross Creek, the chain of western bays, and the 108–234 meter relief. Keeping those tasks separate preserves the readability of the original maps while still allowing detailed notes.
Frequently Asked Questions
Why are so many bays labeled along the western side of Stewart County?
The western boundary is cut by repeated arms of a large water body rather than following a simple dry-land line. The supplied map labels Rushing, Ginger, Clay, Byrd, Hughes, and Panther bays in sequence. Their shapes help explain why the western side of Stewart County looks much more irregular than a typical straight county boundary.
Does the elevation range of 108–234 meters mean Stewart County is mostly flat?
No. The overall elevations are not extremely high, but the relief map shows many closely spaced ridges and narrow valleys. Major channels and creeks occupy the lower green corridors, while the hills between them rise into yellow and brown. The repeated short changes in elevation are more important here than a single high mountain.
Which map should I use to compare Dover with Cumberland City?
The city map gives the quickest visual comparison because it reduces the county to those two major-city labels. Use the county map next if you need to see the roads and water between them. Dover sits nearer the middle of the county, while Cumberland City is close to the southeastern edge, so the two places represent different parts of Stewart County.
Map File Information
The ZIP includes high-resolution JPG versions of the Stewart County map, city map, water map, and elevation map used in this article. The four A3-format originals are better suited to printing, enlargement, and annotation than the smaller WebP previews displayed in the page body.
- Included Files: County map, city map, water map, and elevation map
- File Type: ZIP containing 4 JPG images
Related Maps
- Smith County Tennessee map | Carthage and Cumberland River
- Alamo to Gadsden: A Crockett County Tennessee Map
- Altamont, Monteagle, and Plateau Valleys — Grundy County Tennessee Map
Sources and References
- Tennessee State Library and Archives Stewart County fact sheet
- Tennessee Department of Transportation Stewart County map
- U.S. Census Bureau Stewart County QuickFacts
- U.S. Census Bureau Gazetteer Files
- USGS National Hydrography
- USGS 3D Elevation Program
Green Map creates custom-edited map images using open geographic data sources such as geoBoundaries, Natural Earth, OpenStreetMap, and government open data. These maps are edited visual materials, not raw data files, and are provided for education, documents, presentations, and graphic reference.