Smith County is shaped visually by the Cumberland River, which makes a series of broad bends through the middle of the county instead of crossing it in a straight line. Carthage and South Carthage sit close to this river corridor, while Gordonsville lies farther south near the I-40 corridor. The maps on this page let you compare those settlements with major roads, named streams, river valleys, and the surrounding ridges. The same map set is also available as downloadable high-resolution A3 JPG files in one ZIP archive.
The four supplied maps emphasize different parts of Smith County. The county map is the best starting point for roads, boundaries, and the main labeled communities. The city map strips that information down to the relative position of South Carthage, Carthage, and Gordonsville. The water map makes the Cumberland River and tributaries such as Peyton Creek and Defeated Creek easier to follow, while the elevation map shows how the low river corridor sits between higher, dissected hills.
Table of Contents
Carthage and South Carthage beside the Cumberland River bends
On the county map, the most distinctive feature is the Cumberland River looping through the central part of Smith County. Carthage appears beside one of the large bends, and South Carthage is immediately to the south. Because the two names are close together, it is easy to treat them as a single location at first glance, but the river and connecting roads matter. Reading the water line together with the settlement labels makes the local layout much clearer than reading the place names alone.
Several numbered roads converge in and around the Carthage area. The map shows routes including 24, 25, 70N, 80, 85, and 263, with different branches leading west, north, east, and south from the river corridor. Farther south, the Gordonsville area connects with 53, 264, 141, and I-40. This gives Smith County two readily recognizable transportation settings: a river-centered network around Carthage and a southern corridor strongly associated with the interstate.
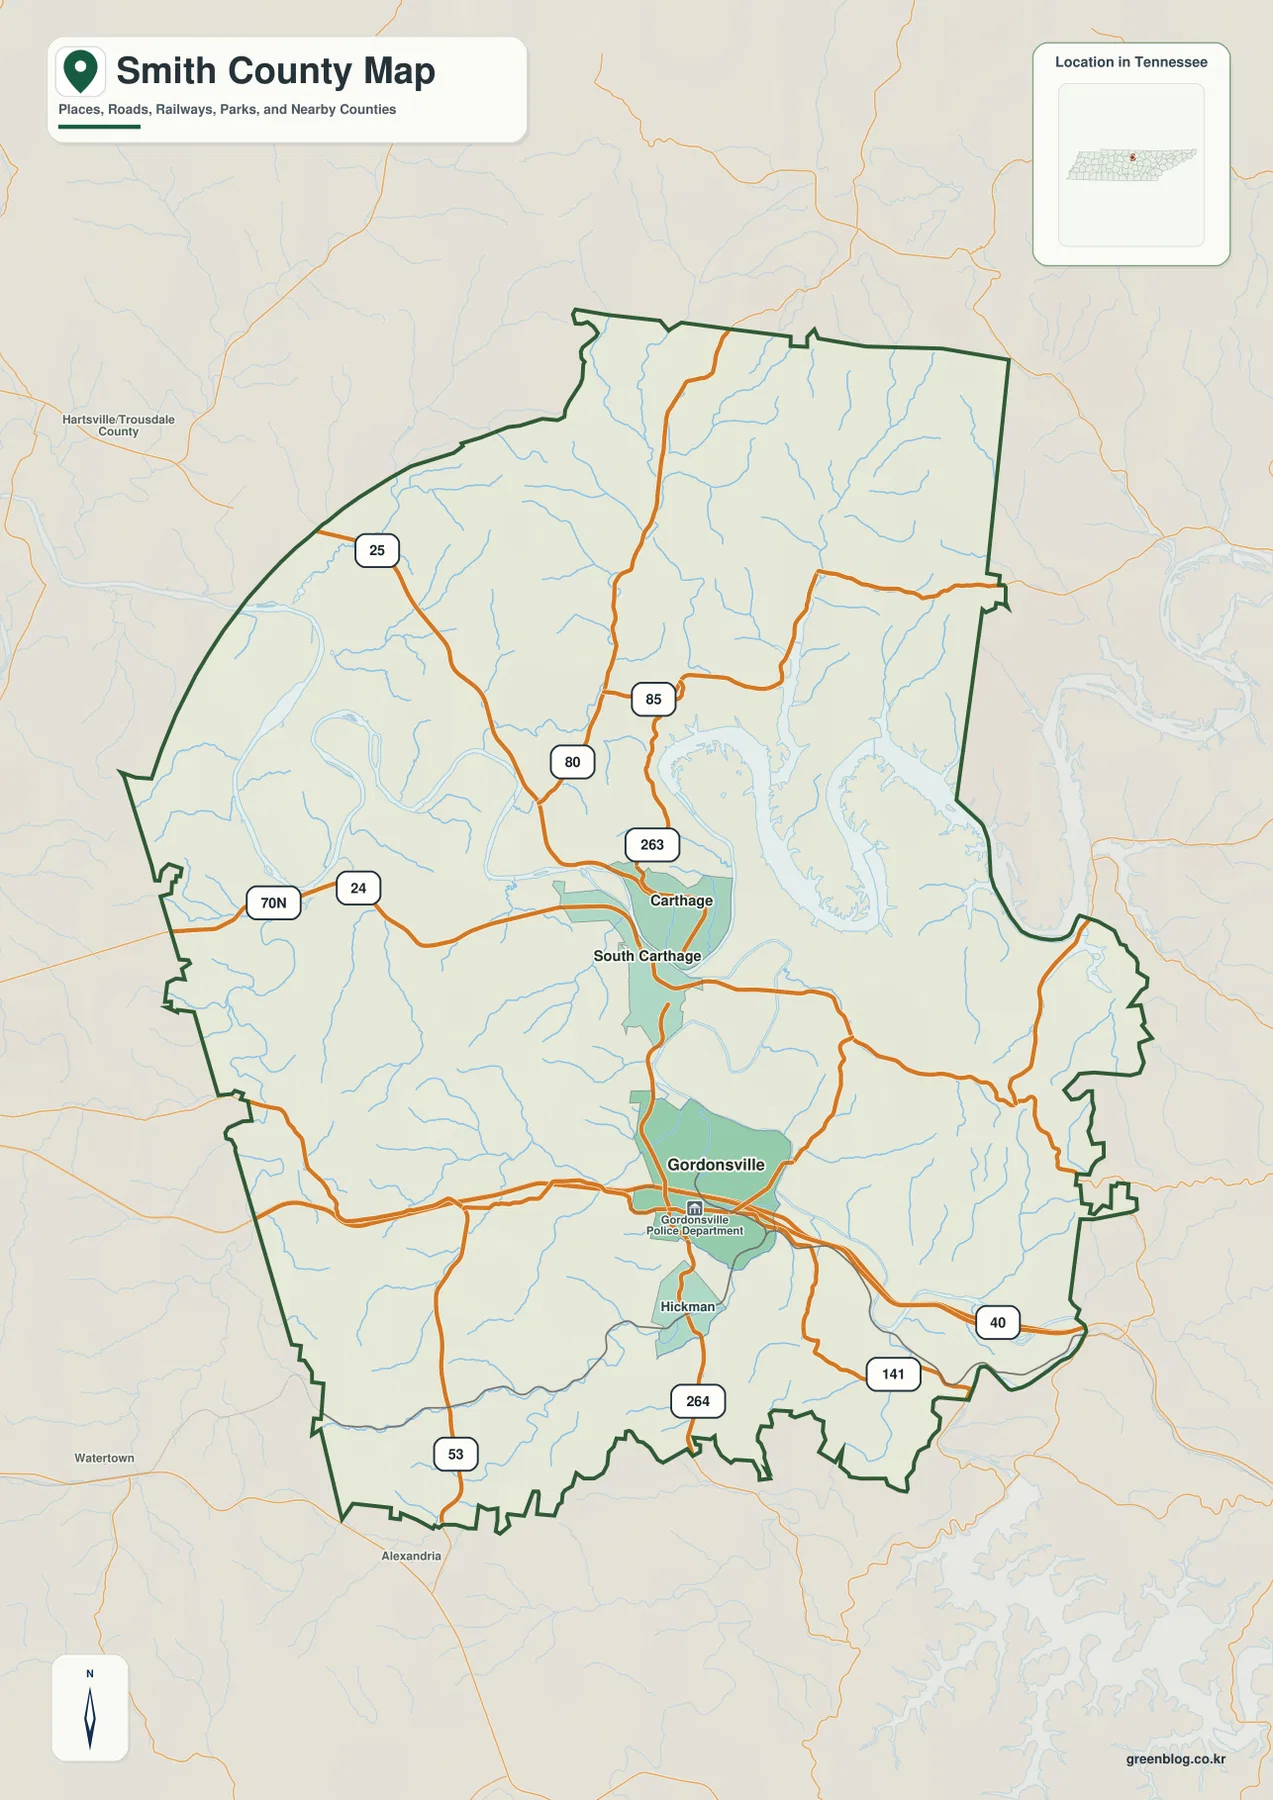
The neighboring-county labels also help orient the map. Macon County is to the north, Jackson and Putnam counties are on the eastern side, DeKalb and Wilson counties are toward the southwest, and Trousdale County lies to the west. Hartsville/Trousdale County appears outside the western edge, while Watertown and Alexandria provide outside reference points near the southwest. These labels are useful for understanding where roads continue after they leave Smith County, but they should not be mistaken for places inside the county boundary.
A short South Carthage–Carthage link and a separate Gordonsville center
The city-connections map uses South Carthage as its hub and presents direct distances rather than driving routes. Carthage is shown about 1 mile away in a straight line, while Gordonsville is about 4 miles away. Those figures are useful for comparing relative position, but they do not account for bridge locations, road curves, intersections, or other conditions that determine an actual trip. The distinction matters especially in a county where a large river separates or redirects local movement.
Spatially, Carthage and South Carthage form a tight river-side pair, while Gordonsville stands apart to the south. When the city map is compared with the county map, Gordonsville’s relationship with I-40 becomes much more obvious. That contrast is one of the most useful ways to understand Smith County: the administrative and river-oriented center around Carthage is not in the same place as the county’s clearest interstate-access center.
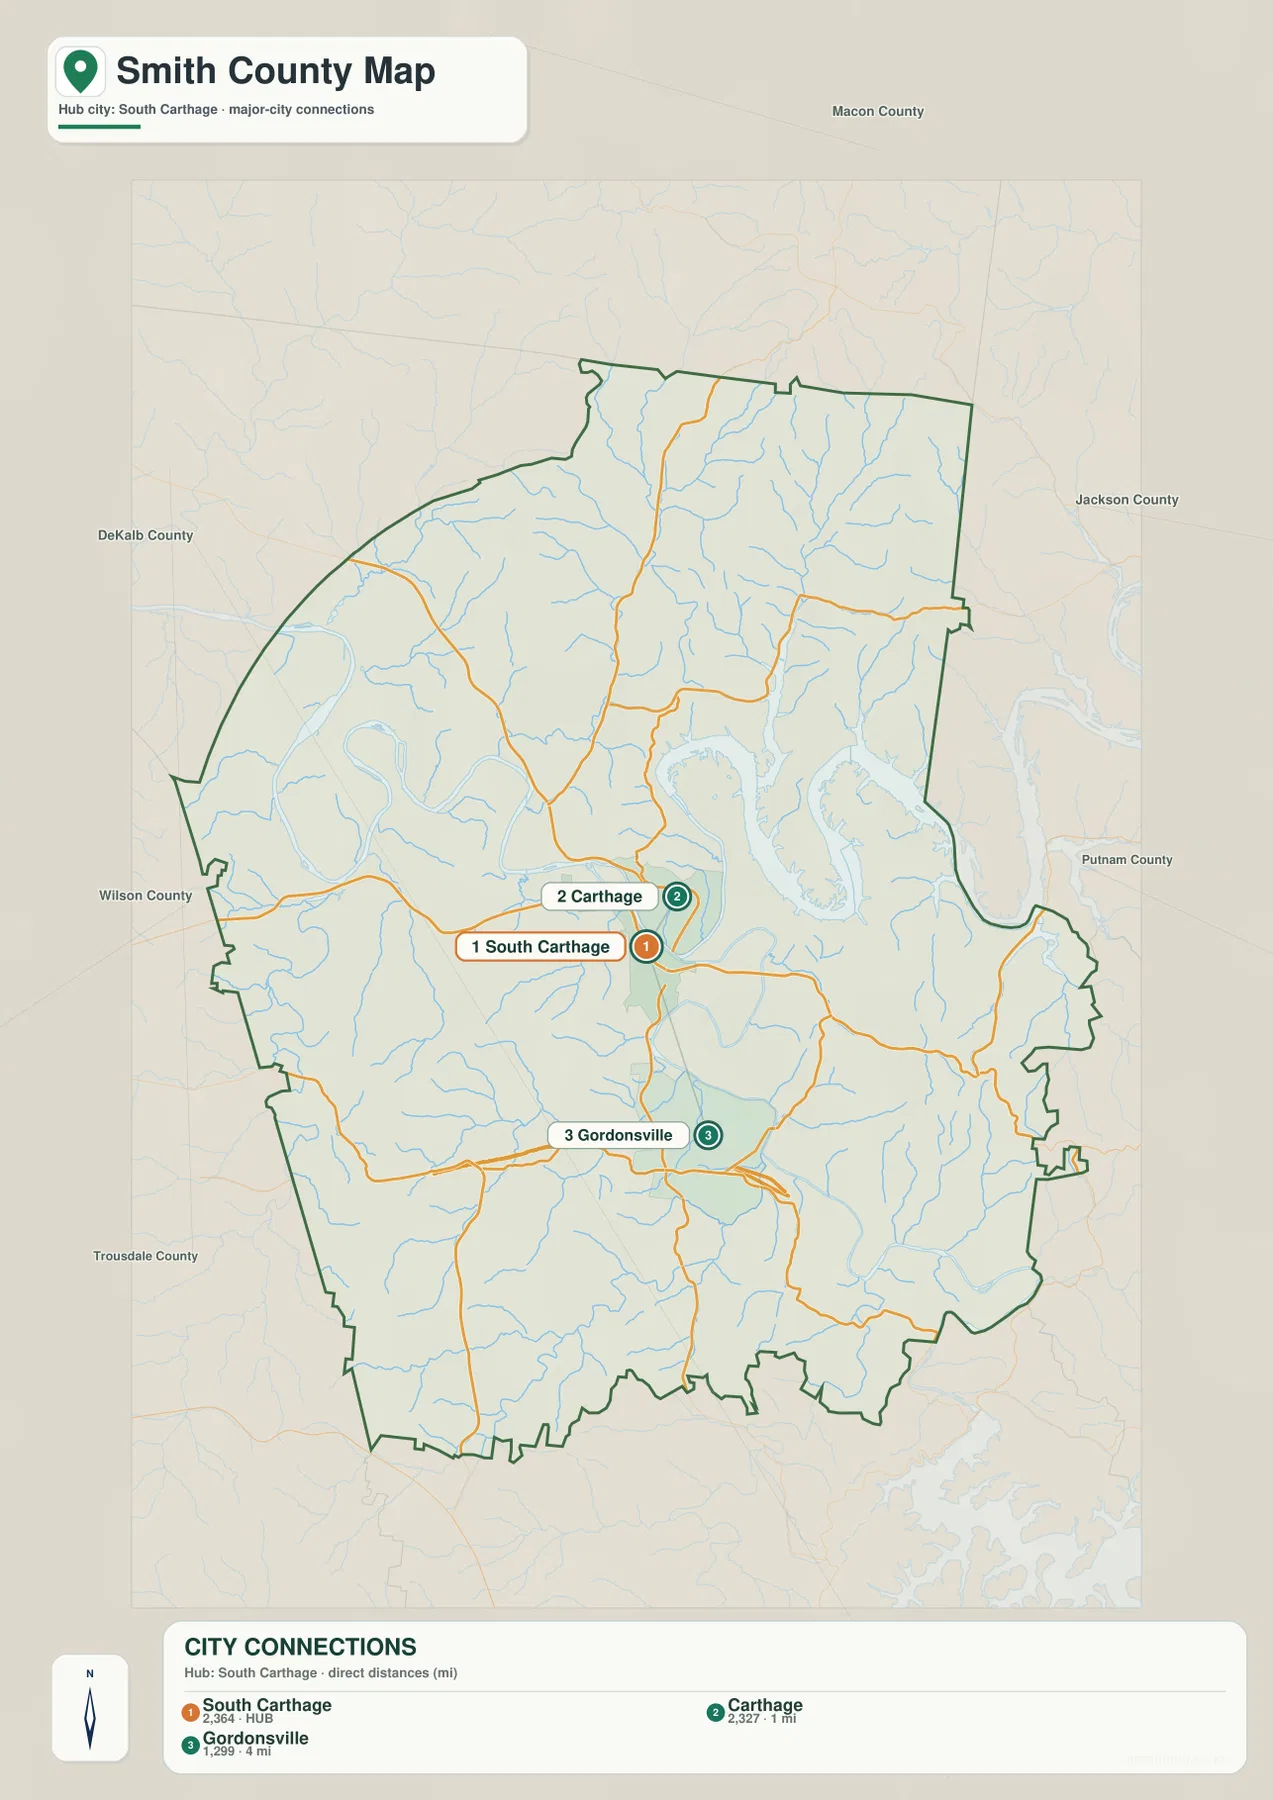
The city graphic also lists South Carthage at 2,364 people, Carthage at 2,327, and Gordonsville at 1,299. These values are best treated as supporting labels for the city comparison rather than as a substitute for countywide population data. The existing Smith County reference material gives a 2020 census population of 19,904 and a July 2025 estimate of 20,981, so a large share of the county’s population lives outside the three labels emphasized on this simplified city map.
The Cumberland River and tributaries threading through the hills
The terrain-and-water map makes the river network much easier to understand. The Cumberland River enters the county from the west, bends repeatedly through the middle, passes the Carthage area, and continues toward the east. Its course is broad and sinuous, with several large loops that occupy a substantial visual portion of the map. This is important because two places that appear close in straight-line distance can still be separated by a river bend or by a limited number of practical crossings.
North of the river, Peyton Creek runs southward through the central-northern hills, and Defeated Creek descends from the northeast. Young Branch and Wilburn Creek are labeled in the northwest. South and east of the main river, the map identifies Hogan Creek, Snow Creek, Hickman Creek, Brush Creek, and other smaller drainages. These tributaries are not distributed randomly: most follow narrow valleys cut between the ridges that are visible in the shaded terrain background.
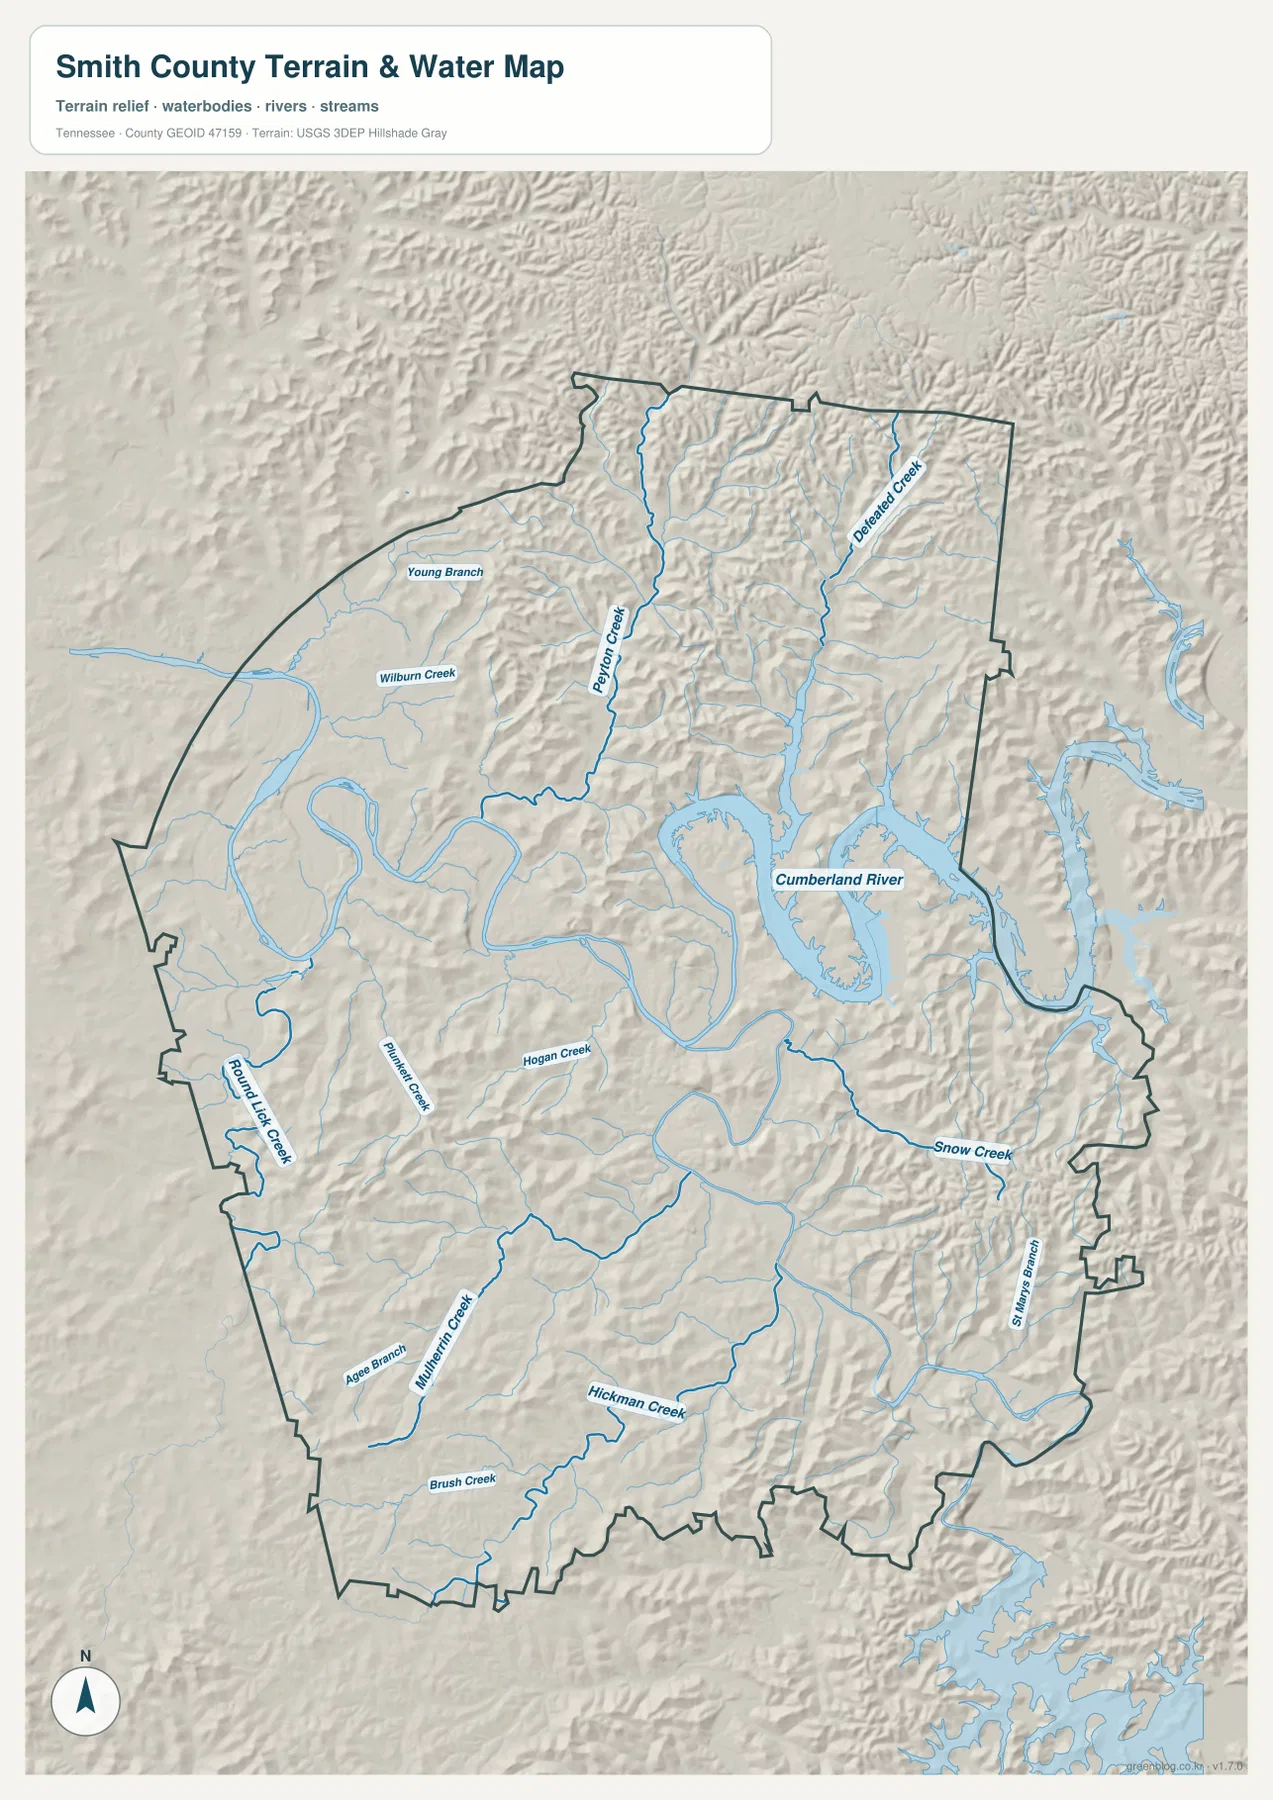
This water map is intended for geographic reference. It does not show real-time river stage, flood limits, water depth, safe boating channels, or parcel boundaries. The mapped shoreline can also look different at another scale or water level. For boating, flood planning, emergency decisions, or property research, the appropriate current agency data should be used in addition to this static county map.
Low river valleys surrounded by higher northern and southeastern ridges
The elevation map shows an actual mapped range of about 137 to 380 meters, with a mean elevation near 206 meters. The green tones associated with lower elevations follow the Cumberland River and many of the larger creek valleys. Between those low corridors are narrow ridges in yellow, tan, and brown. Smith County therefore does not appear as a broad flat plain; it is a strongly dissected landscape where streams and roads repeatedly pass between higher pieces of terrain.
The northern and northeastern parts of the county contain some of the most closely spaced ridges on the map. Similar higher ground appears in the southeast and parts of the southwest. By contrast, the river loops through the center form a conspicuous lower corridor. Comparing this map with the water map shows why Peyton Creek, Defeated Creek, and the smaller southern streams occupy branching green valleys: the waterways generally follow the lower routes between the ridges.
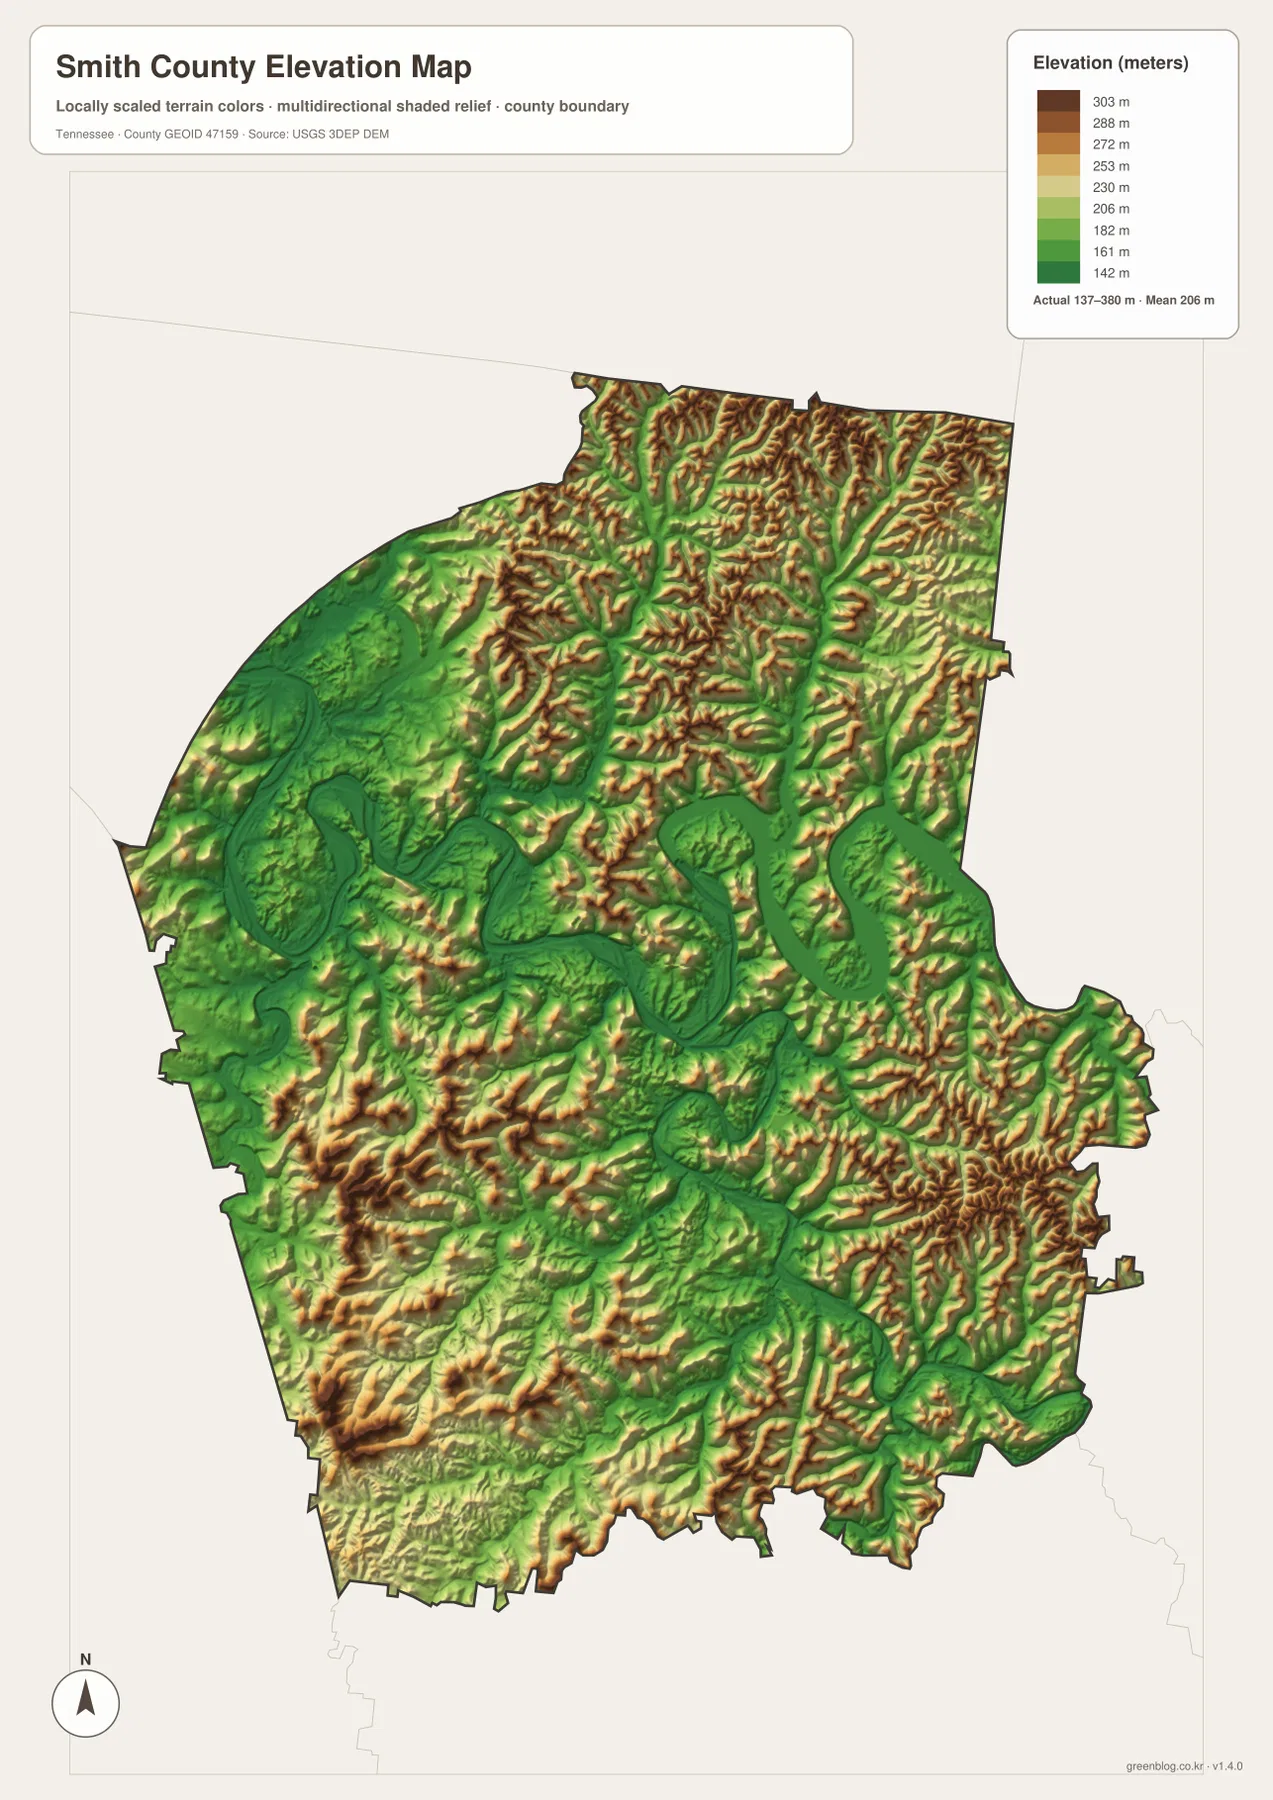
The elevation layer is useful for county-scale comparison, not for engineering or survey work. A generalized shaded surface can show where terrain rises and falls, but it does not provide the precision needed for a building site, drainage design, property-corner elevation, or road grade. Those questions require the underlying elevation data or a professional survey at a much finer scale.
Why roads, water, and relief need to be read together
Smith County’s road network makes more sense when the river and relief are considered at the same time. Around Carthage, several roads converge near the Cumberland River and must work with the location of bridges and low corridors. Around Gordonsville, the road pattern is more strongly tied to the southern east-west I-40 corridor. Farther north, the closely spaced ridges and branching creek valleys help explain why routes bend rather than forming a simple rectangular grid.
The existing reference data lists about 314.3 square miles of land and 11.1 square miles of water for Smith County. Water is therefore a minority of the county’s total area, but the area percentage understates its geographic importance. A broad river that cuts across the center of the county can shape crossings, local orientation, and route choice far more than its percentage of total acreage would suggest.
The 2020 census count of 19,904 works out to roughly 63 people per square mile when divided by the listed land area, but that countywide average should not be read as a neighborhood map. The settlement labels cluster around Carthage, South Carthage, and Gordonsville, while large parts of the north and east are dominated visually by hills, narrow valleys, and smaller roads. The maps are more useful when the population figure is treated as background scale and the visible settlement and terrain patterns are used to understand where people and transportation are actually concentrated.
Choosing the Smith County map that fits the question
Use the county map when you need the broadest combination of communities, roads, water, and the county boundary. The city map is quicker when the question is simply how Carthage, South Carthage, and Gordonsville relate to one another. For rivers and tributaries, the water map provides the clearest labels and terrain background. When the main question is why a road or stream follows a particular valley, the elevation map adds the most useful context.
For printed notes, separating purposes often produces a cleaner result than copying every label onto one sheet. A transportation copy might emphasize Carthage, Gordonsville, I-40, 70N, 24, and 25. A physical-geography copy could focus on the Cumberland River, Peyton Creek, Defeated Creek, the low central valley, and the surrounding ridges. This makes the same county easier to study without turning the map into a crowded annotation layer.
Smith County was established in 1799, and Carthage is the county seat in the supplied reference material. That historical administrative role is useful to keep separate from modern transportation geography. For county-government orientation, Carthage is the key label; for understanding interstate access, Gordonsville and the I-40 corridor deserve equal attention. The difference between those two functions is one of the strongest county-specific patterns visible across the map set.
Frequently Asked Questions
How close are Carthage and South Carthage on the map?
They appear very close together along the Cumberland River corridor. The city-connections map uses South Carthage as the hub and shows Carthage at about 1 mile away by direct distance. That is not a driving distance, so an actual trip still depends on the available road and river crossing.
Which waterways stand out most in Smith County?
The Cumberland River is the dominant feature because it makes several broad bends through the middle of the county. Peyton Creek and Defeated Creek are prominent northern tributaries, while Hogan Creek, Snow Creek, Hickman Creek, Brush Creek, and smaller streams drain the hills farther south. The water map is useful for comparing their locations, but it is not a flood or navigation chart.
What does the elevation map reveal about the county?
It shows a low Cumberland River corridor surrounded by higher, closely spaced ridges, especially in the north, northeast, and southeast. The mapped elevation range is about 137 to 380 meters, with a mean near 206 meters. Those values are appropriate for county-scale terrain comparison, not parcel surveying or engineering measurement.
Map File Information
The ZIP contains the high-resolution JPG versions of the Smith County map, city map, water map, and elevation map shown in this article. The four A3-format originals are better suited to printing and enlarged viewing than the WebP previews used in the page body.
- Included Files: County map, city map, water map, and elevation map
- File Type: ZIP containing 4 JPG images
Related Maps
Sources and References
- Tennessee State Library and Archives Smith County fact sheet
- Tennessee Department of Transportation Smith County map
- U.S. Census Bureau Smith County QuickFacts
- USGS National Hydrography
- USGS 3D Elevation Program
Green Map creates custom-edited map images using open geographic data sources such as geoBoundaries, Natural Earth, OpenStreetMap, and government open data. These maps are edited visual materials, not raw data files, and are provided for education, documents, presentations, and graphic reference.