Elbert County is primarily grassland in the 2025 land-cover summary, but the map is more varied than the 84.25% figure suggests. Large farm blocks stand out in the southeast and northeast, while forest and development are concentrated much more strongly along the western side. The contrast between those regions gives the county a clear internal pattern.
This page compares current land cover, forest and farmland, impervious surface, and mapped class differences from 1985 to 2025. Four original JPG maps are packaged together in one ZIP near the end of the page for closer viewing, printing, classroom use, or side-by-side reference.
Table of Contents
Three different landscapes appear inside a mostly grass-covered county
Grassland covers 84.25% of Elbert County, followed by agriculture at 8.08%. Developed cover is 2.76%, forest 2.62%, wetlands 1.41%, and shrubland 0.85%. Water is only 0.01%. These countywide totals are useful, but the real value of the map comes from seeing that the smaller classes are not randomly scattered.
The eastern and central portions are dominated by broad grassland. Agricultural fields interrupt that background in several areas, most clearly in the long southeastern extension of the county and in the northeast. Many of the farm patches have rectangular edges, which makes them easy to distinguish from irregular forest and wetland patterns even when the map is viewed at a reduced size.
The west is different. Forest patches become more frequent near the western boundary and across the southwest, while developed pixels form clusters and thin lines close to the same side of the county. Elbert County’s Transportation Master Plan describes rolling terrain and pine forest in the west, compared with largely flat farmland and grassland in the east. That official description matches the broad west-to-east contrast visible in the land-cover data.
The same transportation plan identifies Elizabeth, Kiowa, and Simla as the county’s three incorporated towns. Elizabeth lies near the western edge, Kiowa farther east in the western part of the county, and Simla in the south. The NLCD maps do not draw municipal boundaries, so a developed patch should not be treated as the exact outline of any town. The names are useful only as geographic reference points.
Land cover also should not be confused with zoning or ownership. A grassland pixel does not identify a ranch parcel, and an agricultural pixel does not show who farms the land. Annual NLCD classifies what covers the surface within raster cells. Legal land use, property boundaries, and development rights come from other sources.
Very low imperviousness highlights where built surfaces are concentrated
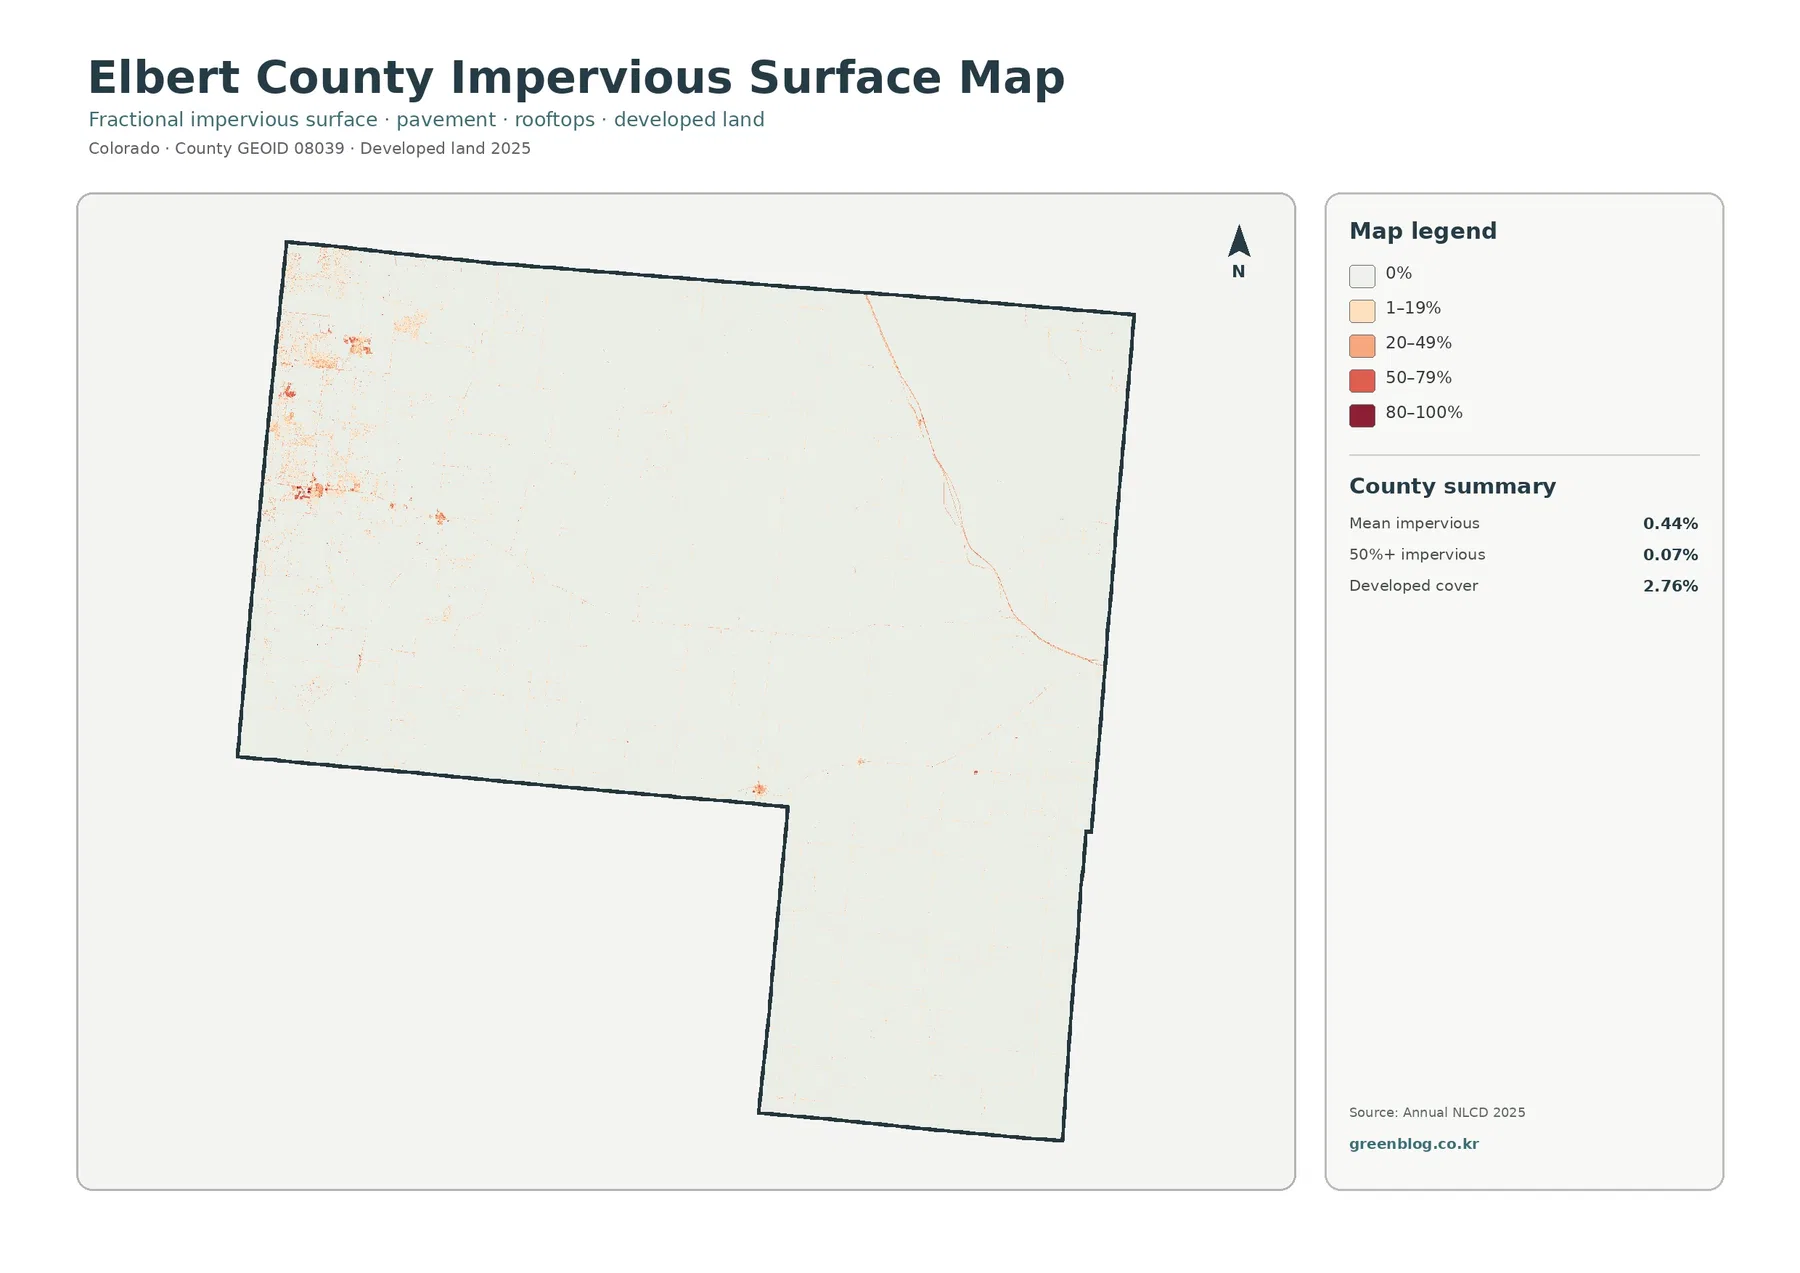
Mean imperviousness is only 0.44% across Elbert County, and cells that are at least 50% impervious make up just 0.07%. The pale appearance of most of the map reflects the county’s large areas of grassland and agriculture. Hard surfaces are present, but they occupy a very small share of the county as a whole.
The strongest orange and red values occur near the western edge, where small built clusters stand apart from the otherwise light background. A thin linear feature also runs diagonally through the eastern half, with a few isolated higher-value spots elsewhere. These features are much easier to see here than on the general land-cover map because most natural surfaces have been removed from the legend.
The 2.76% developed-cover figure is larger than the 0.44% mean imperviousness because the two products measure different things. Land cover assigns a dominant class to a cell. Fractional imperviousness estimates how much of the cell consists of pavement, rooftops, and similar hard surfaces. A developed residential area can still contain large permeable areas.
Elbert County’s 2026 Comprehensive Plan update emphasizes rural character, open space, working farms and ranches, and growth that fits the county. The impervious map does not measure those planning goals directly, but it gives useful physical context: widespread hard-surface coverage is absent from most of the county, while development remains much more localized.
The 2025 land-cover map shows where the 8.08% agricultural share actually sits
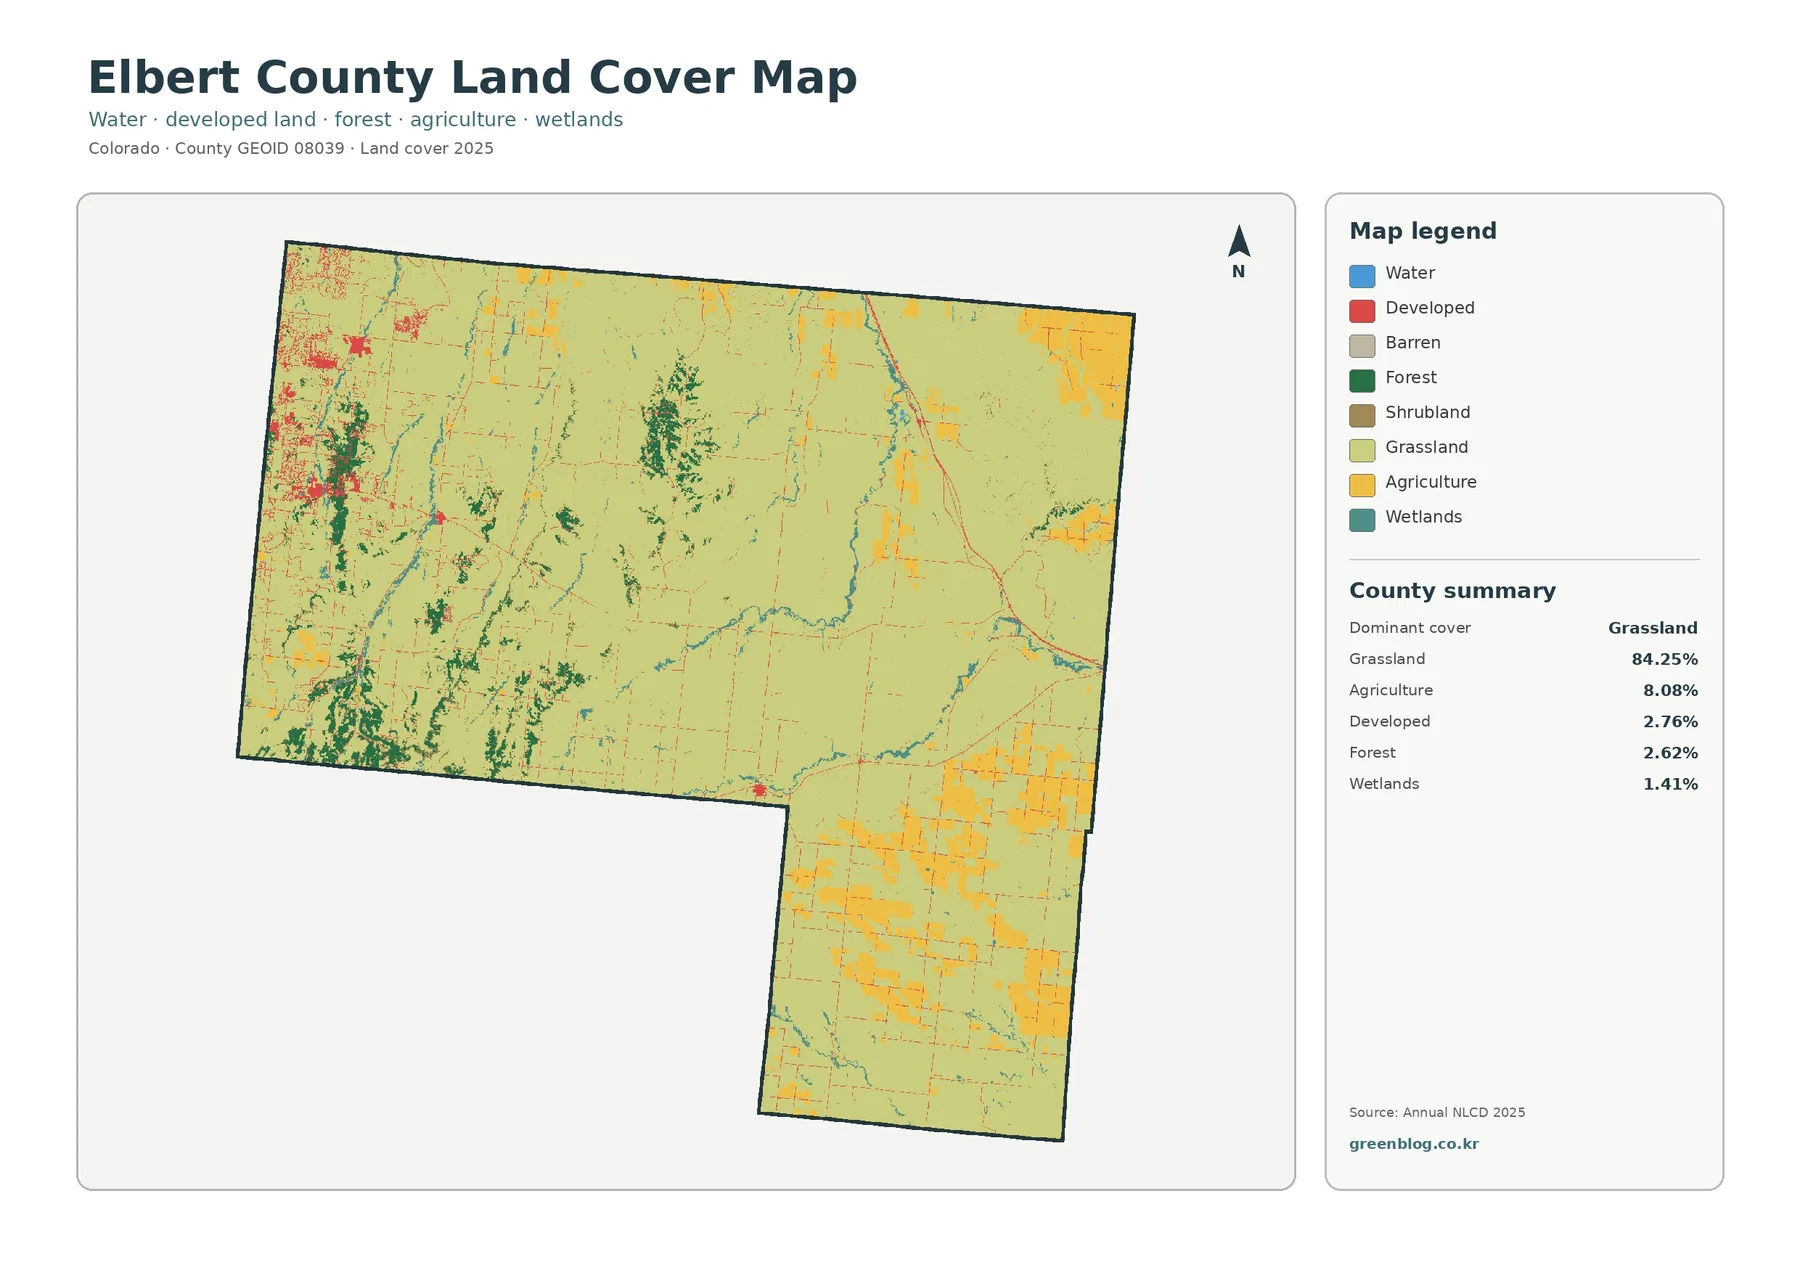
Grassland forms a nearly continuous background across central Elbert County and much of the east. It is broken by field blocks, narrow wetland traces, and fine developed lines, but none of those classes approaches the overall extent of grass cover. The western side contains more interruptions because forest and development occur more often there.
Agriculture is most striking in the southeastern extension. Large yellow blocks occupy broad sections of that area, often separated by narrow strips of grassland. Additional fields occur in the northeast and east-central county. The 8.08% total is modest beside grassland, yet concentration in a few regions makes agriculture a major visual feature.
Forest makes up 2.62%, but its location gives it more importance than the percentage alone might imply. Dark green patches cluster in the southwest and along parts of the western boundary, with additional narrow or scattered forest farther north and east. The pattern agrees with the county transportation plan’s description of pine forest and rolling terrain in western Elbert County.
Developed cover is also concentrated westward. Red areas form compact clusters near the western edge and smaller linear traces elsewhere. Moving east, development becomes much more sparse and the map is dominated again by grassland and agricultural blocks. That difference is one reason countywide developed statistics should not be used as though every region has the same settlement intensity.
Wetlands account for 1.41% and often appear as narrow blue-green lines following drainage patterns. Water is only 0.01%, so large open-water bodies are not a defining feature of this map. Small wetland and water features are easier to inspect in the original JPG than in a compact web preview.
The forest-and-farmland map simplifies the county into a strong west–southeast contrast
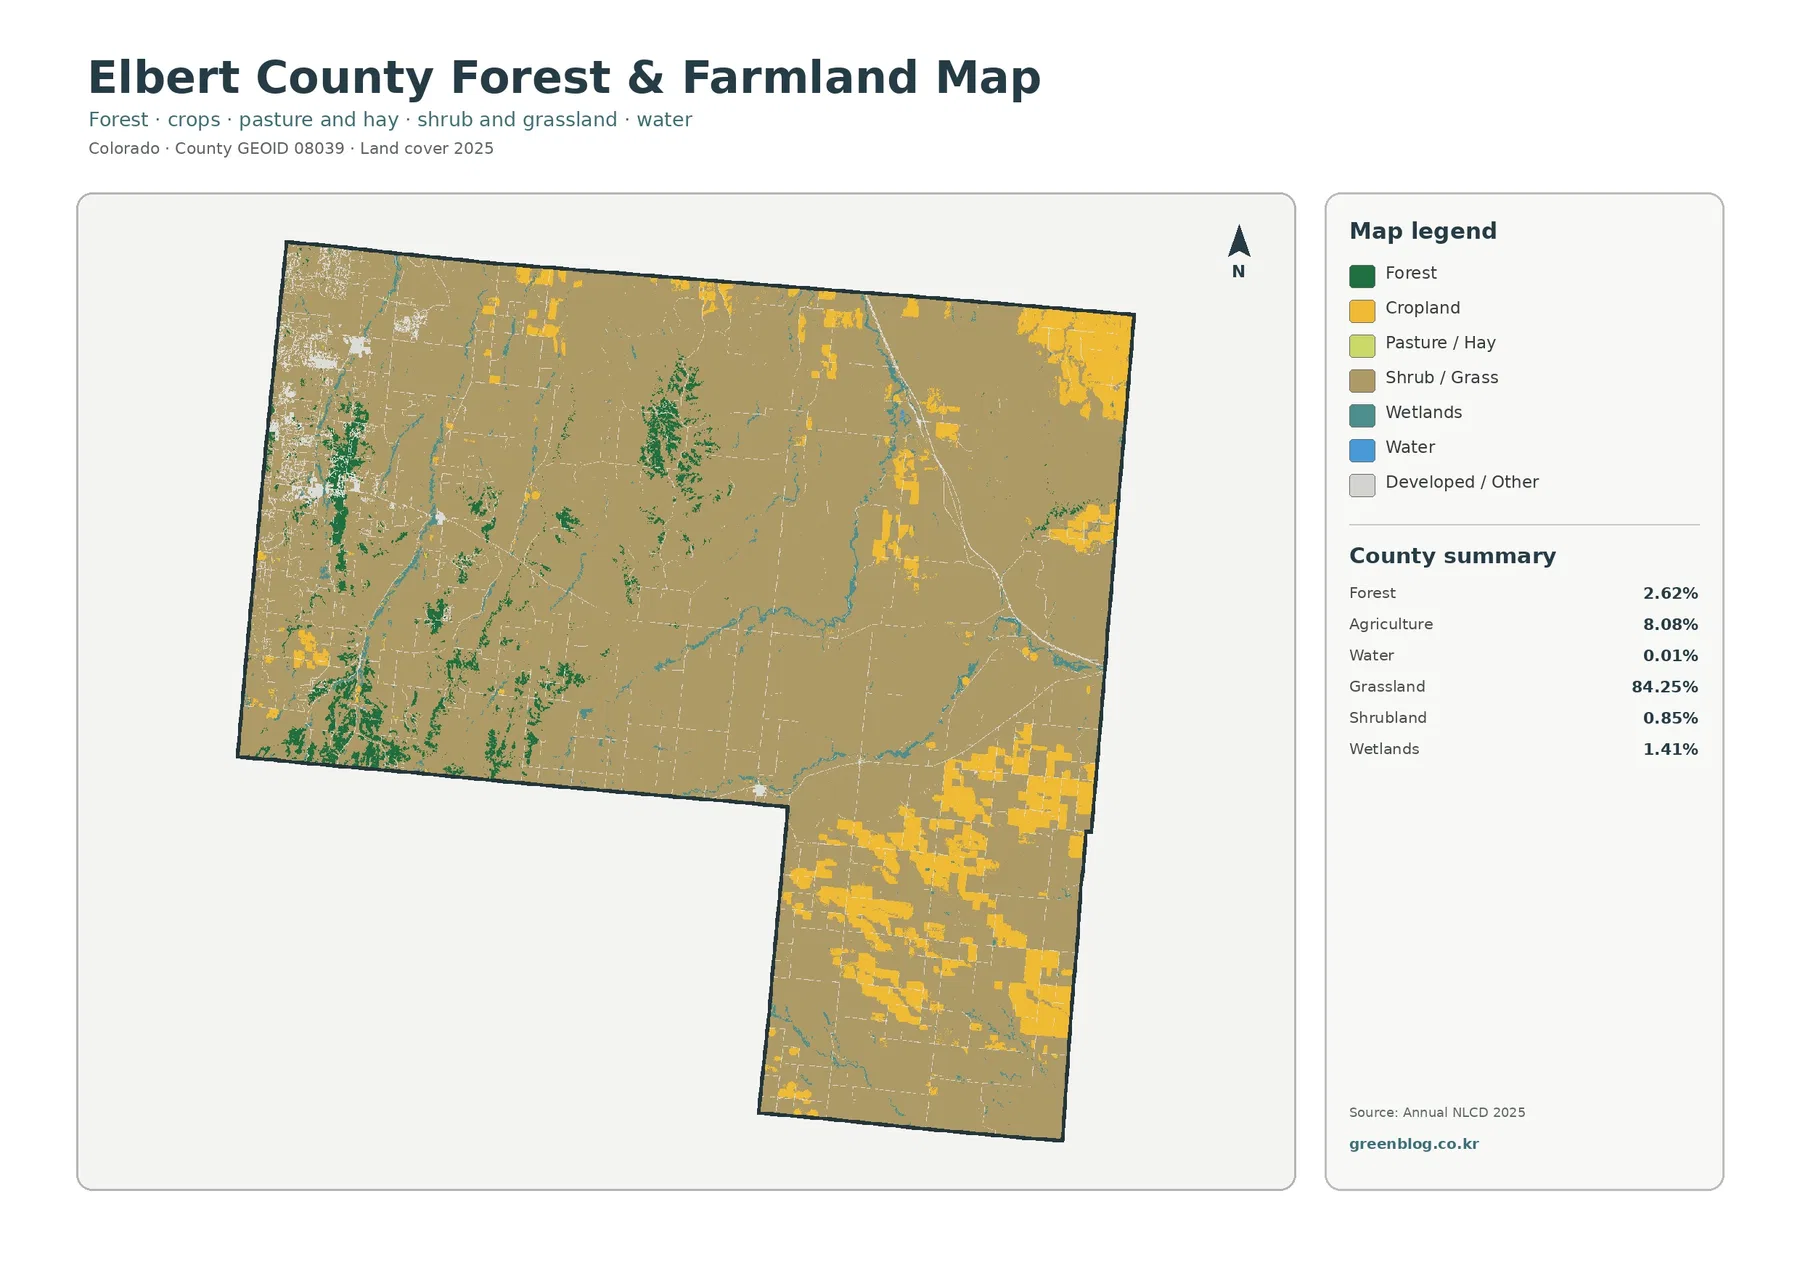
The simplified legend makes the main county pattern even clearer. Shrub and grass cover most of the map, while cropland forms bright blocks in the southeast and northeast. Forest remains concentrated along the western and southwestern portions. These classes occupy different parts of the county rather than blending into one evenly mixed landscape.
The southeastern arm is especially useful for comparing farm blocks with grassland. Cropland appears in repeated rectangular shapes, some of them large enough to dominate local sections of the map. The same area contains only limited forest, so the contrast with the western side is immediate.
Western Elbert County has much less cropland but more forest and developed-or-other cover. The county transportation plan describes Elizabeth as the largest population center in the county and places it near the Douglas County boundary. Kiowa lies several miles farther east. Their location helps explain why the west is the most useful part of the map for comparing settlement patterns with forest and open grassland, although the NLCD layer itself does not map town boundaries.
Farm colors should not be read as cadastral boundaries. A raster classification summarizes the surface within a grid cell and does not show ownership, crop type, irrigation rights, or farm management. Use the map to locate broad agricultural concentrations, then consult agricultural or parcel datasets for site-specific questions.
Agricultural loss dominates the named 1985–2025 change categories
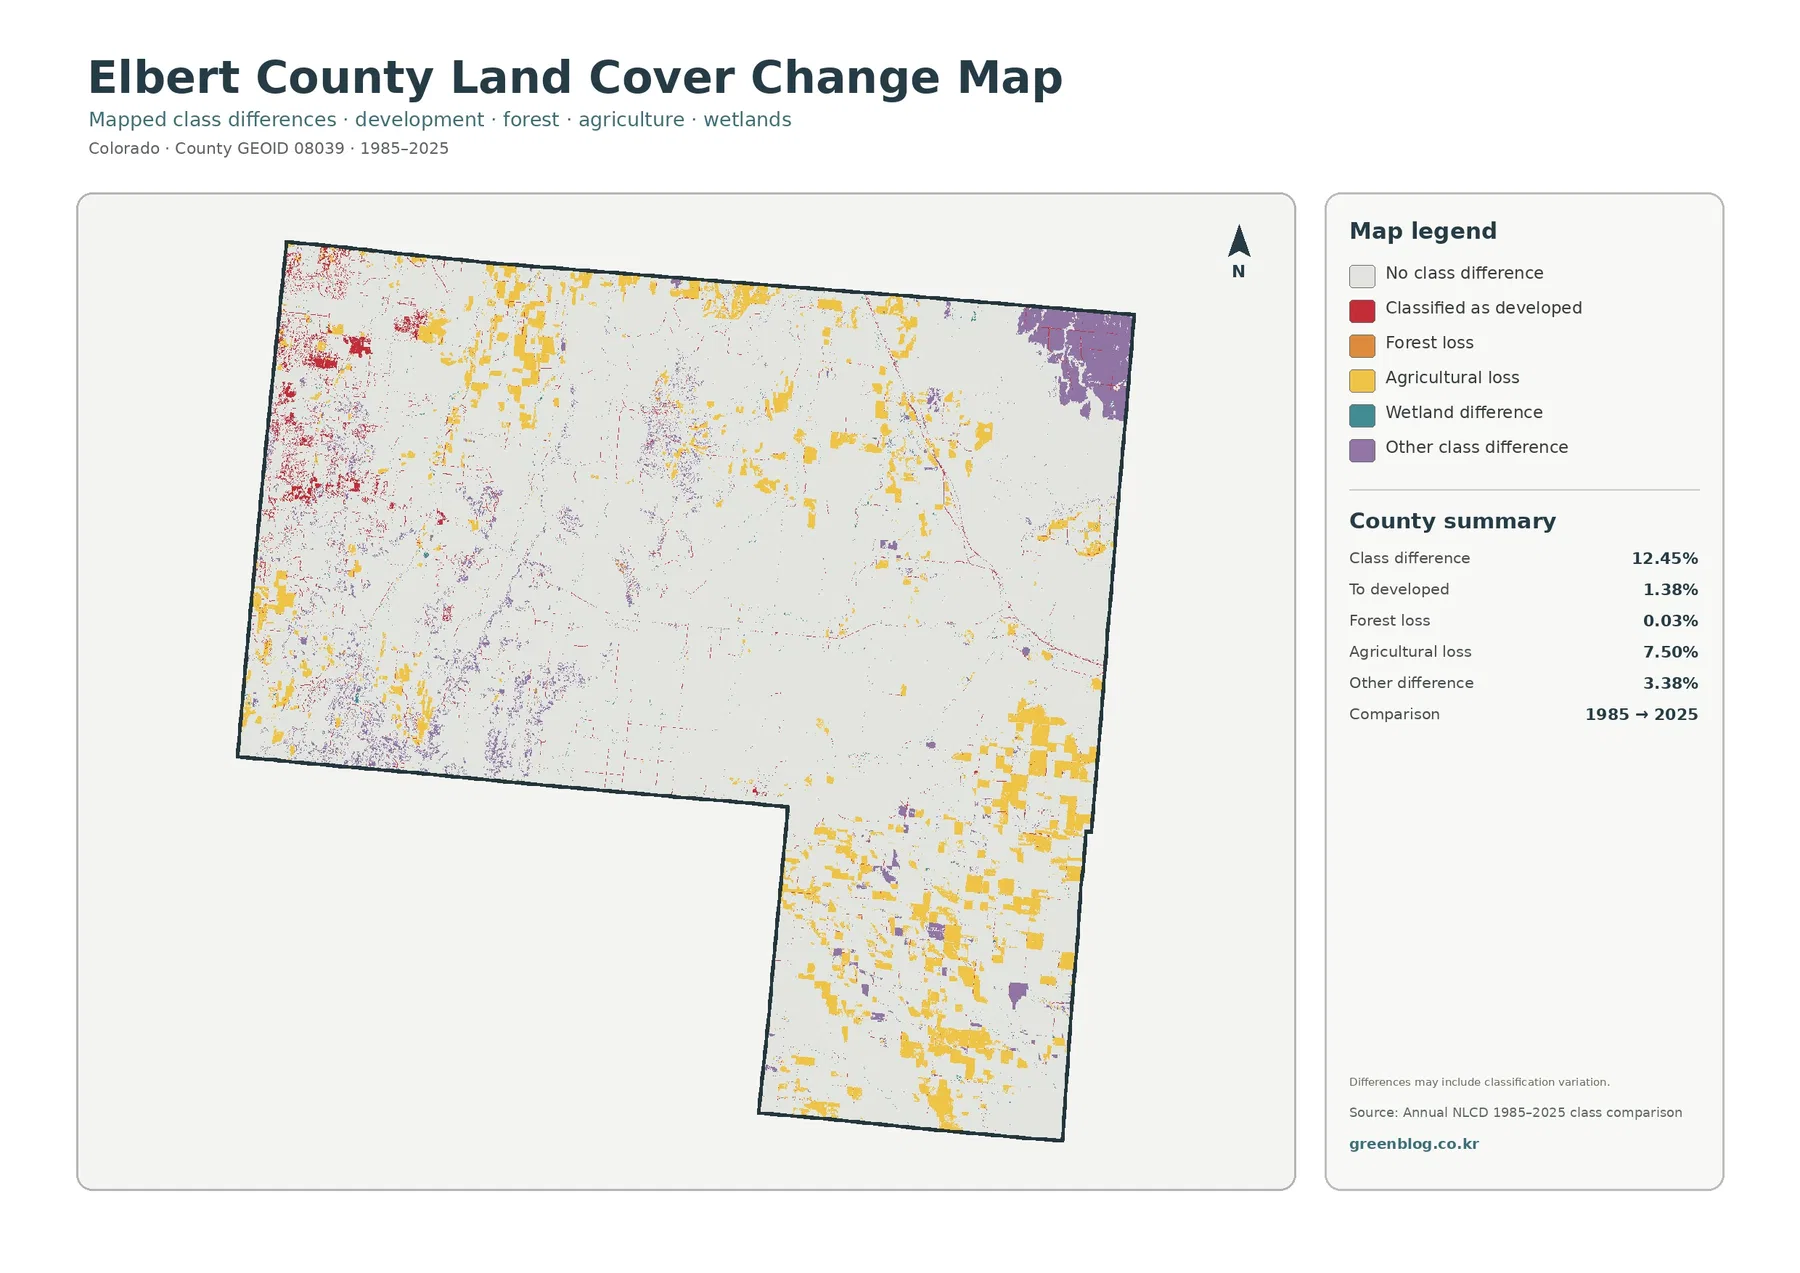
The change summary reports different mapped classes across 12.45% of Elbert County between 1985 and 2025. Agricultural loss accounts for 7.50%, other class difference for 3.38%, conversion to developed for 1.38%, and forest loss for only 0.03%. The unusually large agricultural-loss share makes this map different from counties where development or forest change is the leading named category.
Yellow agricultural-loss areas are widespread in the north and northeast and appear extensively through the southeastern farm region. Some blocks are large and rectangular, while others are smaller and more fragmented. Current agricultural cover is 8.08%, but that value should not be subtracted from the 7.50% change category. One describes 2025 cover; the other summarizes a type of two-date classification difference.
Red conversion-to-developed areas are concentrated mainly in the west and northwest. This resembles the location of current developed cover, though the two layers are not identical. A county health-planning document notes recent development especially in western and northwestern Elbert County around Elizabeth and near the Douglas County border. That local context supports using the western side as the main reference area when comparing current development with long-term class change.
A large purple other-difference area appears in the far northeast, with smaller purple clusters elsewhere. “Other difference” does not identify a single physical process. The map notes that class differences can include classification variation, so isolated pixels should not be treated as confirmed ground change without another source.
Forest loss is only 0.03% in this change summary. That does not mean every forested acre remained unchanged. It means very little of the county falls into this particular mapped forest-loss category between the two selected years. Detailed forest condition or disturbance history would require more specialized data.
Using Elizabeth, Kiowa, and Simla as reference points
Elizabeth is a useful western reference because it sits close to the Douglas County line, where current developed and impervious pixels are most concentrated. Looking east from that side, the amount of forest gradually decreases and large grassland areas become more dominant. The change map also places many red development-transition pixels in the same general western zone.
Kiowa provides a second reference farther east. The landscape around that part of the county is still predominantly open, and development is less visually dominant than near the western edge. From there toward the eastern county, agriculture becomes a more important secondary class within the grassland background.
Simla lies in the southern part of Elbert County near the long southeastern section. That area contains some of the map’s most extensive current cropland and many agricultural-loss pixels on the change layer. Comparing the two maps side by side is more useful than relying on either percentage alone because it separates current agricultural cover from two-date class differences.
These town names are orientation tools, not labels embedded in the supplied land-cover images. If an exact municipal boundary or road location is needed, use the county’s transportation or planning maps alongside the NLCD layer. That keeps the surface classification and the administrative geography from being mixed together.
What 30-meter cells can and cannot show
Annual NLCD is raster data built from 30-meter cells. Each cell summarizes a small square of land, even when that square contains a mixture of grass, soil, trees, pavement, buildings, or water. The land-cover product assigns a representative class, while the impervious product estimates the share of hard surface within the cell.
This matters for Elbert County because several mapped classes are small. Water is only 0.01%, highly impervious cells cover 0.07%, and forest is concentrated into limited western areas. Thin features can appear differently depending on zoom level, and a raster edge should not be treated as a surveyed property or wetland boundary.
The change layer requires similar care. A cell that has a different class in 1985 and 2025 may reflect real land-cover change, but classification variability can also contribute. The map is useful for locating where differences are concentrated; it does not by itself explain why an agricultural or developed class changed.
The current land-cover and impervious maps represent 2025. Construction, agricultural changes, vegetation shifts, or restoration after that year may not appear. For present-day site questions, treat these maps as a broad baseline and confirm conditions with newer local data.
Choosing the most useful map for your question
Use the general land-cover map first for a countywide overview. It combines the 84.25% grassland background with southeastern agriculture, western forest, localized development, wetlands, and small water features. This is the easiest map for understanding the county before moving into a more specialized comparison.
The forest-and-farmland map is better when agriculture is the main subject. Fewer legend categories make the southeastern and northeastern field blocks easy to compare with western forest and open grassland. If built surfaces are the question, the impervious map is more informative because it shows intensity rather than simply labeling cells as developed.
Choose the change map when time is part of the question, especially for agricultural differences or western development. Keep the 2025 map beside it so viewers do not mistake agricultural loss for current cropland or conversion to developed for the full current developed footprint.
For classroom or presentation use, a west-versus-southeast comparison works especially well. The western side highlights forest and settlement, while the southeastern section emphasizes grassland and cropland. Showing those two areas at the same scale makes Elbert County’s internal contrast easier to understand than a generic description of the county as rural.
Download the four Elbert County JPG maps
The downloadable ZIP contains four original JPG files: the general land-cover map, forest-and-farmland map, impervious/developed-land map, and 1985–2025 land-cover change map. The WebP images in the article are intended for quick web viewing, while the JPG files can be opened separately for closer inspection.
Keep each map’s title, year, and legend when reusing the images. Current agriculture and agricultural loss are different measurements, as are developed cover and imperviousness. Clear labeling is especially important in Elbert County because the agriculture and change percentages are both large enough to be confused if the map context is removed.
The set is useful for printing, classroom material, presentation graphics, county-scale land-cover comparison, and general environmental reference. It does not replace property records, zoning maps, farm parcel data, surveyed wetland boundaries, or engineering plans. Those questions should be checked against the appropriate current official source.
Frequently Asked Questions
Where is agriculture most visible in Elbert County if grassland covers 84.25%?
The largest agricultural blocks are in the southeastern extension, with additional groups in the northeast and east-central county. Agriculture covers 8.08% overall, but its concentration in large rectangular patches makes it visually prominent in those areas.
Why is mean imperviousness only 0.44% when developed cover is 2.76%?
Developed cover is a categorical land-cover class, while imperviousness measures the fraction of hard surface inside each cell. Developed areas can contain grass, soil, trees, and other permeable surfaces, so the two percentages are expected to differ.
Does 7.50% agricultural loss mean only 0.58% agriculture remained by 2025?
No. The 7.50% figure is a change category from the 1985–2025 comparison, while 8.08% is the current 2025 agricultural-cover share. They are different measurements and cannot be subtracted to reconstruct a past agricultural total.
Map File Information
The download ZIP contains four original Elbert County land-cover JPG maps.
- Included Files: Use only the versions confirmed in the article and supplied images
- File Type: Use the confirmed download contents
- Intended Use: Printing, education, presentations, and map-based projects
Related Maps
- Adams County Colorado Land Cover Map
- Alamosa County Colorado Land Cover Map
- Arapahoe County Colorado Land Cover Map
Sources and References
- MRLC Annual NLCD Data – official access point for Annual NLCD products and data.
- USGS Annual NLCD Land Cover Classification – official documentation for interpreting Annual NLCD land-cover classes.
- Elbert County Transportation Master Plan – official county context for western pine forest and rolling terrain, eastern farmland and grassland, and the locations of Elizabeth, Kiowa, and Simla.
- Elbert County Comprehensive Plan Update – 2026 county update describing rural character, open space, working farms and ranches, and growth priorities.
- U.S. Census Bureau TIGER/Line Shapefiles – official geographic boundary reference.
Green Map creates custom-edited map images using open geographic data sources such as geoBoundaries, Natural Earth, OpenStreetMap, and government open data.
These maps are edited visual materials, not raw data files, and are provided for education, documents, presentations, and graphic reference.