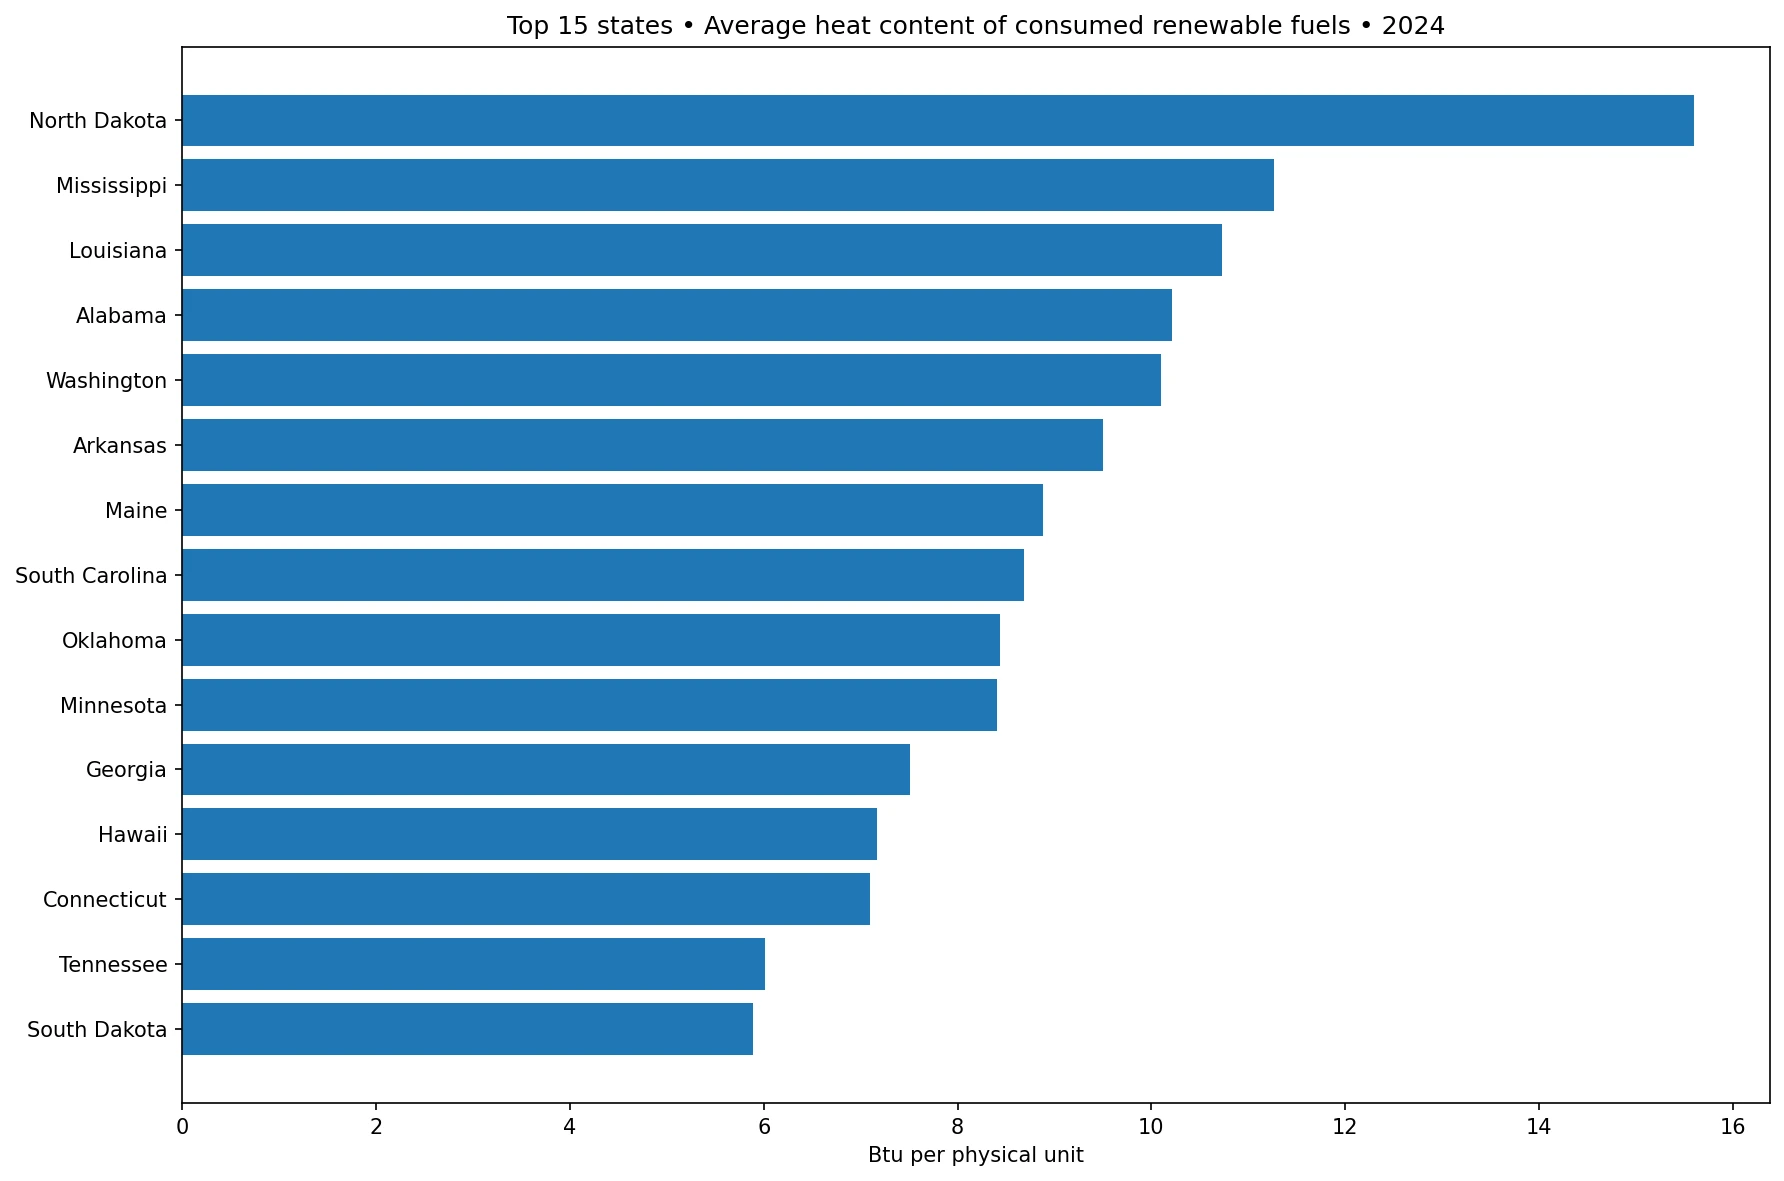
The average heat content of consumed renewable fuels varies widely across U.S. states in 2024. In the U.S. Energy Information Administration’s Electric Power Operations data, the `heat-content` field with fueltypeid=REN and sectorid=99 provides 51 official observations covering all 50 states and the District of Columbia. North Dakota has the highest reported value at 15.6000, followed by Mississippi at 11.2676, Louisiana at 10.7308, Alabama at 10.2112, and Washington at 10.1017. The median is 3.0231 and the simple state average is 4.1284.
This is not a renewable-energy consumption total. Heat content is an energy-per-physical-unit measure describing how much heat energy is associated with a specified physical unit of an energy source. That distinction matters because adding state heat-content values does not produce a meaningful national total. The indicator is best used to compare the distribution of reported average values across states under the same EIA field, fuel category, sector, and year.
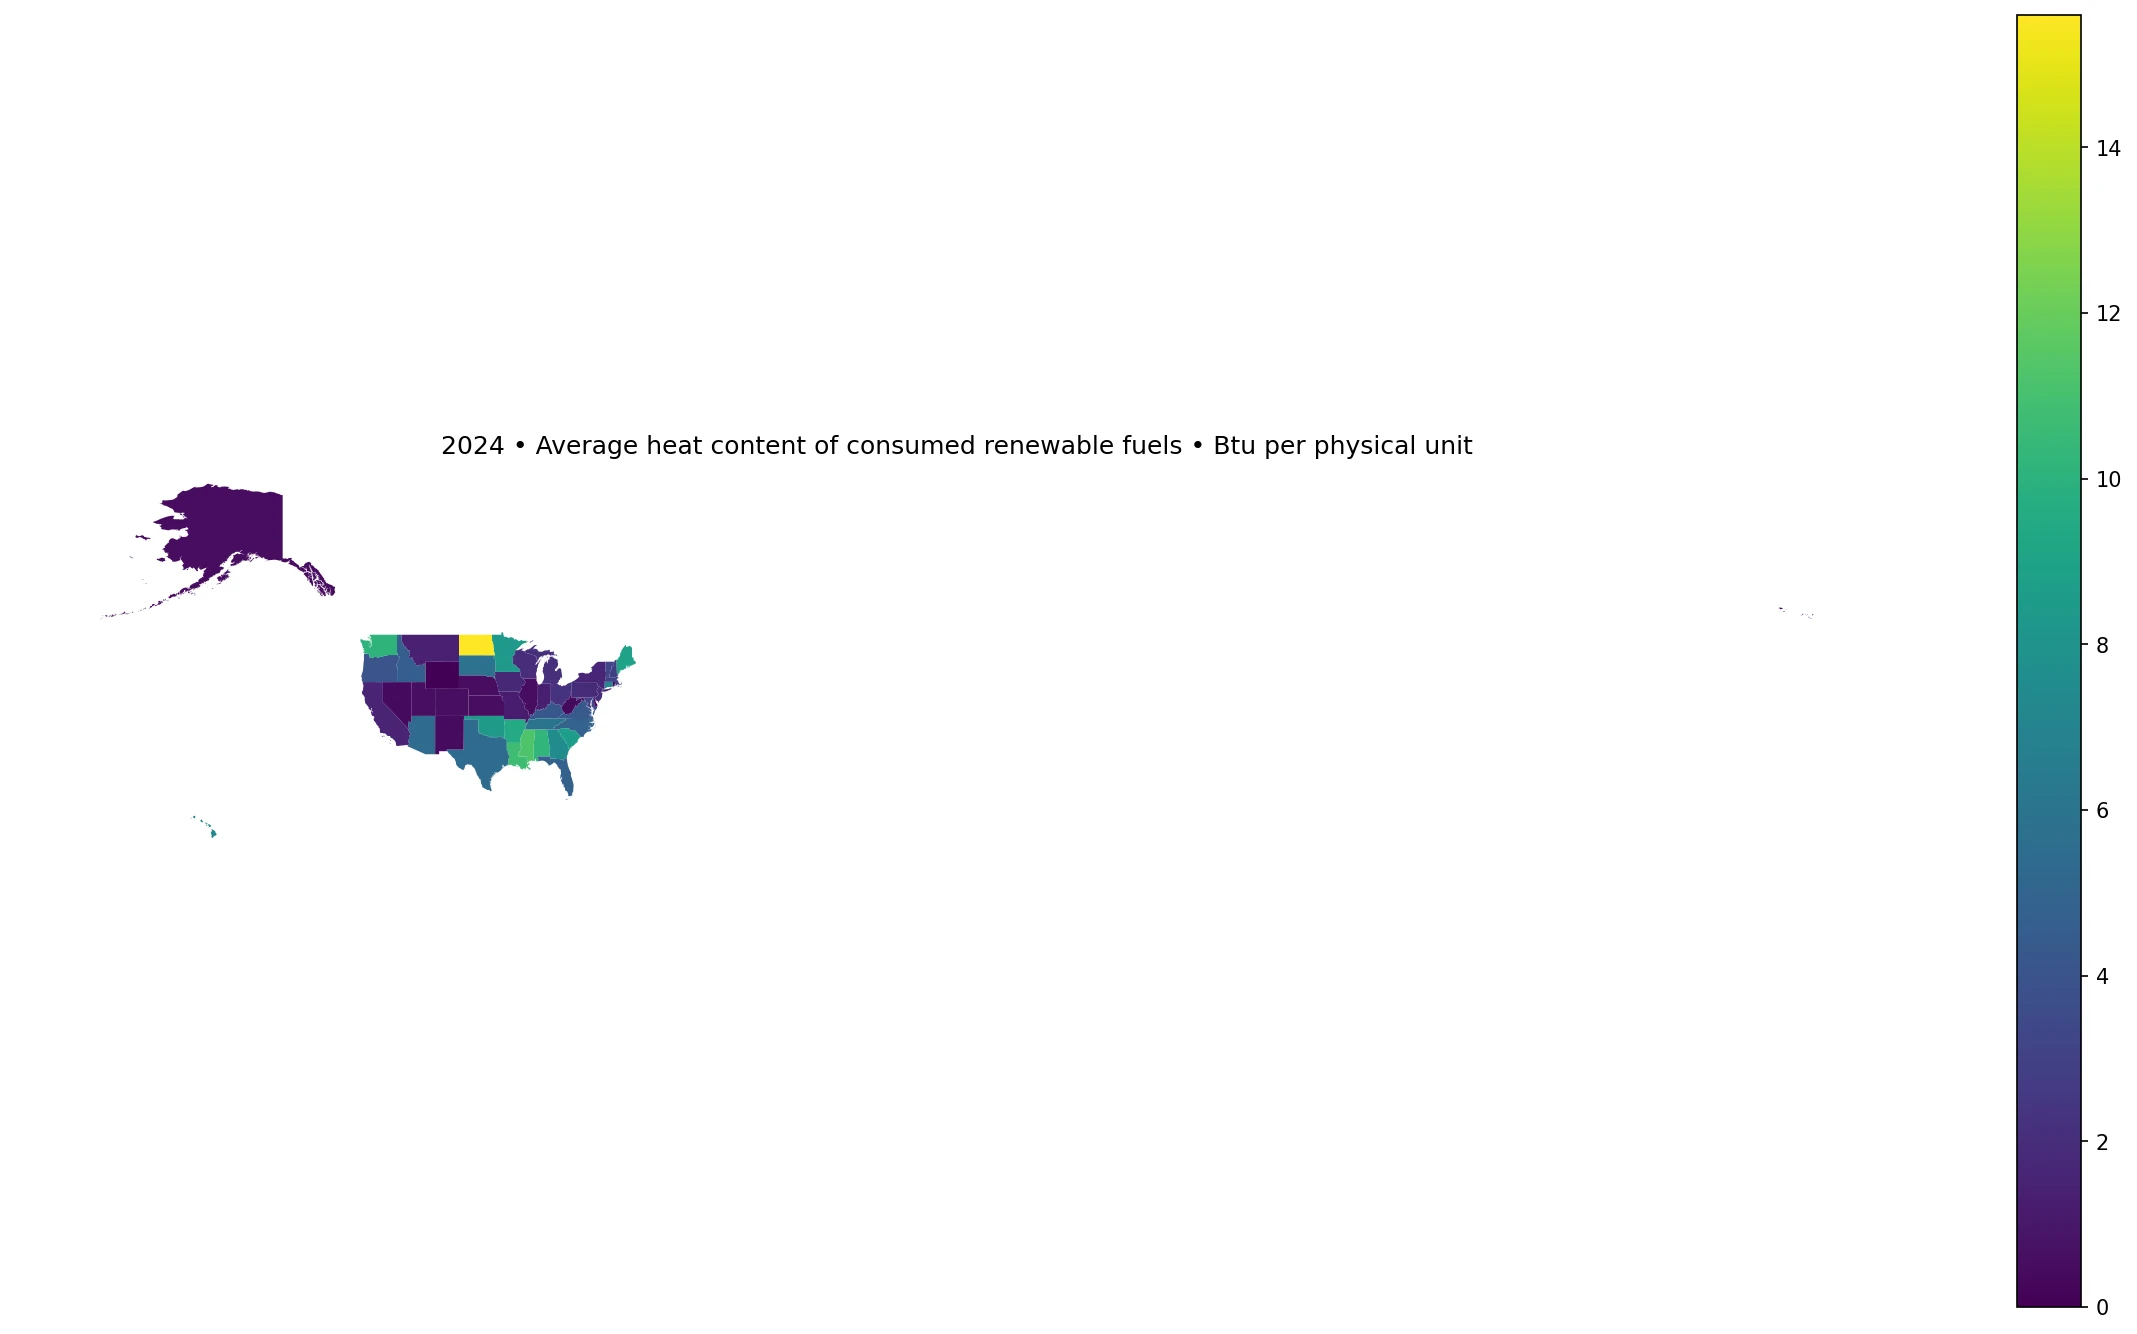
Table of Contents
The median is 3.0231 and the simple state average is 4.1284
The first quartile is 0.9249 and the third quartile is 6.5553, so the middle half of the 51 observations lies between roughly 0.92 and 6.56. The maximum of 15.6000 is more than five times the median. The gap between the mean and median shows that the upper tail has a noticeable effect on the arithmetic average.
Five states report values of at least 10, and 17 are at or above 5. At the other end, 13 jurisdictions are below 1 and six are below 0.5. These thresholds are useful for describing the distribution, but they are not measures of renewable deployment, generation share, or policy performance.
The ten highest state observations
| State | 2024 average heat content |
|---|---|
| North Dakota | 15.6000 |
| Mississippi | 11.2676 |
| Louisiana | 10.7308 |
| Alabama | 10.2112 |
| Washington | 10.1017 |
| Arkansas | 9.5009 |
| Maine | 8.8797 |
| South Carolina | 8.6875 |
| Oklahoma | 8.4407 |
| Minnesota | 8.4081 |
North Dakota leads at 15.6000, with Mississippi second at 11.2676. Louisiana, Alabama, and Washington also exceed 10. Arkansas records 9.5009, Maine 8.8797, South Carolina 8.6875, Oklahoma 8.4407, and Minnesota 8.4081.
The leading states are spread across several regions, so the ranking is not a simple regional pattern. The most likely interpretation is that the reported aggregate reflects differences in the renewable energy sources actually consumed and in the physical-unit composition of those sources. The REN category itself does not identify which renewable source dominates each state’s value.
Thirteen jurisdictions are below 1
| State or jurisdiction | 2024 average heat content |
|---|---|
| Wyoming | 0.0000 |
| West Virginia | 0.3780 |
| Nevada | 0.4160 |
| New Mexico | 0.4713 |
| Delaware | 0.4803 |
| Rhode Island | 0.4936 |
| Nebraska | 0.5246 |
| Illinois | 0.5361 |
| Kansas | 0.5386 |
| Alaska | 0.5389 |
Wyoming has an official value of 0.0000. West Virginia is at 0.3780, Nevada at 0.4160, New Mexico at 0.4713, Delaware at 0.4803, and Rhode Island at 0.4936. Nebraska, Illinois, Kansas, and Alaska are also clustered around 0.52 to 0.54.
Wyoming’s zero is a published numeric observation, not a missing value that has been replaced with zero. It should not be interpreted as proof that Wyoming had no renewable activity. The series is a specific average heat-content measure, and renewable generation, capacity, consumption volume, and final energy use are separate statistics.
Why state values should not be summed
A consumption series measured in MMBtu can often be summed across states. An average heat-content series cannot be treated the same way. Each state value is already a per-unit average. Adding 51 averages together creates a number with no useful national interpretation unless the underlying physical quantities and proper weights are also included.
For that reason, this article uses medians, quartiles, rankings, and counts rather than a state-value sum. The mean of 4.1284 is only an unweighted descriptive average of the 51 state observations; it is not an EIA national weighted heat-content figure.
Renewable aggregates require more caution than a single-fuel heat content
Renewable energy is not one homogeneous fuel. It can include combustible biomass as well as noncombustible sources such as hydro, wind, and solar. EIA energy statistics convert different physical measures into common energy units using source-specific methods. An aggregate renewable heat-content value therefore does not behave like the heat content of one standard fuel such as natural gas or a single petroleum product.
To understand why one state reports a high or low REN heat-content value, the next step would be to examine source-level data for biomass, wood, waste, hydro, wind, solar, geothermal, and any other renewable components included in the relevant reporting structure. The aggregate alone cannot identify the cause.
Average heat content is not renewable generation share
A higher heat-content value does not mean a state gets a larger percentage of its electricity from renewables. Renewable generation share uses electricity output as the numerator and total generation as the denominator. The heat-content field instead describes an energy-per-unit characteristic of the consumed renewable category.
A state can therefore rank high in renewable generation but not in average heat content, or vice versa. The two measures answer different questions. Evaluating renewable deployment requires generation, capacity, consumption, and share metrics in addition to heat content.
What Btu per physical unit means
EIA defines heat content as the amount of heat energy available from the use or transformation of a specified physical unit of an energy form. Different energy sources use different physical units, such as tons, barrels, cubic feet, or kilowatthours. Btu provides a common energy language across those units.
The metadata for this series report the unit as Btu per physical unit. Because REN is an aggregate category, the underlying physical unit context can vary with source composition. This is another reason to compare states within the same series rather than treating the number as a universal heat-value coefficient that can be compared directly with every other fuel category.
Sector scope changes the meaning of otherwise similar series
This dataset uses sectorid=99. Other EIA articles can use the same `heat-content` field and REN fuel category with a different sector, such as Electric Power or a specific producer class. Changing the sector changes the facilities included and can materially change state values.
A related 2024 renewable heat-content article for Electric Power is therefore not identical to this series even though the year and fuel label may look similar. A valid one-to-one comparison requires matching field, fueltypeid, sectorid, geography, frequency, and year.
One year cannot establish a trend
These observations describe 2024 only. They do not show whether North Dakota has consistently had the highest value or whether a state’s heat-content measure is rising or falling over time. Changes in renewable source mix and reporting composition can alter the state average from one year to the next.
Trend analysis should use the same API route and exact facet combination for every year. Mixing sectors or renewable subcategories can create apparent changes that are actually definition changes rather than time trends.
How the map and chart should be read
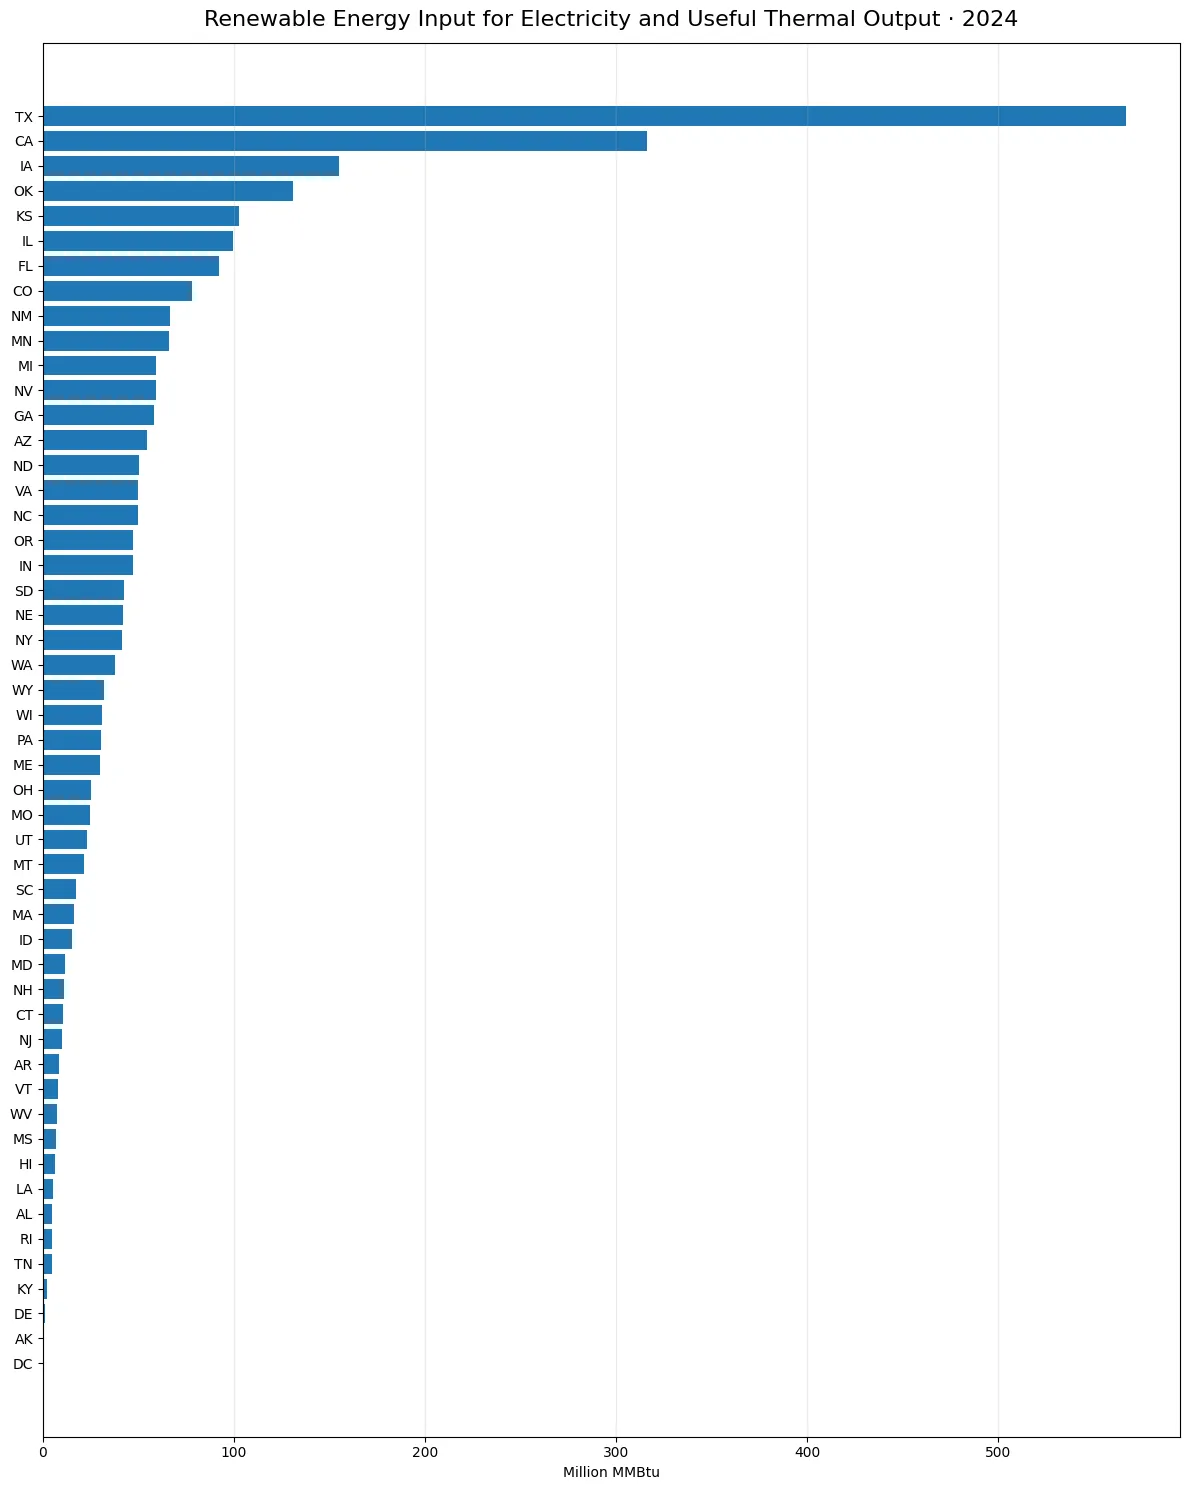
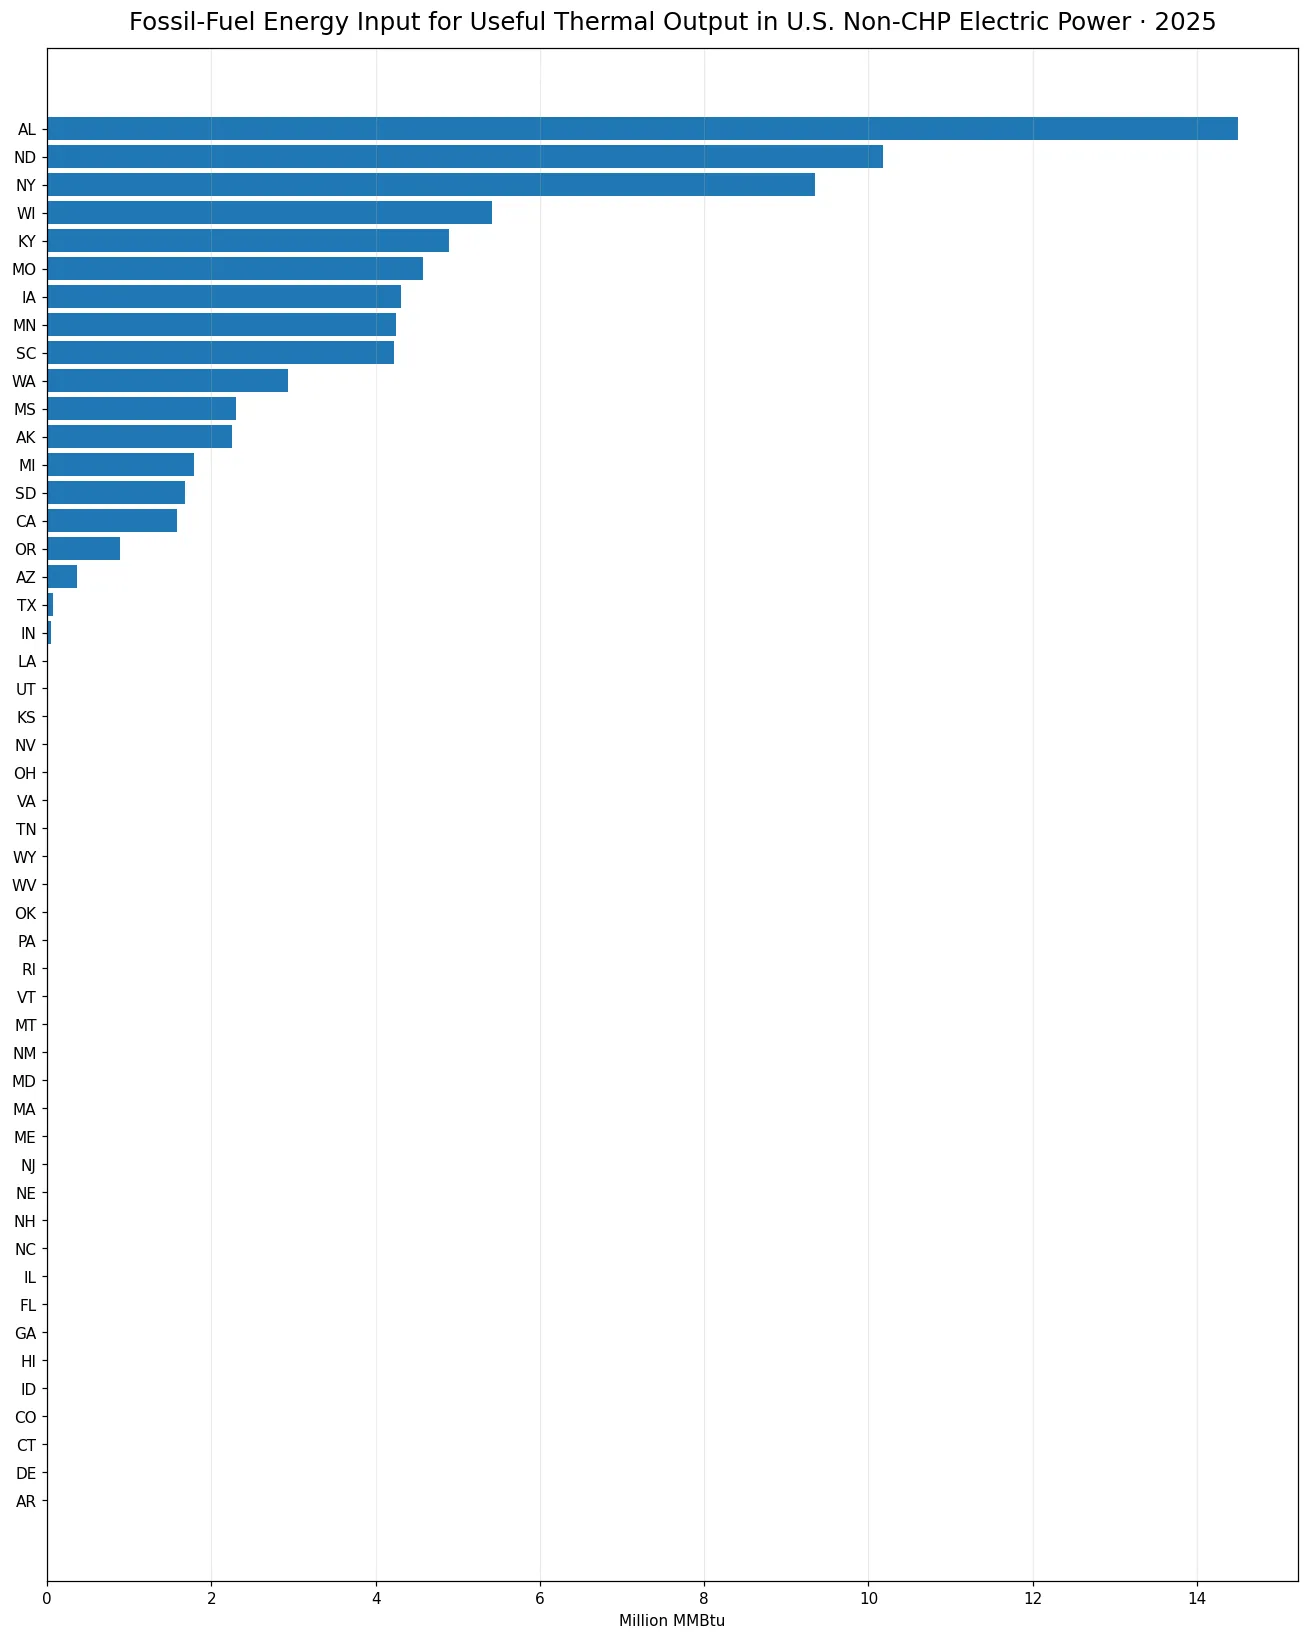
The map is useful for locating high and low observations geographically, while the ranking table preserves exact values. The bar chart highlights the distance between North Dakota and the group around 8 to 11. These visuals describe the distribution; they do not score states on renewable performance.
The median and quartiles are especially helpful because this is an average-value series. A state around 3 sits near the middle of the observed distribution, while a value above 6.56 is roughly in the top quarter. That framing is more meaningful than summing the state numbers.
Data source and calculation method
The source is the U.S. Energy Information Administration’s Electric Power Operations (Annual and Monthly) API. The query uses annual 2024 data, field `heat-content`, fueltypeid=REN, and sectorid=99. The source metadata define the unit as Btu per physical unit and provide 51 official state-level observations.
The mean, median, quartiles, rankings, and threshold counts are calculated directly from the 51 observations. No missing value was converted to zero, and Wyoming’s published zero is retained as an official numeric value. All 51 state codes matched successfully to U.S. state boundaries for the map.
Frequently Asked Questions
Does a higher average heat-content value mean more renewable electricity generation?
No. The metric is an energy-per-physical-unit measure for consumed renewable sources. Generation and renewable share are separate variables.
Can the 51 state values be added to calculate a U.S. total?
No. These are average per-unit values. A meaningful national average would require the underlying quantities and appropriate weighting.
Is Wyoming’s zero a missing value?
No. It is an official numeric observation in the EIA source data. Missing values were not converted to zero.
Related Articles
Green Map creates custom-edited map images using open geographic data sources such as geoBoundaries, Natural Earth, OpenStreetMap, and government open data. These maps are edited visual materials, not raw data files, and are provided for education, documents, presentations, and graphic reference.