Macomb County stretches north from the Detroit-area suburbs to a much more open rural landscape, while its eastern edge meets Lake St. Clair and Anchor Bay. On the supplied maps, Warren and Sterling Heights form the largest concentration of cities in the south, Mount Clemens sits farther east near the Clinton River and I-94, and smaller places such as Romeo, Richmond, and New Haven are spaced farther apart to the north and northeast. The four maps on this page show those settlement differences together with major roads, named waterways, and county-scale elevation. High-resolution JPG originals of all four map layers are available in the download box below for printing or closer inspection.
Macomb County’s official profile describes the same north-south contrast visible on the maps: dense urban clusters in the south, rural villages and agricultural land farther north, and roughly 32 miles of Lake St. Clair shoreline along the eastern side. That makes Macomb County especially useful for comparing several kinds of geography within one boundary. A reader can begin with the continuous southern city belt, move northeast toward Mount Clemens and the Clinton River, then follow the tributaries into the quieter northern half before comparing the low lakeshore with the much higher ground near the northwest corner.
Table of Contents
Warren and Sterling Heights anchor a dense southern city belt that bends toward Mount Clemens
The general county map immediately separates southern Macomb County from the northern half. Warren occupies a broad area near the southwest corner, with Sterling Heights directly to the north and east. Roseville and Eastpointe fill part of the southeast, while St. Clair Shores follows the Lake St. Clair side of the urban belt. Mount Clemens appears farther northeast, close to the Clinton River and the I-94 corridor, and Macomb County’s government administration is based there. North of this continuous urban area, Romeo, Richmond, and New Haven stand apart from one another with noticeably more open space between their developed footprints.
The road pattern reinforces that contrast. M-53 runs north-south through the western side of the county and provides an easy reference for Sterling Heights and the northwest. M-59 crosses east-west through the central urban area toward Mount Clemens, while I-94 climbs northeast through the southeastern part of the county. M-3 and M-97 form additional north-south references within the developed south. Farther north and east, M-19 approaches Richmond and the road network becomes less tightly spaced. The map therefore shows more than a list of highways: the changing distance between major routes mirrors the shift from a dense metropolitan landscape to a more rural northern county.
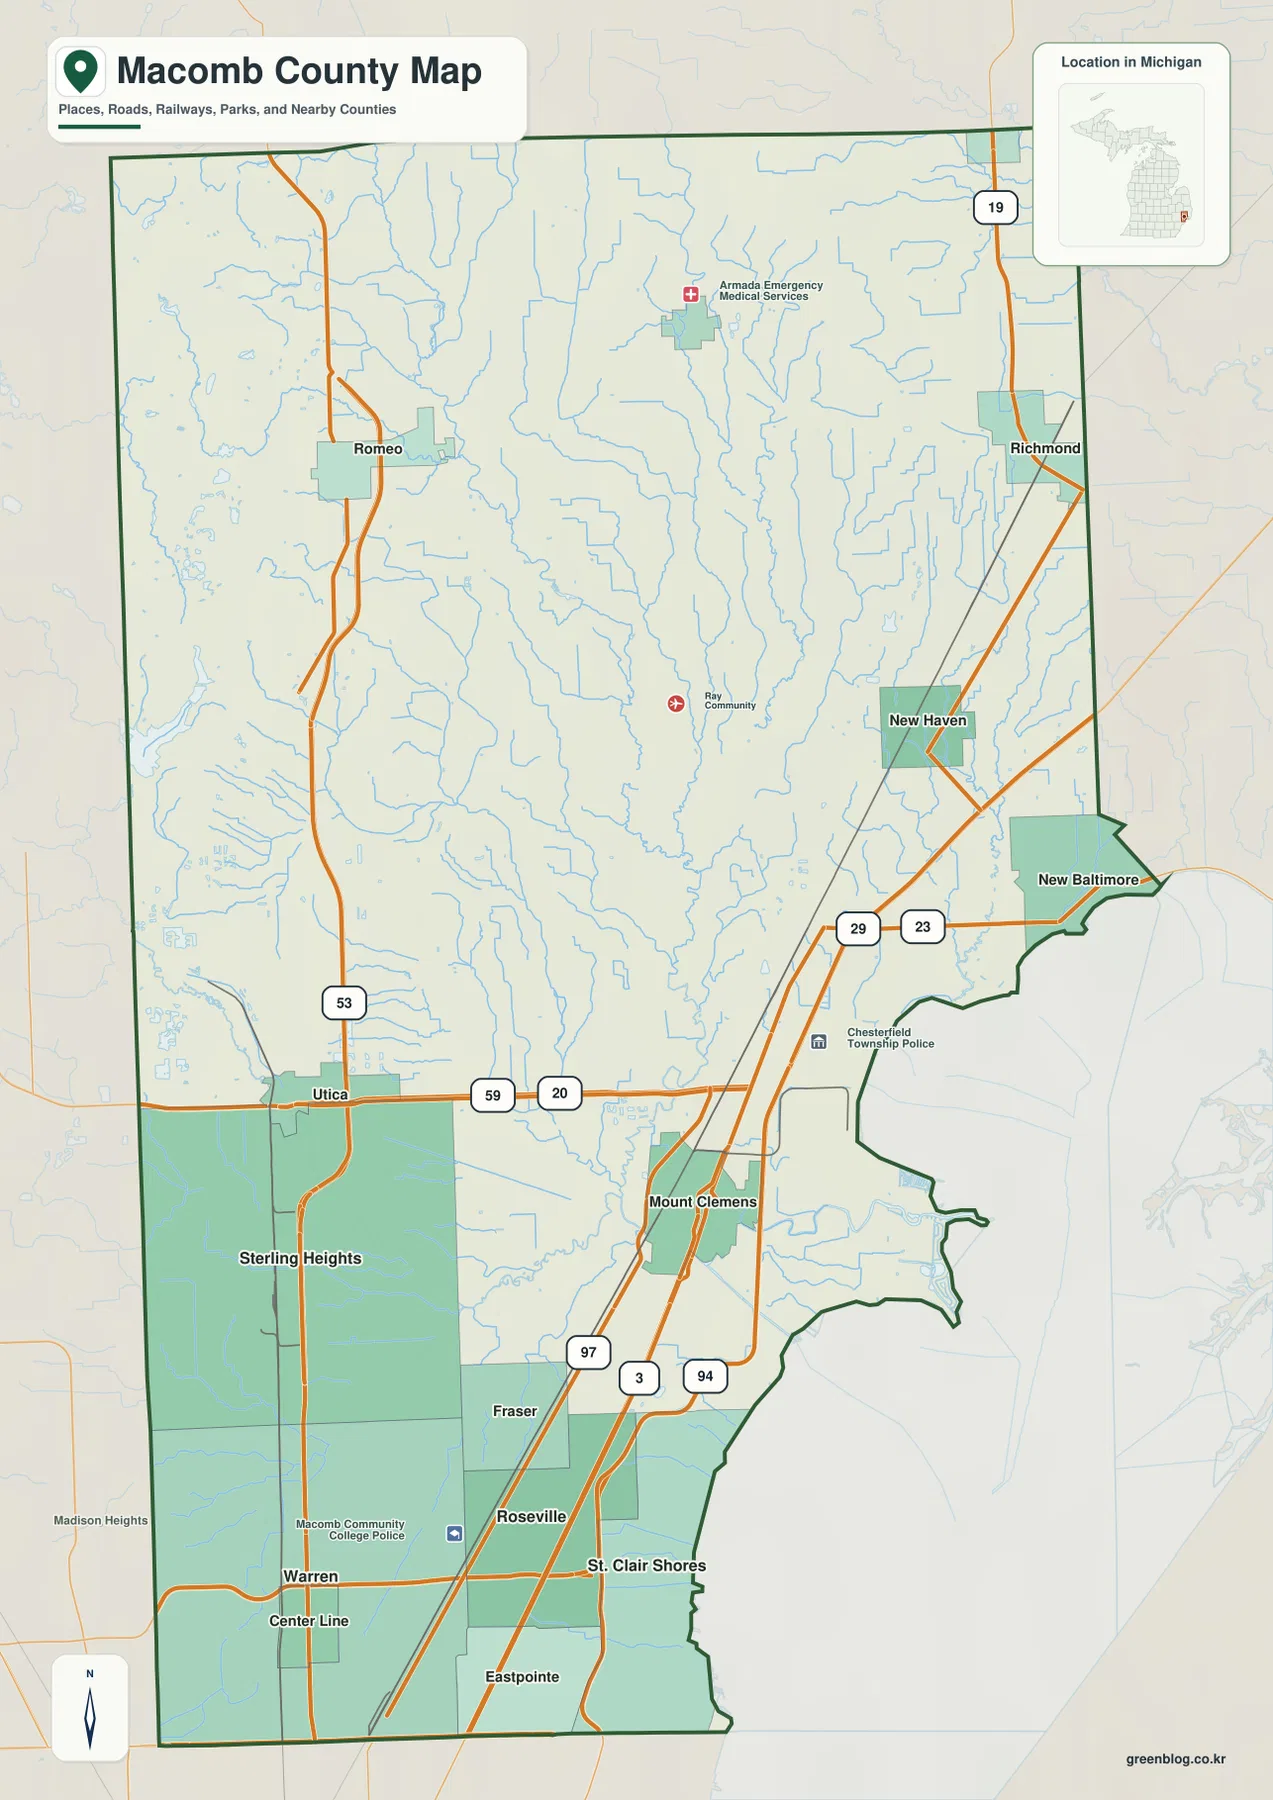
The county boundary adds another layer of context. Oakland County lies to the west, Lapeer County to the northwest, St. Clair County to the northeast, and Wayne County borders the south. Much of the eastern edge is defined by Lake St. Clair and Anchor Bay rather than by another land county. That water boundary helps explain why communities such as St. Clair Shores and New Baltimore sit where they do and why the eastern outline is more irregular than the straight northern and western edges. This map is appropriate for county-scale orientation, not for parcel ownership or legal boundary decisions; those tasks require current official GIS or land-record sources.
The six-city index makes Macomb County’s southern concentration unmistakable
The city map intentionally reduces the county to six ranked city labels. Warren is marked first and Sterling Heights second, both in the southwest portion of the county. St. Clair Shores is third along the lakeshore, Roseville is fourth, and Eastpointe is fifth near the southern edge. Mount Clemens is sixth and appears northeast of the other five. The ranking is useful for identifying the selected major cities, but the geographic pattern is more important than the numbers: five of the six markers sit in a compact southern cluster, while Mount Clemens forms a separate reference point closer to the Clinton River and central-eastern Macomb County.
This simplified view matches the county’s official description of a densely populated south and a more rural north. It should not be mistaken for a complete list of settlements. Romeo, Richmond, New Haven, Utica, New Baltimore, and other communities remain important on the general map even though they are not part of the six-city index. A useful way to read the two layers together is to begin with the six markers, establish where the main metropolitan concentration lies, and then return to the general map to add the smaller northern and eastern communities. That sequence keeps the many place names from obscuring the county’s strongest settlement pattern.
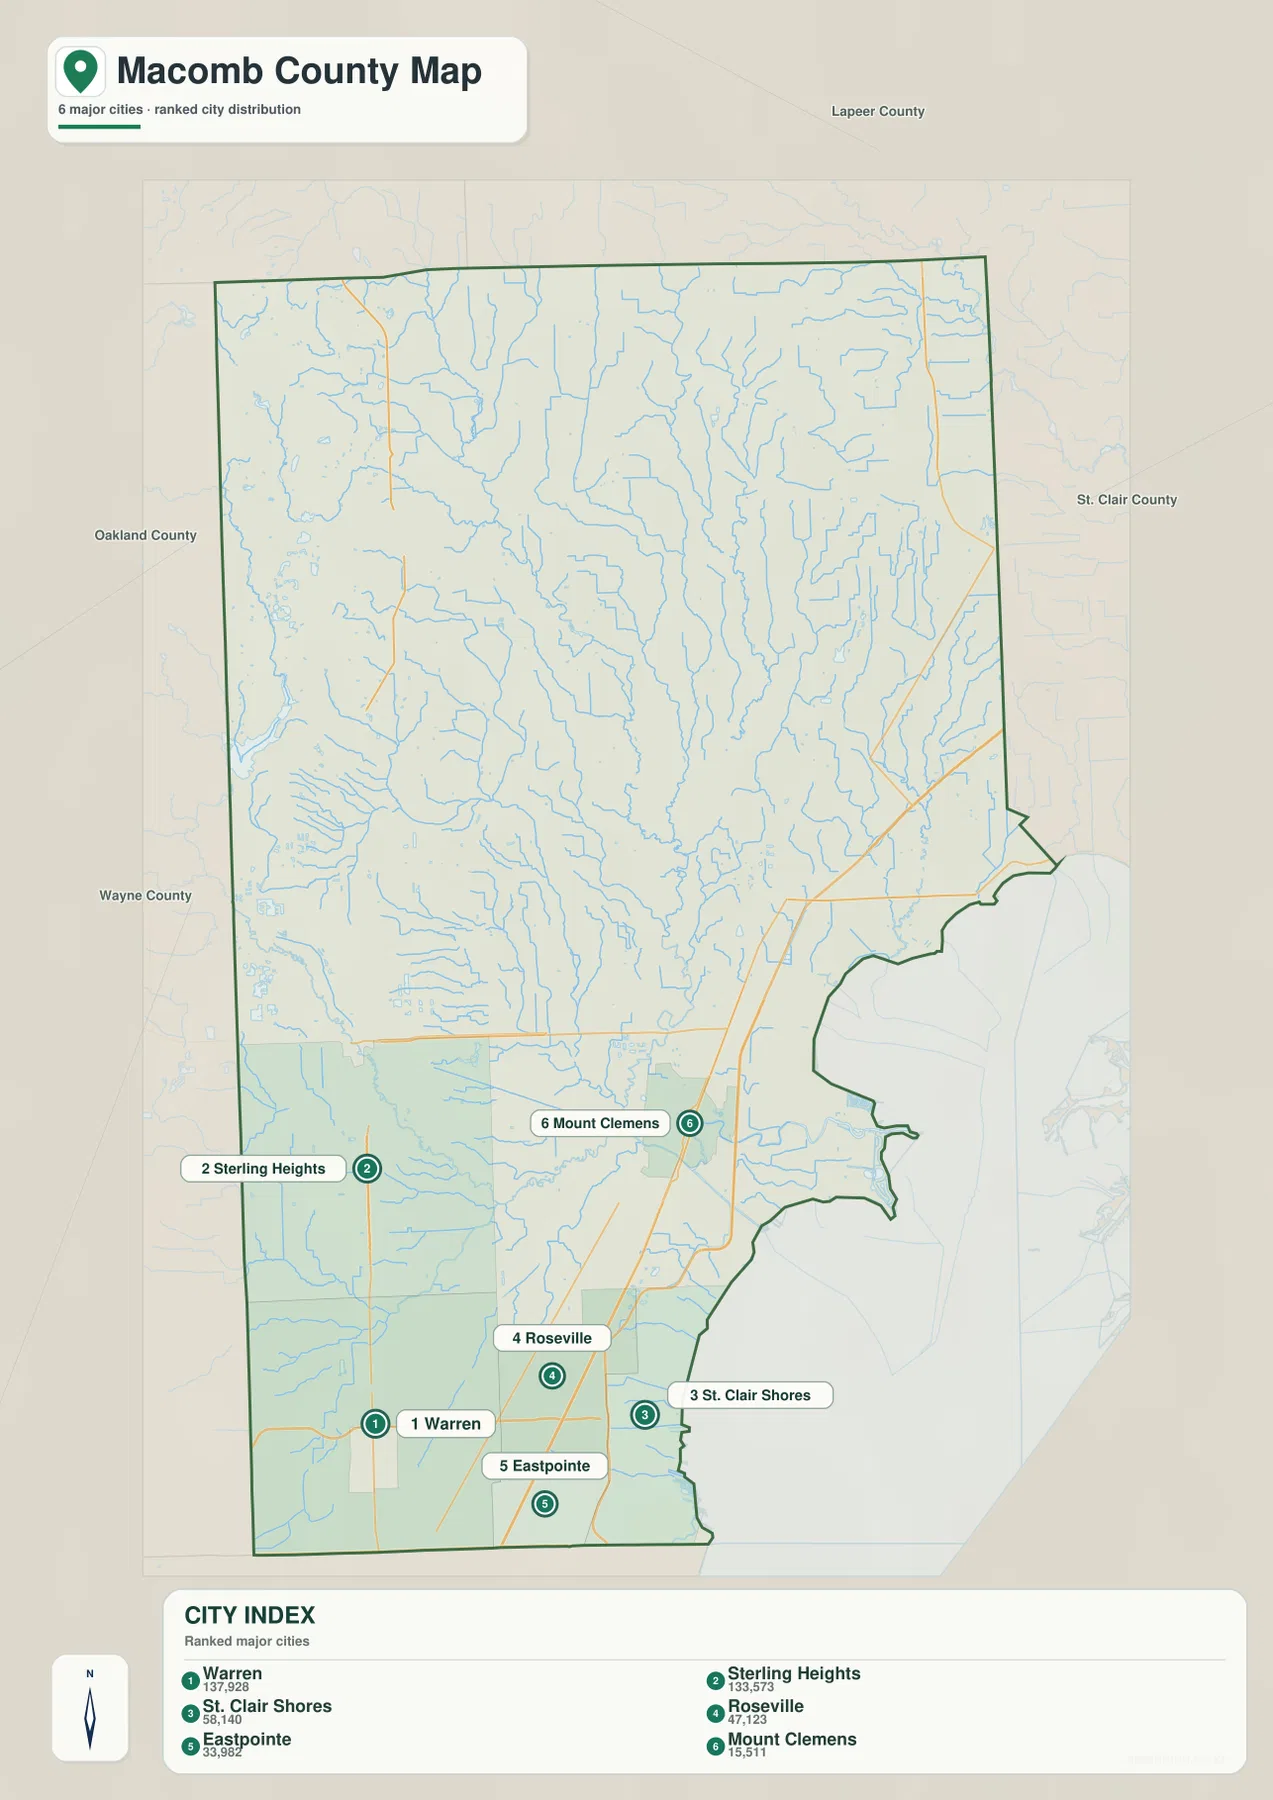
The city layer works well when the purpose is orientation rather than navigation. Warren and Sterling Heights establish the western side of the urban belt, St. Clair Shores ties that belt to Lake St. Clair, and Mount Clemens shifts attention toward the county’s central-eastern waterways. Actual driving relationships are more complicated because interstate access, local streets, bridges, construction, and traffic conditions are not represented by the ranking. For travel planning, a current routing service is necessary; for explaining where Macomb County’s principal city labels are concentrated, this reduced map is much easier to read than a fully labeled road map.
Several Clinton River branches descend through the northern and central county before reaching the lakeshore
The terrain-and-water map reveals a dense drainage network that is easy to miss on the road layer. Branch Clinton River enters from the northwest and runs southward through the western-central part of the county. Middle Branch Clinton River follows another southbound course farther east, while North Branch Clinton River crosses the center and eventually joins the larger Clinton River system. Coon Creek appears east of those branches. Together, these named waterways show that northern Macomb County is not an empty interior between towns; it is divided by many stream valleys that lead toward lower ground in the center and southeast.
Near Mount Clemens, the Clinton River turns toward Lake St. Clair, making the city and river an especially useful paired reference on the map. Red Run River is labeled in the southwest, while Salt River drains part of the northeast toward Anchor Bay. Lake Tranquility sits near the eastern-central water network. The northwest contains a separate cluster of smaller lakes, including Fisher Lake, Nowlan Lake, Mill Lake, Cusick Lake, and Crooked Lake. These inland lakes are modest compared with Lake St. Clair, but their concentration helps distinguish the higher northwest from the broad, low coastal side of the county.
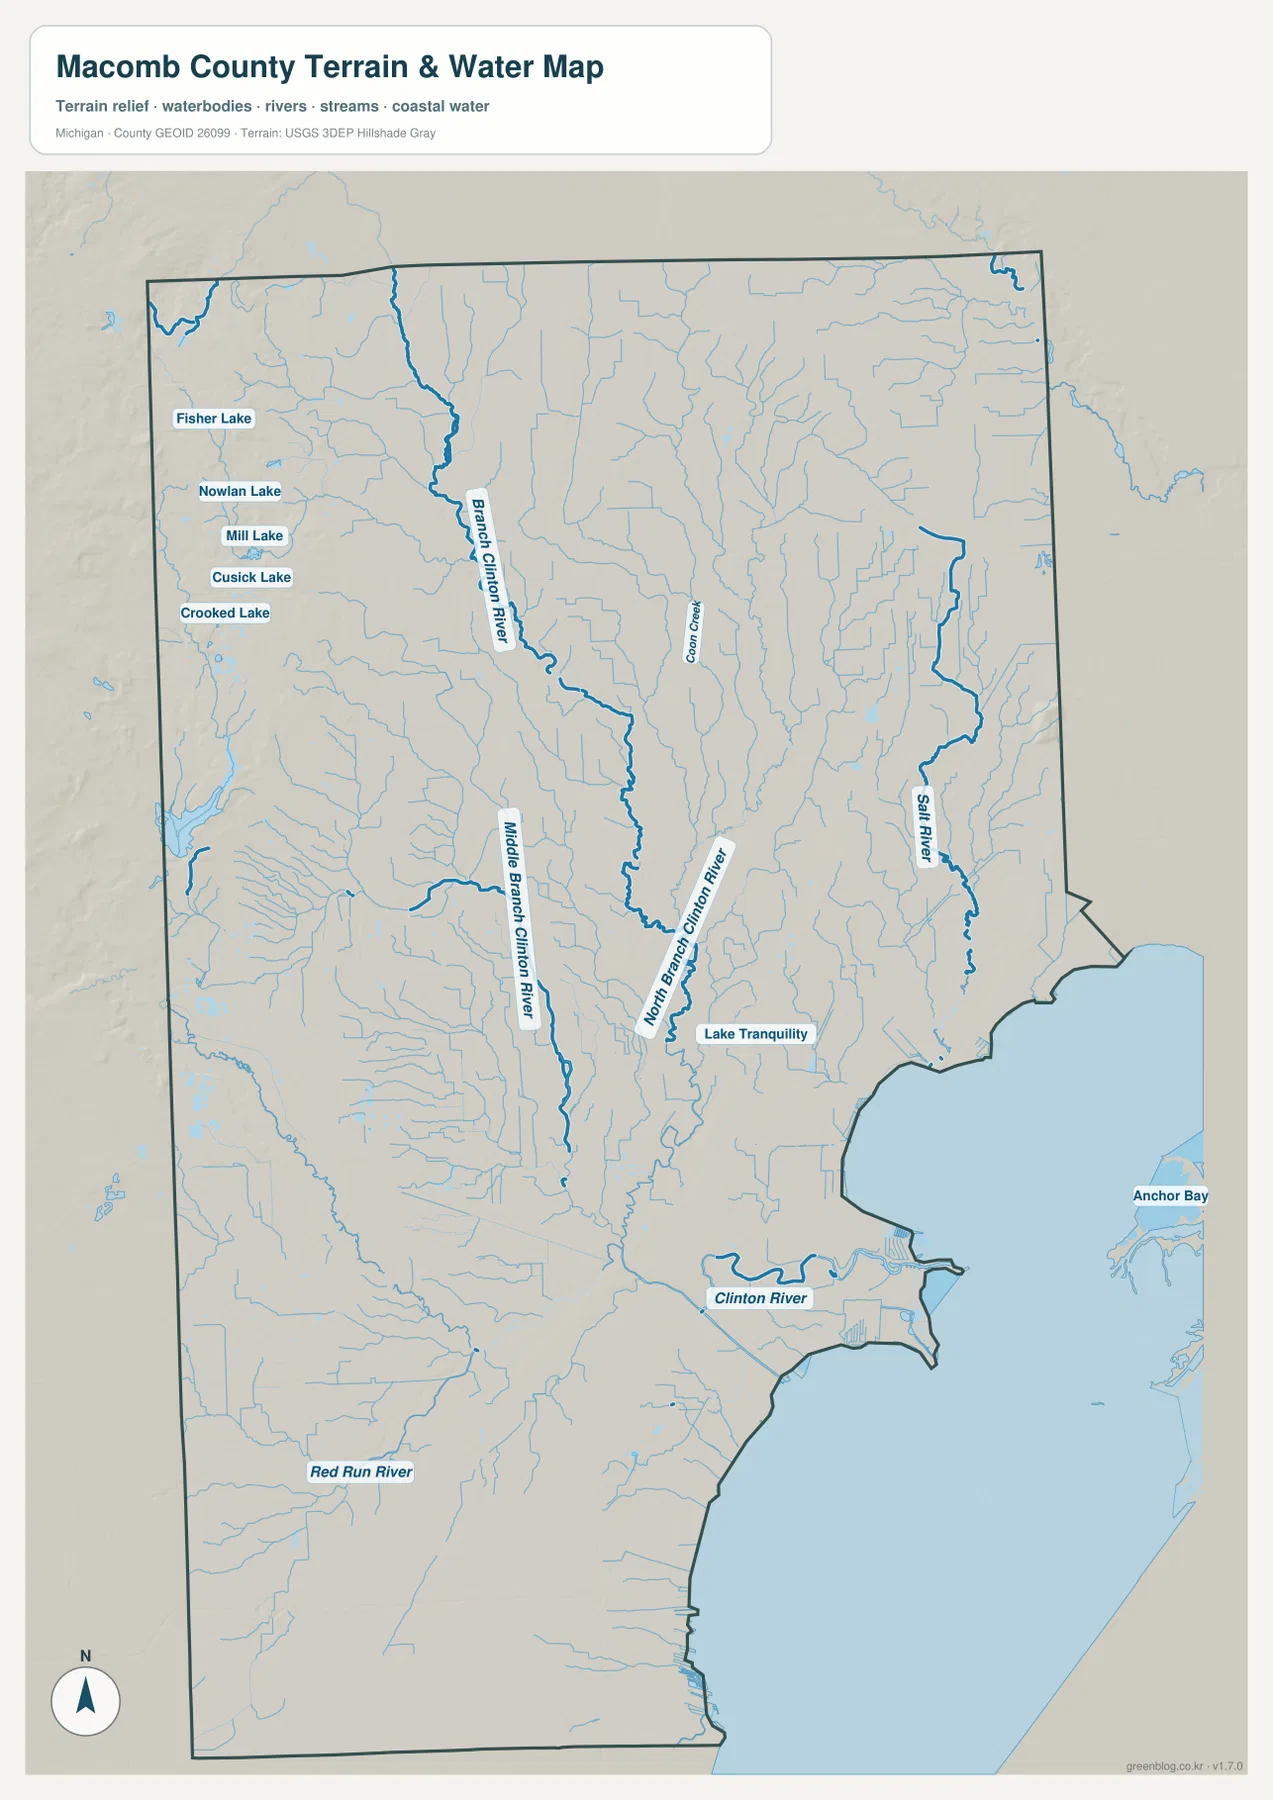
Macomb County’s official Clinton River page describes the river as a central local waterway used for paddling, fishing, and other recreation, and it identifies a navigable route extending through several county communities toward Lake St. Clair. That recreational role is useful context, but the supplied water map remains a geographic reference rather than a safety product. It does not show water depth, flood stages, channel markers, wetland regulation lines, current streamflow, or boating hazards. Anyone making decisions about flood risk, navigation, or water access should use current specialized sources in addition to this generalized map.
Low Lake St. Clair shorelands give way to a sharply higher northwest corner
The elevation map shows an actual mapped range of roughly 174 to 349 meters, with a mean near 206 meters. Dark green lowlands dominate the Lake St. Clair and Anchor Bay side of the county, including much of the southeast and the lower Clinton River area. Elevation rises gradually toward the north and west, but the most dramatic change occurs near the northwest corner, where yellow and brown shaded relief marks substantially higher terrain along the Oakland and Lapeer County directions. With more than 170 meters between the mapped minimum and maximum, Macomb County has a larger county-scale relief difference than its flat southern suburbs might initially suggest.
The water map helps explain the shape of that surface. The Clinton River branches descend from the higher northern and western interior toward lower central and southeastern ground. The northwestern lake cluster also sits among more varied relief than the broad coastal plain around St. Clair Shores and Anchor Bay. These colors are locally scaled, so brown areas should not be interpreted as mountains; they simply represent the higher end of Macomb County’s own elevation range. What matters is the consistent pattern: low land near Lake St. Clair, intermediate elevations across much of the center, and pronounced higher ground toward the northwest.
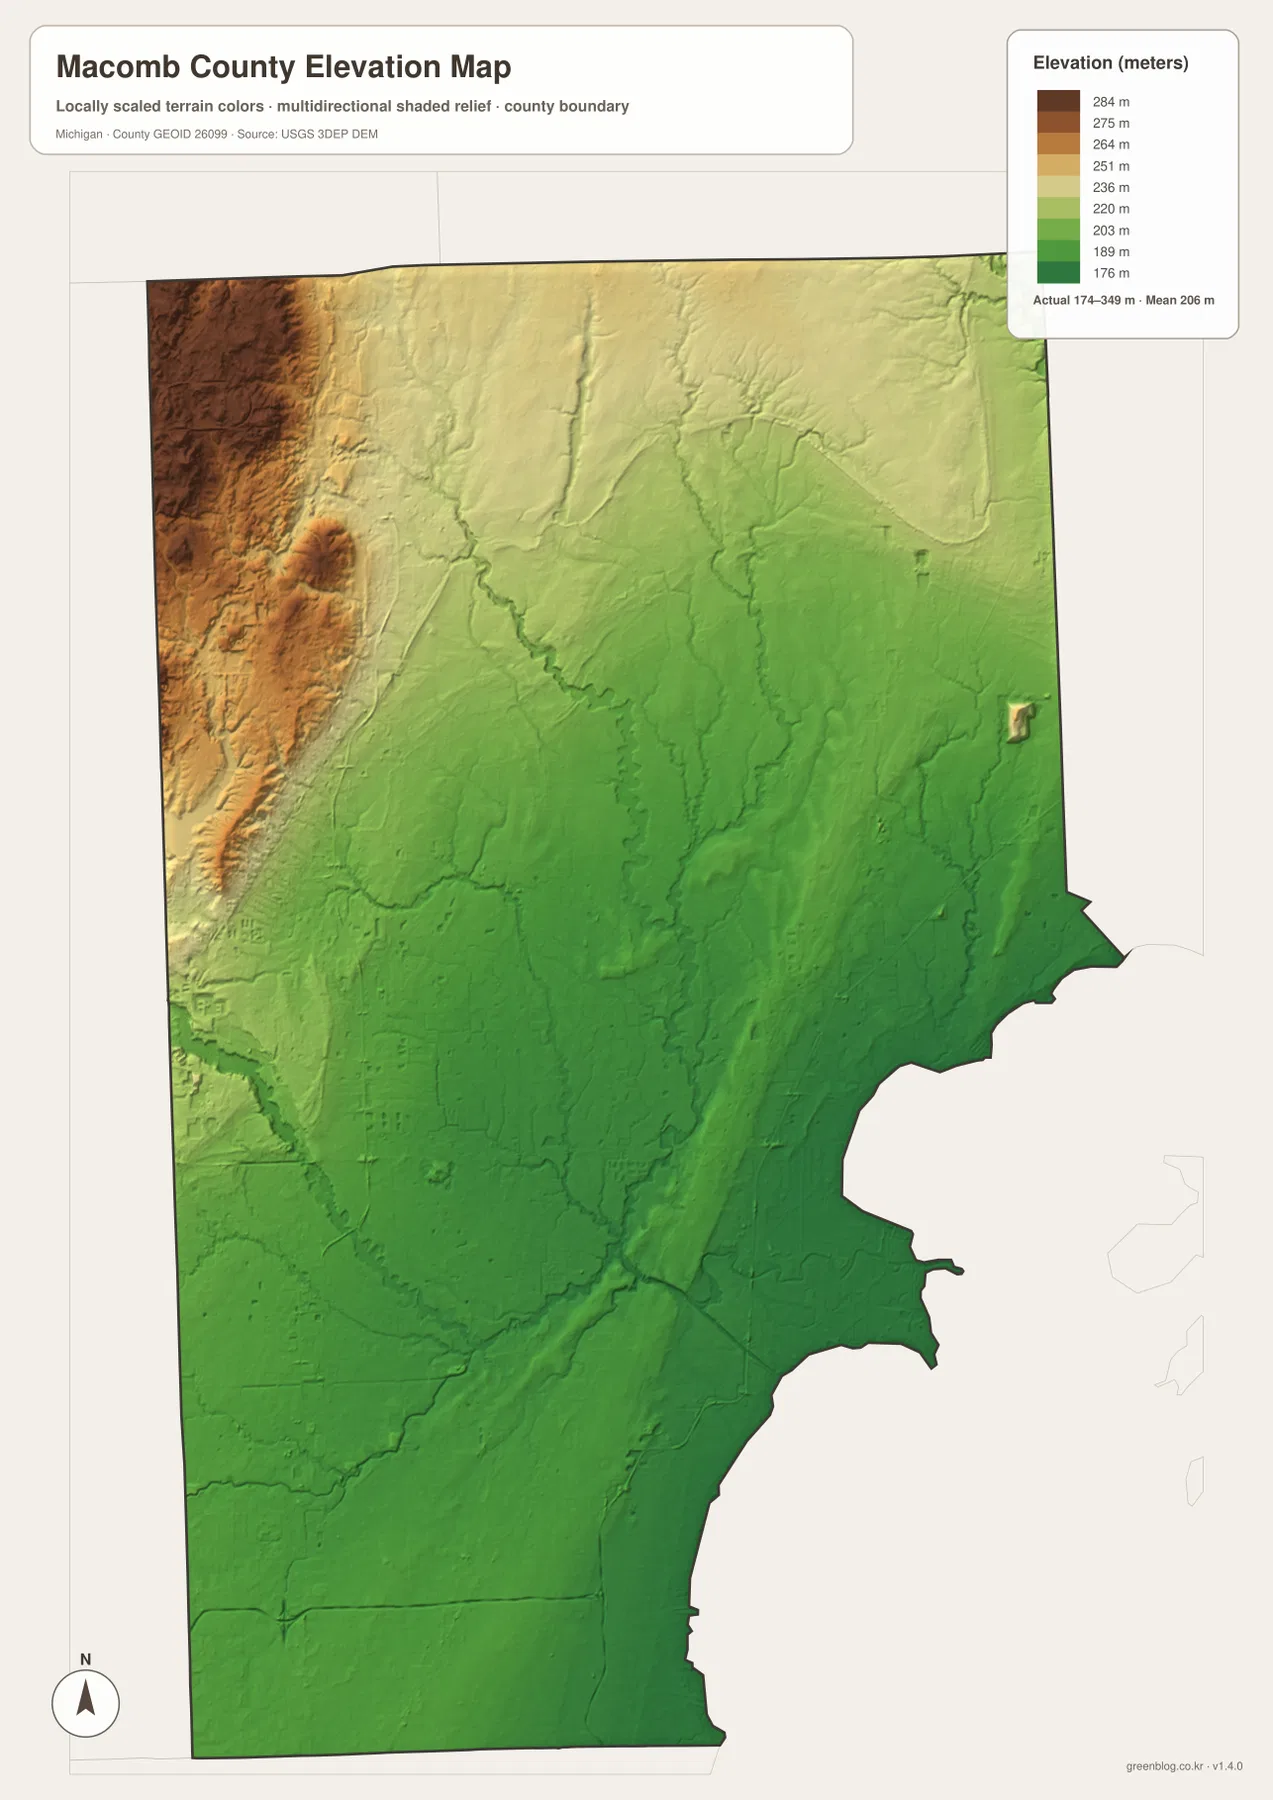
This generalized elevation surface is useful for broad geographic comparison but not for site-level measurement. It can help explain why tributaries flow from the higher northwest toward the Clinton River and Lake St. Clair, or why the county’s northern interior has more visible relief than its southeast. It should not be used to establish a building elevation, drainage grade, flood protection level, road design, or parcel survey. Those applications require original elevation data from sources such as the USGS 3D Elevation Program and, where appropriate, professional field surveying.
Reading the county from south to north connects its cities, river system, and changing relief
A simple way to learn Macomb County is to start in the southwest with Warren and Sterling Heights. M-53 and M-59 provide strong road references there. Move east across the southern city belt to Roseville and St. Clair Shores, then follow I-94 northeast toward Mount Clemens. At that point the Clinton River becomes the next useful feature, linking the urban map to the water map. Once Mount Clemens is established, adding New Haven, Richmond, and Romeo makes the transition into the more open northern half easy to see without trying to memorize every label at once.
The next step is to trace the Clinton River branches northward and westward. North Branch, Middle Branch, and Branch Clinton River divide the interior into several drainage corridors, while Salt River provides a separate northeastern route toward Anchor Bay. Finally, compare those waterways with the elevation map. The green Lake St. Clair shore becomes the low endpoint, and the yellow-brown northwest supplies the highest terrain. This sequence works particularly well in Macomb County because the same south-to-north trip that moves from dense suburbs to rural settlements also moves through a clear change in road density, water patterns, and relief.
The WebP images in the article are sized for convenient screen viewing. For printing, classroom handouts, presentations, or close reading of road and river labels, use the 3638 × 2572 pixel JPG originals in the ZIP. The general map is best for roads and boundaries, the city index emphasizes the southern concentration of major cities, the water map gives the most detailed view of the Clinton River system, and the elevation layer makes the low lakeshore–high northwest contrast immediately visible. These files are general reference maps and should not replace parcel surveys, live traffic information, flood maps, navigation charts, or engineering-grade elevation products.
Frequently Asked Questions
Why are most of the ranked cities concentrated in southern Macomb County?
The city index shows Warren, Sterling Heights, St. Clair Shores, Roseville, and Eastpointe all clustered in the southern part of the county. The general map also shows a dense network of I-94, M-53, M-59, M-3, and other roads there, while northern communities such as Romeo and Richmond are separated by much larger open areas.
Which map is best for following the Clinton River and its branches?
Use the terrain-and-water map. It labels the main Clinton River along with North Branch Clinton River, Middle Branch Clinton River, Branch Clinton River, Red Run River, Salt River, and several smaller lakes, making it the clearest layer for comparing the county’s drainage network.
Can the 174–349 m elevation range be used for construction or flood decisions?
No. The elevation map is a generalized county-scale surface intended to compare broad high and low areas. Building elevations, drainage design, flood protection, road engineering, and parcel measurements require current official datasets and, when necessary, professional site surveying.
Map File Information
The ZIP contains high-resolution JPG originals of the Macomb County general map, major-city map, terrain-and-water map, and elevation map. The originals are larger than the WebP images in the article and are better for printing or close inspection.
- Included Files: Use only the versions confirmed in the article and supplied images
- File Type: Use the confirmed download contents
- Intended Use: Printing, education, presentations, and map-based projects
Related Maps
Sources and references
- Macomb County – About Macomb County: official county profile covering location, Lake St. Clair shoreline, and the urban-to-rural county pattern.
- Macomb County – The Clinton River: official local information about the Clinton River and its recreational setting.
- Library of Michigan – Macomb County Guide: state reference guide to Macomb County history, maps, and published resources.
- U.S. Census Bureau TIGER/Line Shapefiles: official county-boundary and road reference data.
- USGS National Hydrography: reference information for rivers, streams, and lakes.
- USGS 3D Elevation Program: reference elevation data.
Green Map creates custom-edited map images using open geographic data sources such as geoBoundaries, Natural Earth, OpenStreetMap, and government open data. These maps are edited visual materials, not raw data files, and are provided for education, documents, presentations, and graphic reference.