You can download four high-resolution JPG maps of Kingsbury County in one ZIP from this page, while the WebP versions below provide a quick on-page view. De Smet is the easiest place to begin because U.S. 14 crosses the county through the De Smet–Lake Preston corridor before continuing toward Arlington. Lake Thompson occupies a large part of the south-central county, and the other supplied maps add a clearer view of the settlement pattern, named waterways, and the broad change in elevation from the low west side to higher ground in the north and northeast.
Rather than treating these maps as four separate illustrations, it helps to use the same landmarks in each one. De Smet and U.S. 14 make a reliable road reference, Lake Thompson anchors the southern half, and Redstone Creek is easy to follow through the western interior. On the elevation map, the western side is mostly green while the northern half shifts into yellow, tan, and brown. Those recurring landmarks make it possible to move from roads to towns, then to water and relief without losing track of where you are in the county.
Table of Contents
De Smet and U.S. 14 provide the clearest starting point
The county map gives De Smet a strong central role even though it sits slightly west of the geometric middle. U.S. 14 runs west to east through the community, continues through Lake Preston, and reaches the Hetland and Arlington side of the county. SD 25 crosses the De Smet area from north to south. On the outer edges, SD 39 is marked near the west side and U.S. 81 appears near Arlington on the east, so a few numbered highways are enough to establish the county’s main directions before looking at smaller roads.
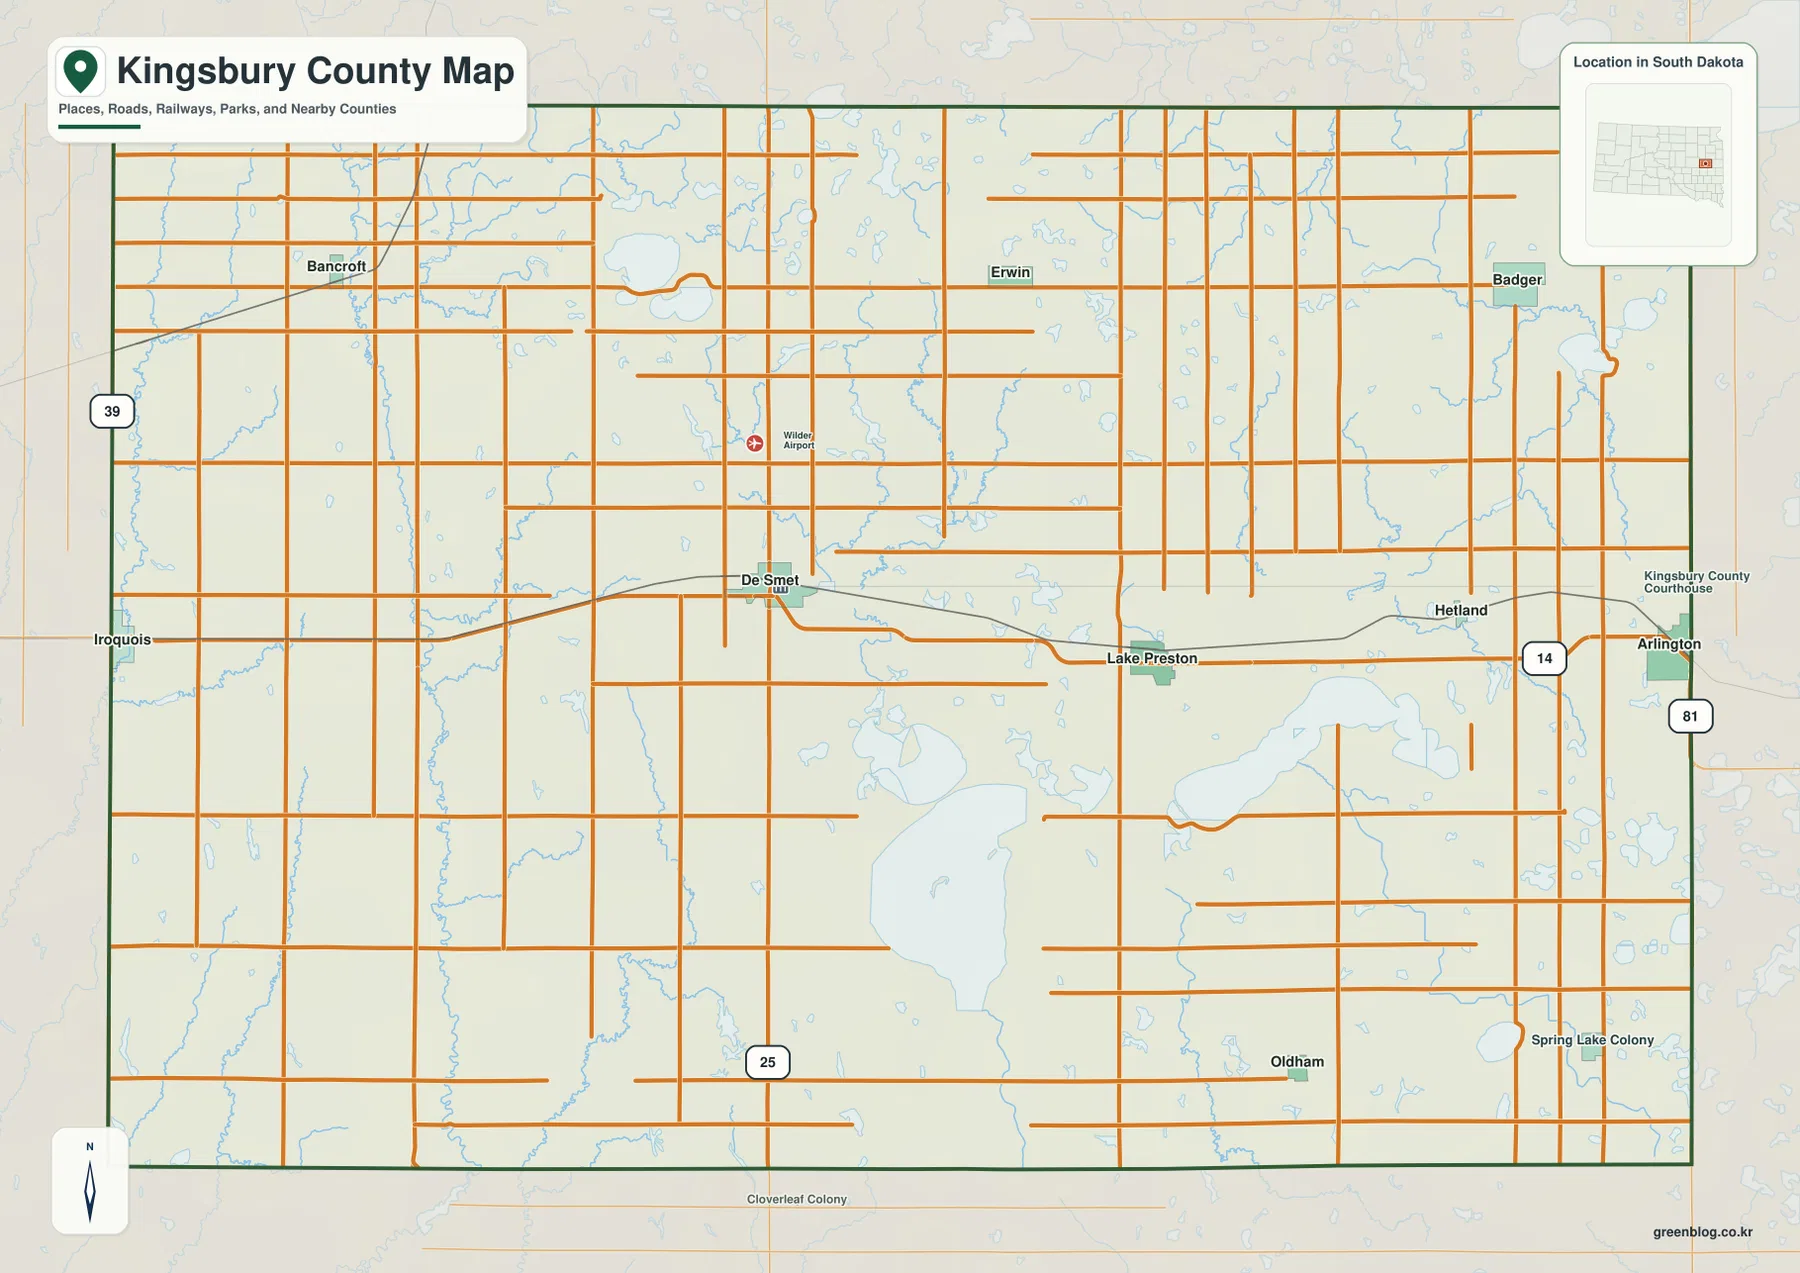
The general map also shows why the road grid is not perfectly uniform. Lake Thompson and many smaller water bodies break up the road network in the southern and eastern parts of the county, while creeks create another set of gaps in the west. Iroquois lies close to the western boundary and Arlington is near the eastern edge, making those two communities useful for judging the county’s full width. De Smet sits between them and works well as the place from which to compare the rest of the map.
There is also a practical administrative reason to keep De Smet in mind. Kingsbury County’s official website lists the county courthouse there, and the local history material linked below describes De Smet’s development as the county seat. That background helps explain why De Smet is such a useful reference point, but the map should still be read as a county-scale geographic guide rather than a source for parcel boundaries, current road closures, or other live information.
The settlement pattern stretches east and north from De Smet
The city distribution map removes most of the road detail and highlights six communities: De Smet, Arlington, Lake Preston, Iroquois, Badger, and Erwin. The central east–west relationship is especially clear. Lake Preston lies east of De Smet and Arlington sits farther toward the county line, roughly following the same broad U.S. 14 corridor. Iroquois is separated from that group on the western edge, while Badger and Erwin shift the settlement pattern well into the northern half.
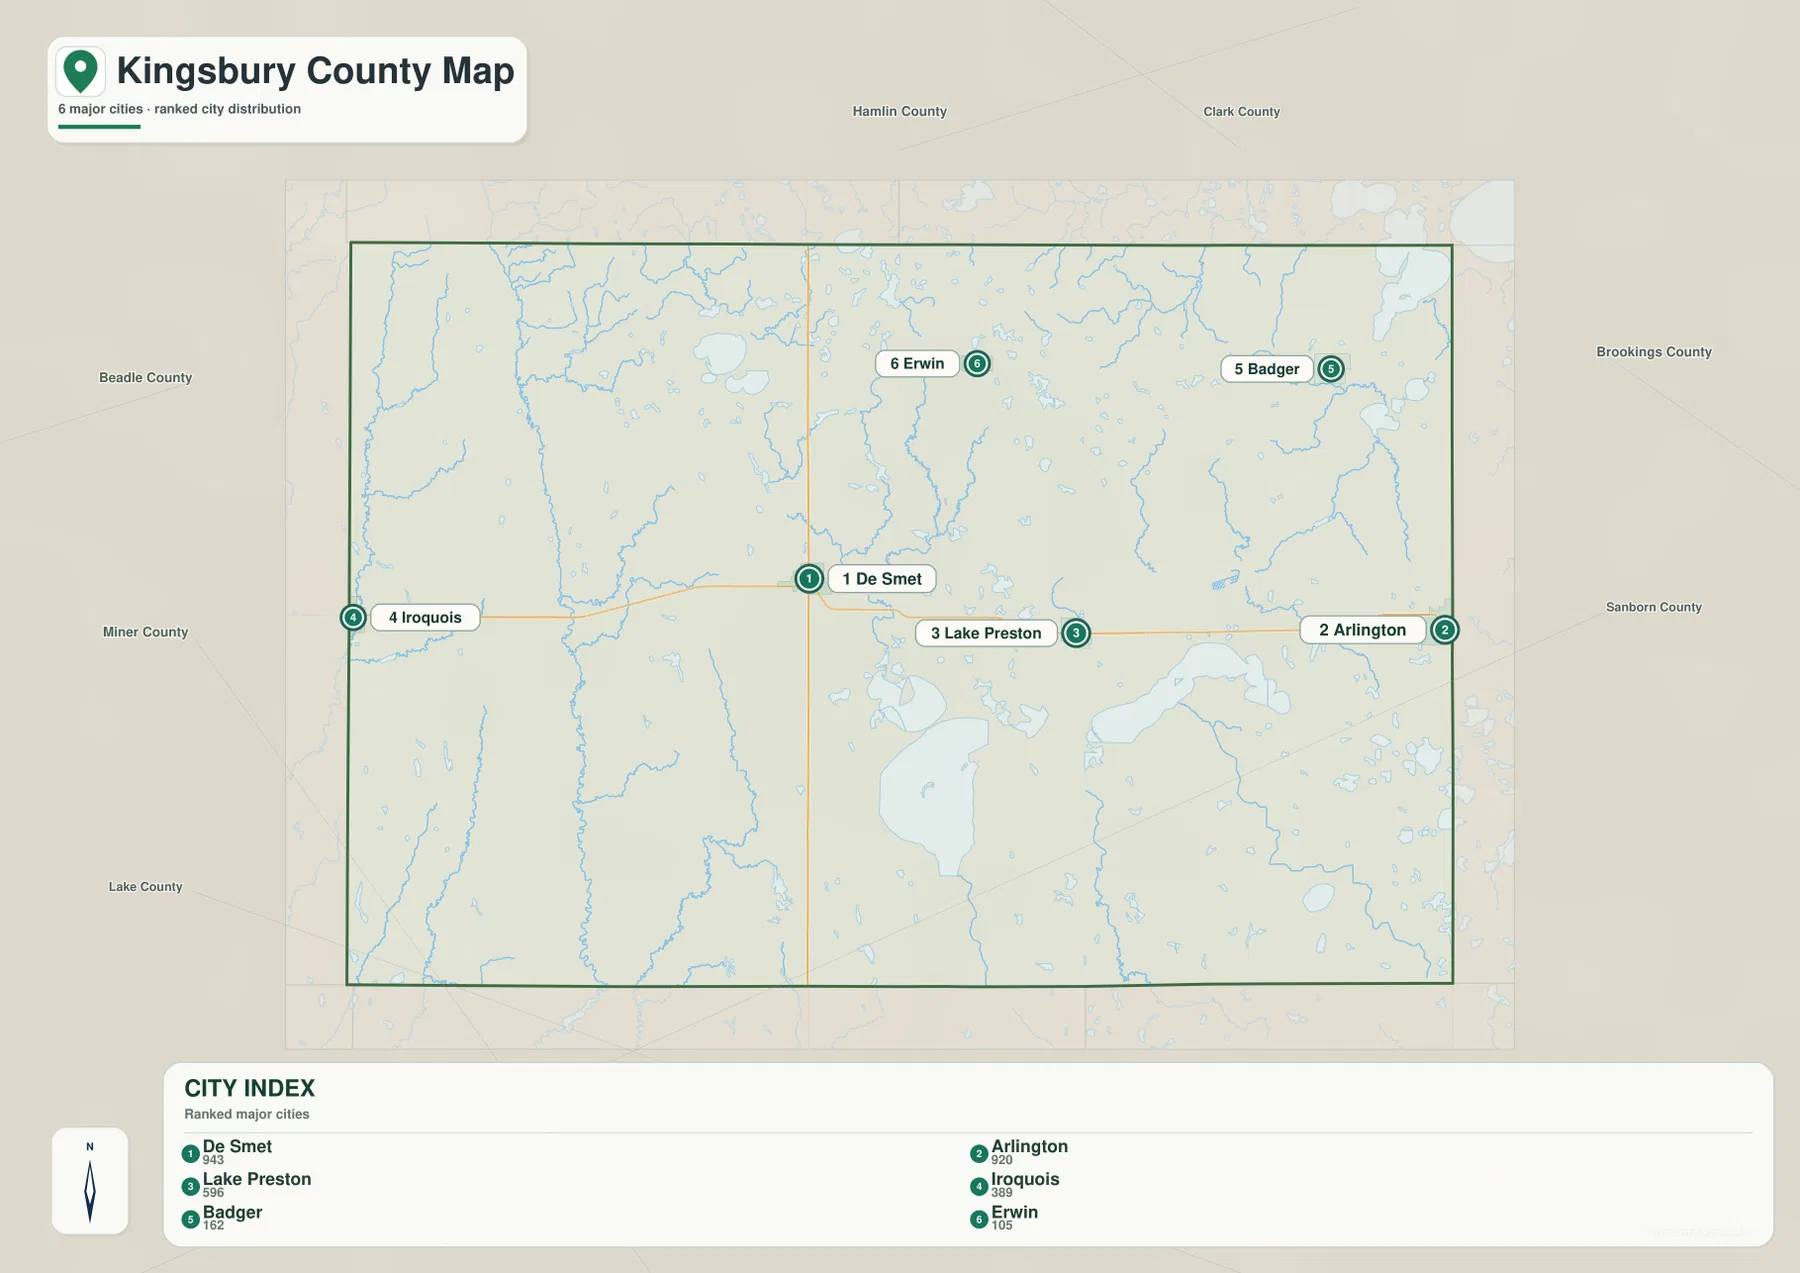
The numbered CITY INDEX is a location key, not a mileage table. This particular image does not draw connector lines between the communities and does not print mile values beside them. For that reason, the map should not be used to invent a straight-line distance or driving distance from De Smet to Arlington, Iroquois, or the northern towns. It is much better suited to a quick question such as whether a place lies on the west side, along the central corridor, or in the northern part of the county.
County names printed outside the border add another useful layer of orientation. They show which edges of Kingsbury County face neighboring counties, which is particularly helpful for Iroquois and Arlington because both lie close to the boundary. The city map therefore works as a simple regional index: it reduces the county to a handful of recognizable places and makes the spread of settlement easier to see than on the more detailed road map.
Lake Thompson dominates the south while creeks define the west
The terrain and water map changes the emphasis from roads to named water features. Lake Thompson is the dominant feature in the south-central county, with Lake Henry just to its north and Lake Whitewood farther east. A cluster of smaller named lakes, including Lake Albert, Lake Thisted, and Lake Badger, appears in the northeastern area. Lake Iroquois is a useful western reference, while Plum Lake and Mud Lake help mark the northern half.
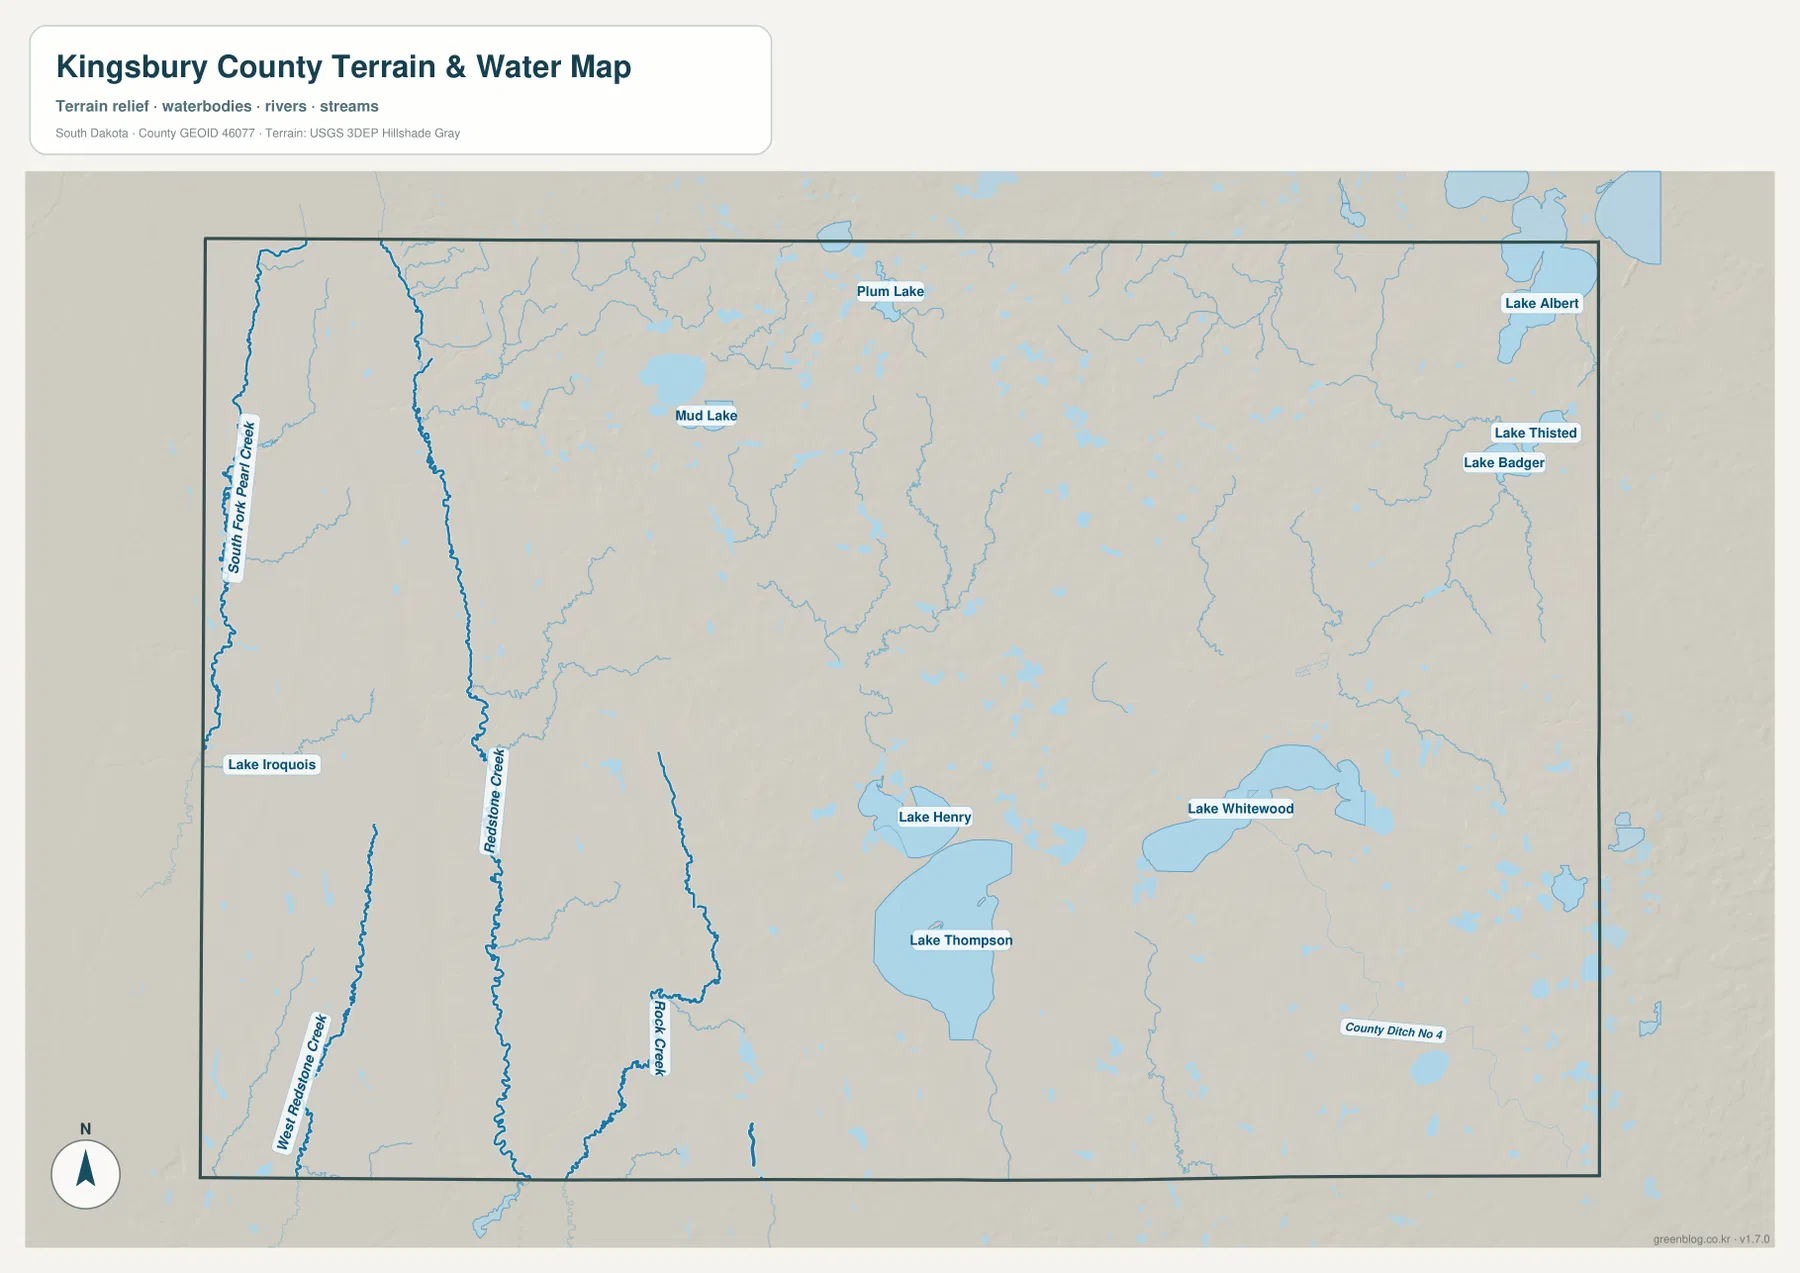
The west side looks different because long creek lines are more prominent than large lakes. Redstone Creek runs through the western interior, South Fork Pearl Creek follows close to the western boundary, and West Fork Redstone Creek appears farther southwest. Rock Creek is labeled south of the central area. These features make the western half easier to understand when it is compared with the lake-heavy south and east: one side is organized by elongated drainage lines, while the other contains larger open water bodies and clusters of smaller lakes.
This water map is a reference map for named lakes, creeks, streams, and drainage features. It is not a flood-risk map, navigation chart, property-boundary map, water-quality report, or live gauge display. Small channels can change seasonally, and a line on the map does not imply a constant flow. When current hydrography or more detailed linework is needed, the USGS National Hydrography resources listed at the end of the page are the appropriate source.
Elevation separates the low western side from higher northern ground
The elevation map makes the county’s broad relief especially easy to recognize. Green shades cover much of the western side, then shift through lighter greens and yellows toward the center. Across the north-central and northeastern portions, tan and brown areas form the highest broad zone. The legend gives an actual elevation range of about 409 to 576 meters and a mean of about 509 meters, so the mapped difference between the low and high ends is roughly 167 meters.
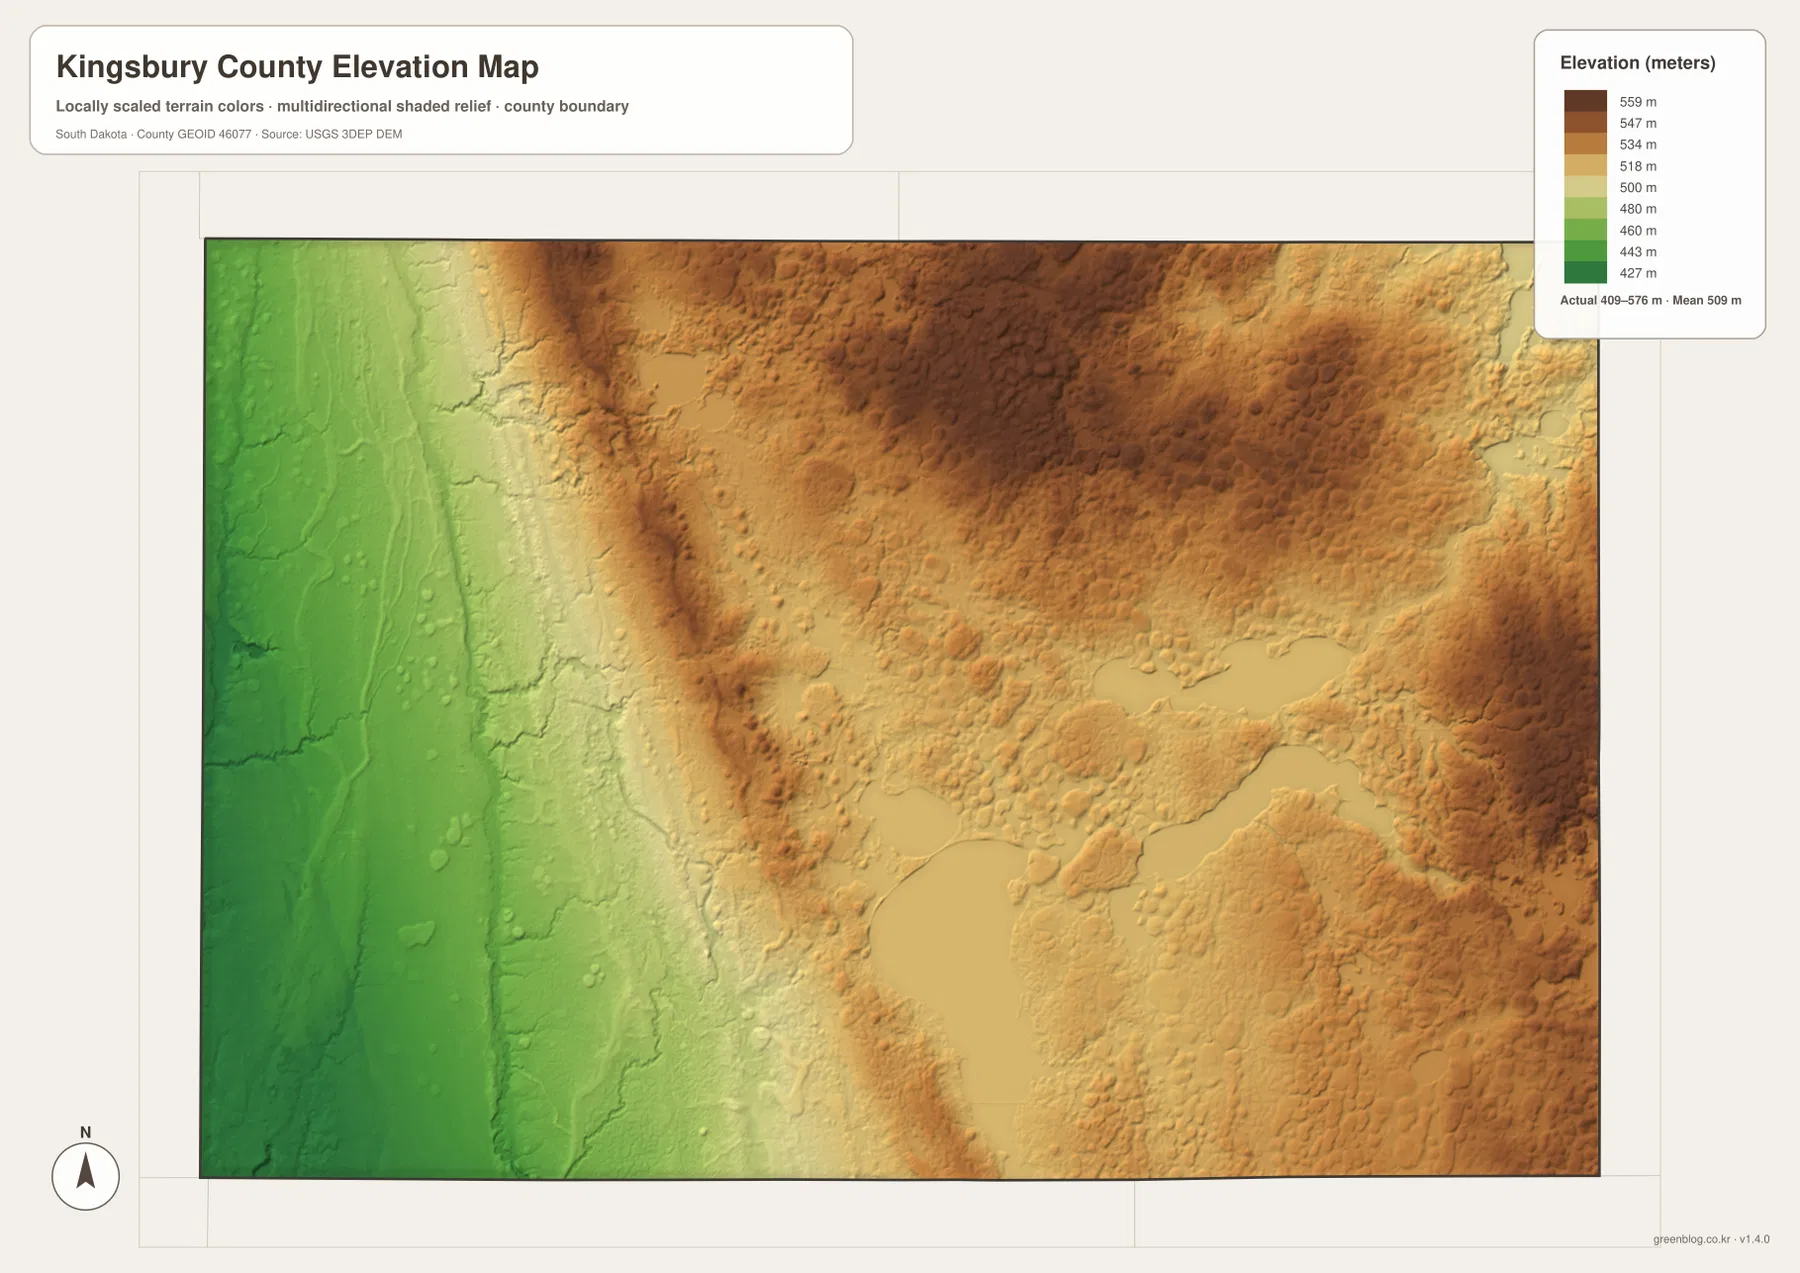
The change is not a single straight slope. Lower corridors reach into the interior and higher ridges are broken by shallower valleys, especially across the northern half. Lake Thompson and Lake Whitewood create broad interruptions in the shaded surface, while Redstone Creek occupies generally lower ground on the west. Comparing the water and elevation maps side by side is useful because the long western drainage lines often coincide with the lower green terrain.
This elevation image is a generalized county-scale surface rather than a survey product. It is appropriate for comparing broad parts of Kingsbury County and recognizing ridges, lowlands, and the overall west-to-north elevation contrast. It should not be used to determine the exact elevation of a house, road centerline, field corner, or engineering site. For precise values, the USGS 3D Elevation Program offers the underlying elevation resources.
For a practical reading sequence, begin with De Smet and U.S. 14 on the county map, move to the city map to place Lake Preston, Arlington, Iroquois, Badger, and Erwin, then use Lake Thompson and Redstone Creek to orient the water map. Finish with the elevation map to see how the low western terrain differs from the higher north and northeast. The WebP images are convenient for browsing, and the ZIP below contains the matching high-resolution JPG originals for printing, classroom use, presentations, or offline reference.
Frequently Asked Questions
Does the city distribution map show mileage between De Smet and Arlington?
No. The city map shows the positions and index numbers for De Smet, Arlington, Lake Preston, Iroquois, Badger, and Erwin, but it does not include connector lines or mileage labels. Straight-line distance and driving distance should be checked with a current routing source rather than estimated from this image.
Which map is best for locating Lake Thompson and Redstone Creek together?
The terrain and water map is the best choice. Lake Thompson is the large south-central lake, while Redstone Creek runs through the western interior. The same image also labels Lake Henry, Lake Whitewood, Lake Iroquois, several northeastern lakes, and additional creeks, making it the clearest single view of the county’s water features.
Can the 409–576 m elevation range be used as an exact site elevation?
No. That range summarizes the broad elevation shown across Kingsbury County. The image is designed to compare large areas, not to provide a survey-grade value for an individual property, road, or construction site. Exact elevations should be taken from an appropriate USGS 3D Elevation Program dataset or another authoritative survey source.
Map File Information
The ZIP contains four original high-resolution JPG files for Kingsbury County: the county map, city distribution map, terrain and water map, and elevation map.
- Included Files: 4 JPG maps
- Printable Size: 3638 × 2572 px each
Related Maps
Sources and references
- Kingsbury County official website – county offices, services, and the De Smet courthouse location.
- De Smet History – local historical background for De Smet and Kingsbury County.
- U.S. Census Bureau TIGER/Line Shapefiles – authoritative county boundary and geographic reference data.
- USGS National Hydrography – official hydrography resources for streams, creeks, rivers, and lakes.
- USGS 3D Elevation Program – authoritative elevation and terrain data.
Green Map creates custom-edited map images using open geographic data sources such as geoBoundaries, Natural Earth, OpenStreetMap, and government open data.
These maps are edited visual materials, not raw data files, and are provided for education, documents, presentations, and graphic reference.