In 2024, renewable energy consumption in the U.S. Electric Power sector varied widely across the 50 states and the District of Columbia when measured on an energy-content basis. Texas recorded 566.833 million MMBtu, the largest value in the series, followed by California at 316.186 million MMBtu and Iowa at 154.877 million MMBtu. The sum of all 51 published state-level observations was 2,681.593 million MMBtu, so Texas represented 21.14% of that simple total. These figures are not electricity generation in megawatt-hours. They measure the energy content of renewable fuels and renewable energy inputs consumed for electricity generation and useful thermal output in the Electric Power sector.
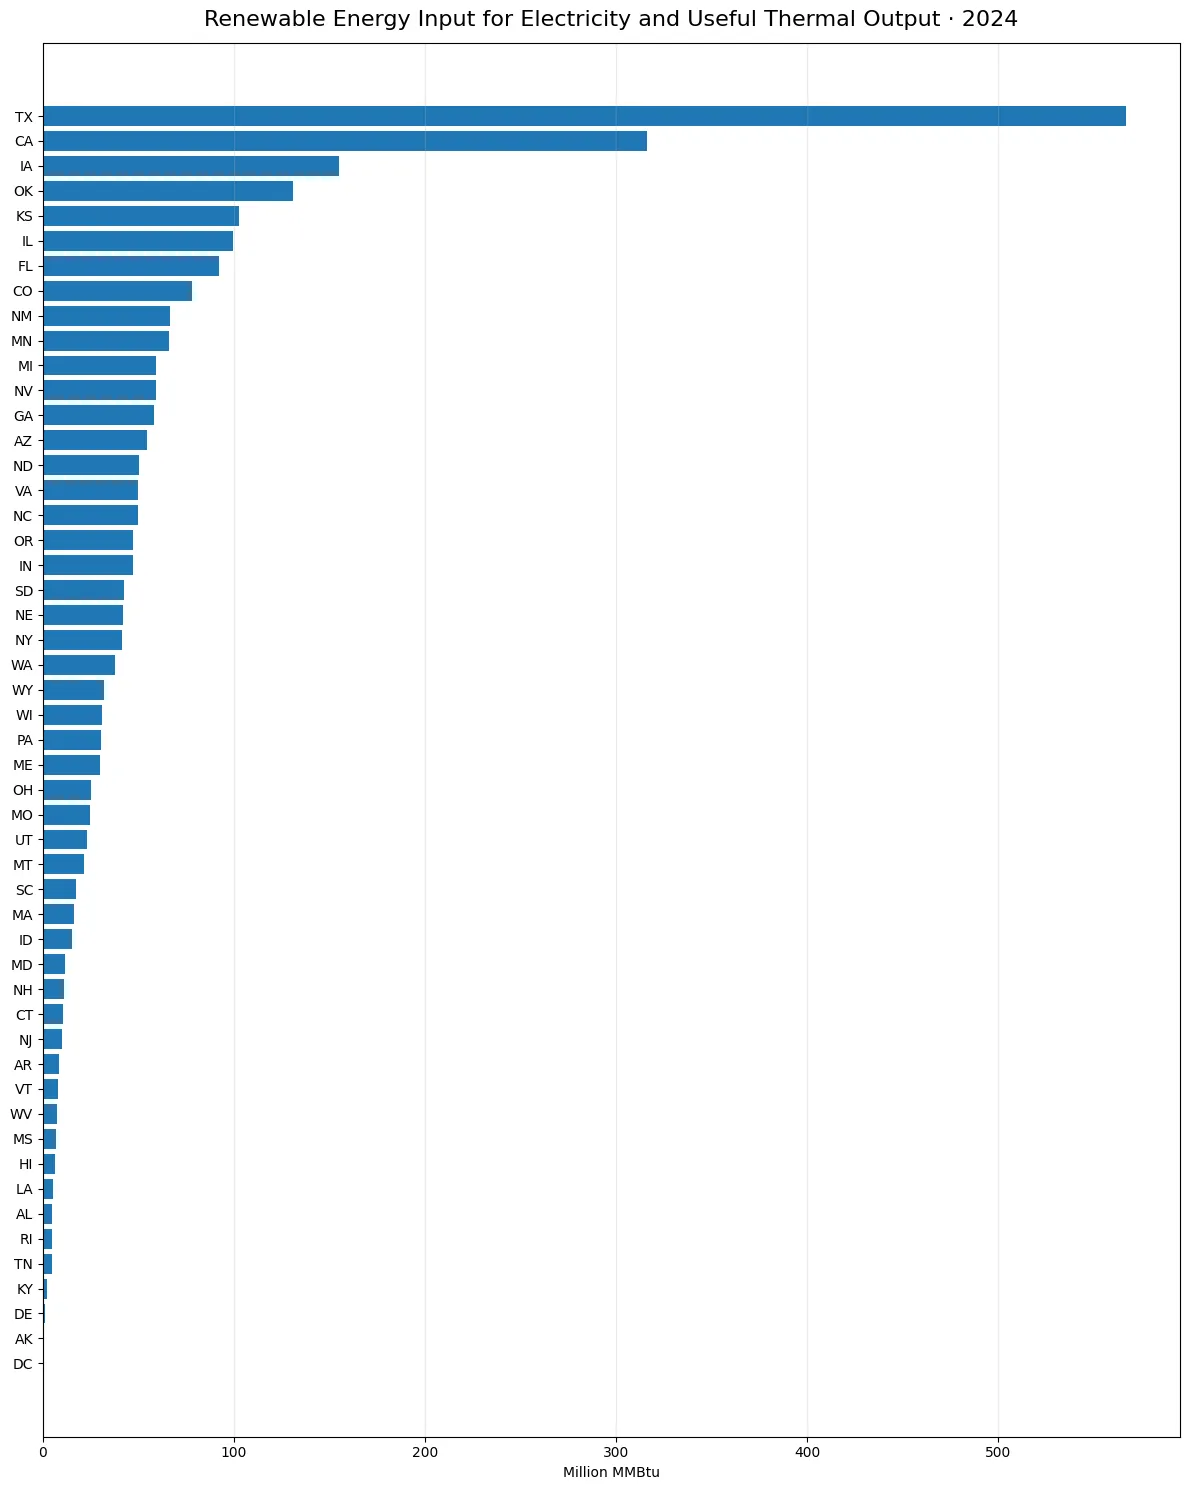
Table of Contents
What this metric measures
The EIA identity behind this comparison is important. The fuel category is AOR, or all renewables, the sector is 98, Electric Power, and the field is total-consumption-btu. The unit is million MMBtu. Total consumption in this series combines renewable energy used for electricity generation with renewable energy used to produce useful thermal output. That makes it broader than a generation-only fuel-consumption measure. It is also different from net generation, capacity, or a physical-units fuel series. Keeping those definitions separate prevents a state with high fuel-energy input from being described incorrectly as having the same ranking in electricity output.
The distribution is strongly right-skewed. The mean across the 51 jurisdictions was 52.580 million MMBtu, while the median was only 30.591 million MMBtu. A mean well above the median indicates that a relatively small group of high-value states pulls the average upward. Texas, California, and Iowa together accounted for 38.70% of the summed observations. The top ten accounted for 62.41%. Many states therefore sit well below the arithmetic mean even though every jurisdiction has a positive reported value. A national average alone would hide this concentration, so the full distribution and the leading-state shares are more informative when describing the geography.
Leading states and concentration
Texas stood far above the rest of the ranking. Its value exceeded California’s by about 250.647 million MMBtu, and Texas plus California together represented roughly 32.93% of the 51-jurisdiction total. Iowa ranked third at 154.877 million MMBtu, Oklahoma fourth at 130.862, and Kansas fifth at 102.637. Illinois followed at 99.246, Florida at 92.368, Colorado at 78.038, New Mexico at 66.668, and Minnesota at 65.893 million MMBtu. The ranking shows where renewable energy input measured in Btu was largest within Electric Power, not where renewable electricity generation necessarily had the same order.
| State or jurisdiction | Code | Million MMBtu | Share of 51-jurisdiction sum |
|---|---|---|---|
| Texas | TX | 566.833 | 21.14% |
| California | CA | 316.186 | 11.79% |
| Iowa | IA | 154.877 | 5.78% |
| Oklahoma | OK | 130.862 | 4.88% |
| Kansas | KS | 102.637 | 3.83% |
| Illinois | IL | 99.246 | 3.70% |
| Florida | FL | 92.368 | 3.44% |
| Colorado | CO | 78.038 | 2.91% |
| New Mexico | NM | 66.668 | 2.49% |
| Minnesota | MN | 65.893 | 2.46% |
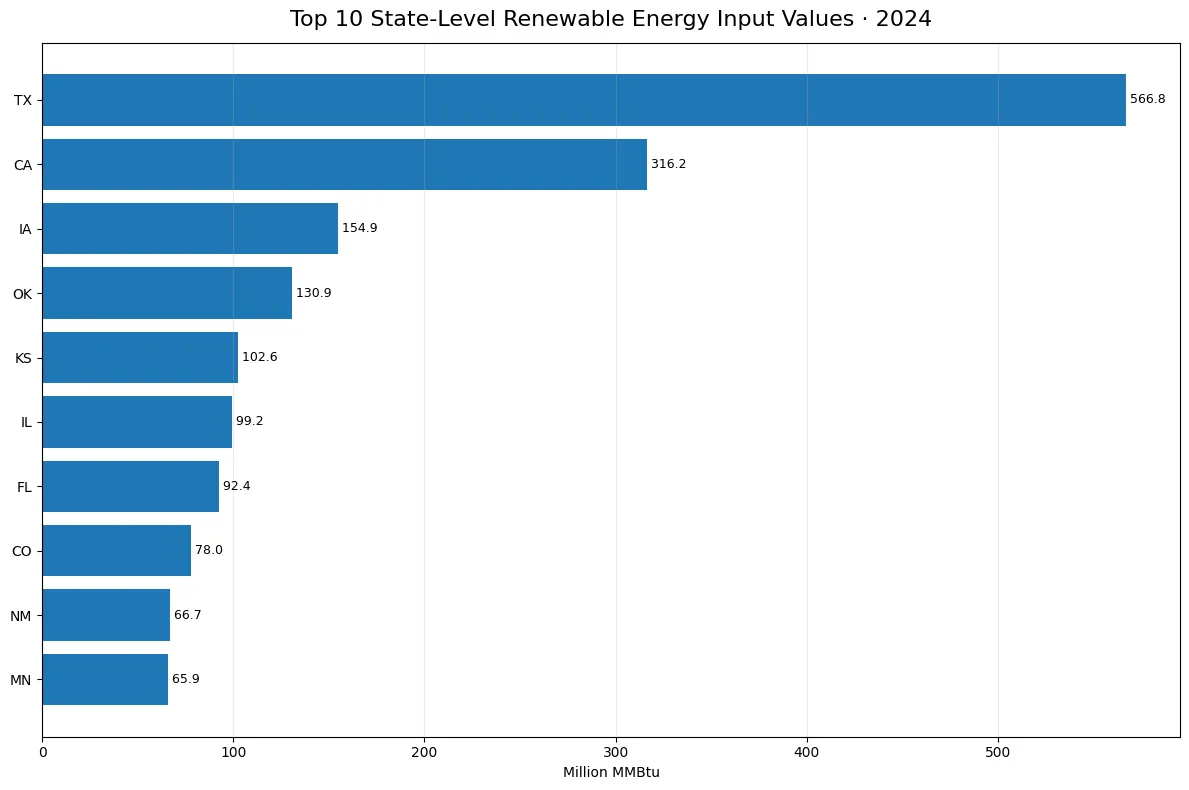
The top group also spans several parts of the country, so the pattern cannot be reduced to one region or one renewable technology. Texas, Oklahoma, and Kansas are joined by California, Iowa, Illinois, Florida, Colorado, New Mexico, and Minnesota. Because AOR combines multiple renewable sources, a high state value does not reveal by itself whether wind, solar, hydroelectric power, biomass, geothermal energy, or another renewable source was the main contributor. Answering that question requires fuel-specific EIA series. The present series is best used to compare the combined renewable energy input across jurisdictions under one consistent Electric Power definition.
A broad middle tier sits between the leaders and the low-value jurisdictions. Michigan reported 59.115 million MMBtu, Nevada 59.048, Georgia 57.917, Arizona 54.362, and North Dakota 50.370. Similar totals do not imply similar renewable portfolios. Two states can reach comparable Btu values through very different mixes of technologies and operating conditions. In addition, total-consumption-btu includes useful thermal output as well as electricity generation. Where combined heat and power or other useful-thermal activity matters, a state’s position can differ from its position in a generation-only consumption series. That distinction is especially relevant when comparing this article with other EIA state rankings.
Lower values, zeros, and missing data
At the lower end, the District of Columbia recorded 0.108 million MMBtu, Alaska 0.447, Delaware 0.827, Kentucky 2.164, Tennessee 4.662, Rhode Island 4.703, and Alabama 4.754. No observation is missing, and none of the 51 values is zero. A low value should not be interpreted as proof that a jurisdiction has no renewable energy. This series covers a particular sector and a particular type of annual energy input. Distributed generation, renewable use outside Electric Power, installed capacity, and net electricity output are measured elsewhere. The safest interpretation is therefore comparative rather than absolute.
How to read the calculated shares
The percentage shares in this article are derived only to describe the distribution within this one EIA series. Texas’s 21.14% is its share of the simple sum of the 51 state-level observations, and the top ten share of 62.41% is calculated on the same basis. Neither number is a renewable share of total U.S. final energy consumption, a state electricity-market share, or a renewable percentage of all fuels. Those questions use different denominators. The percentages here should always be read alongside the million MMBtu values and the Electric Power sector definition.
Energy input is not electricity output
Energy input and electricity output are not interchangeable. Net generation is normally reported in megawatt-hours and measures electricity produced. This series measures fuel or energy consumption in Btu terms. Conversion efficiency, technology, operating patterns, and EIA’s treatment of renewable energy can all affect the relationship between an input measure and an output measure. A state with twice the Btu consumption does not automatically generate twice as much electricity. Readers interested in electricity production should use a net-generation series, while readers comparing the energy content of renewable inputs can use total-consumption-btu.
Why one year is not a long-term trend
The year also matters. These are 2024 annual observations, not a permanent ranking. Renewable capacity additions, weather, hydro conditions, maintenance schedules, fuel availability, and electricity demand can shift state values from year to year. One annual snapshot is useful for describing the distribution at a specific time, but it cannot by itself establish a long-run trend or explain why a state’s value changed. A trend analysis should connect several years using the same fuel category, sector, field, unit, and geography so that changes are comparable rather than artifacts of changing definitions.
What the charts reveal
The full-state chart is useful for seeing the scale of the distribution, while the top-ten chart makes the leading group easier to compare. Texas and California form the most prominent bars, followed by a substantial step down to Iowa and Oklahoma. The visual gap between the leaders and most other jurisdictions is consistent with the mean-median difference. Bar lengths are comparable only because all values use the same million MMBtu unit. They should not be visually compared with physical-unit charts from other EIA series, where the numbers may represent barrels, short tons, or another fuel-specific unit.
Strengths and limitations
A major strength of the series is consistent coverage: all 50 states plus the District of Columbia have reported 2024 values under the same annual definition, with no missing observations. That makes the series well suited to a state-by-state distribution analysis. Its main limitation is aggregation. The AOR category combines renewable sources, so the total does not identify the technology responsible for a state’s position. It also does not report cost, emissions, capacity factor, or economic performance. Those require separate measures. The useful question answered here is narrower: where was combined renewable energy consumption for electricity generation and useful thermal output largest within the Electric Power sector?
Taken together, the 2024 observations show a concentrated but geographically diverse pattern. Texas led with 566.833 million MMBtu and 21.14% of the simple state-level sum, California ranked second, and Iowa ranked third. The top three represented 38.70%, and the top ten represented 62.41%. At the same time, the median of 30.591 million MMBtu shows that a typical jurisdiction was far below the largest values. The central interpretive rule is to keep the metric attached to the ranking: this is renewable energy consumption in Btu for electricity generation plus useful thermal output within Electric Power, not a ranking of renewable electricity generation itself.
Frequently Asked Questions
Does this metric measure renewable electricity generation?
No. It is EIA total-consumption-btu for renewable energy used by the Electric Power sector for electricity generation and useful thermal output, measured in million MMBtu.
What does Texas’s 21.14% share mean?
It is Texas's share of the simple sum of the 51 published state-level observations. It is not a renewable share of total U.S. energy use or an electricity-market share.
What does AOR mean in the EIA series?
AOR is the EIA fuel category for all renewables. It combines multiple renewable sources, so fuel-specific series are needed to identify the contribution of individual technologies.
Are any state values missing or zero?
No. All 50 states and the District of Columbia have positive 2024 values in this series.
Related Articles
Green Map creates custom-edited map images using open geographic data sources such as geoBoundaries, Natural Earth, OpenStreetMap, and government open data. These maps are edited visual materials, not raw data files, and are provided for education, documents, presentations, and graphic reference.