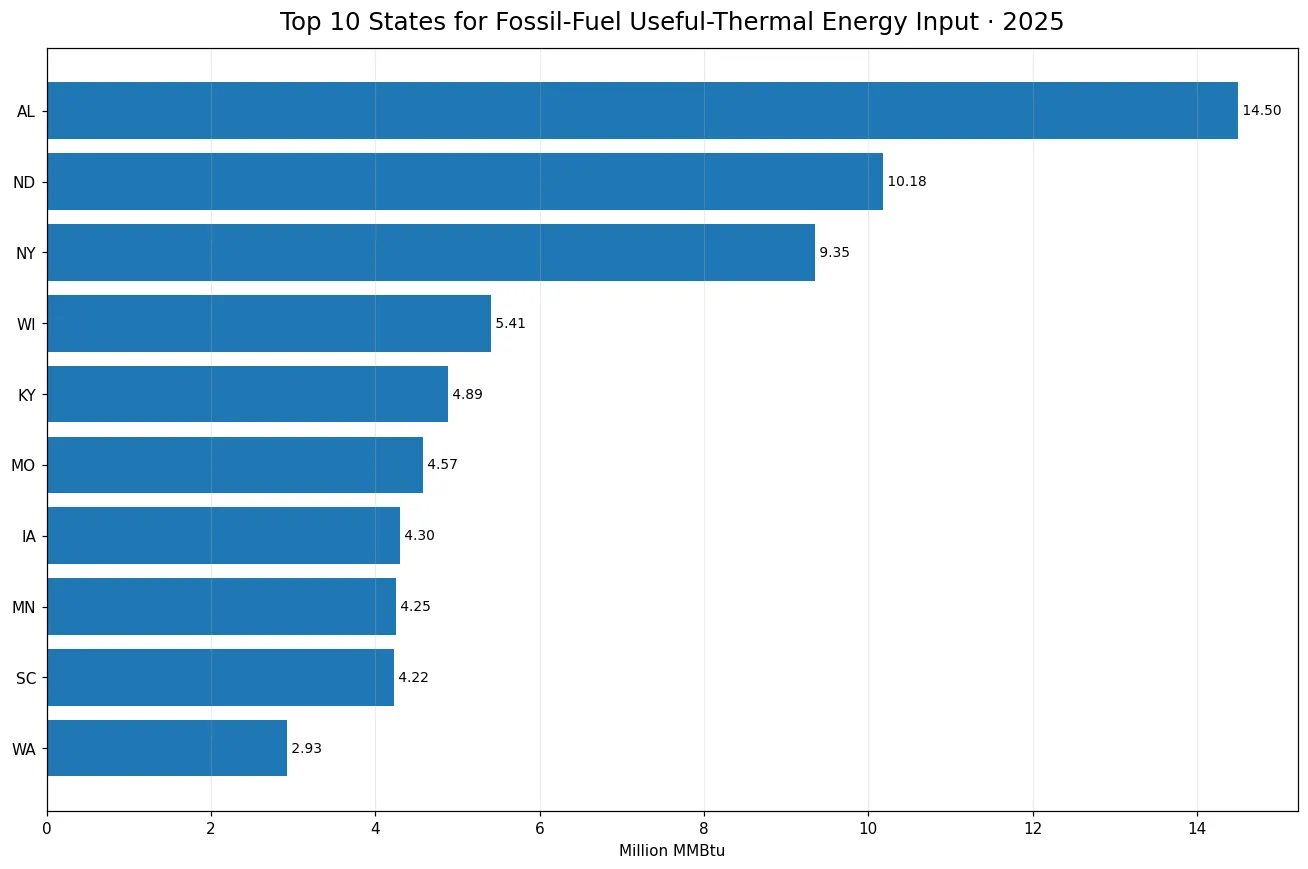
Alabama reported the largest 2025 fossil-fuel energy input for useful thermal output within EIA sector 90, Electric Power Sector Non-CHP. Its value was 14.50385 million MMBtu, followed by North Dakota at 10.18024 and New York at 9.35366. Across the 50 states, the series sums to 75.60187 million MMBtu. The top three states therefore account for 45.02% of the state total, while 28 states report exactly zero. Every state has a numeric observation, so those zeros are not missing entries.
The scope is narrow and should stay narrow. Fueltypeid FOS is the fossil-fuel grouping, sectorid 90 is Electric Power Sector Non-CHP, and consumption-uto-btu is the field for fuel energy used for useful thermal output. The unit is million MMBtu. These numbers do not represent fossil-fuel electricity generation, total fossil-fuel use across the economy, or electrical output in megawatt-hours. They measure energy input for one specific output category inside one specific EIA sector definition.
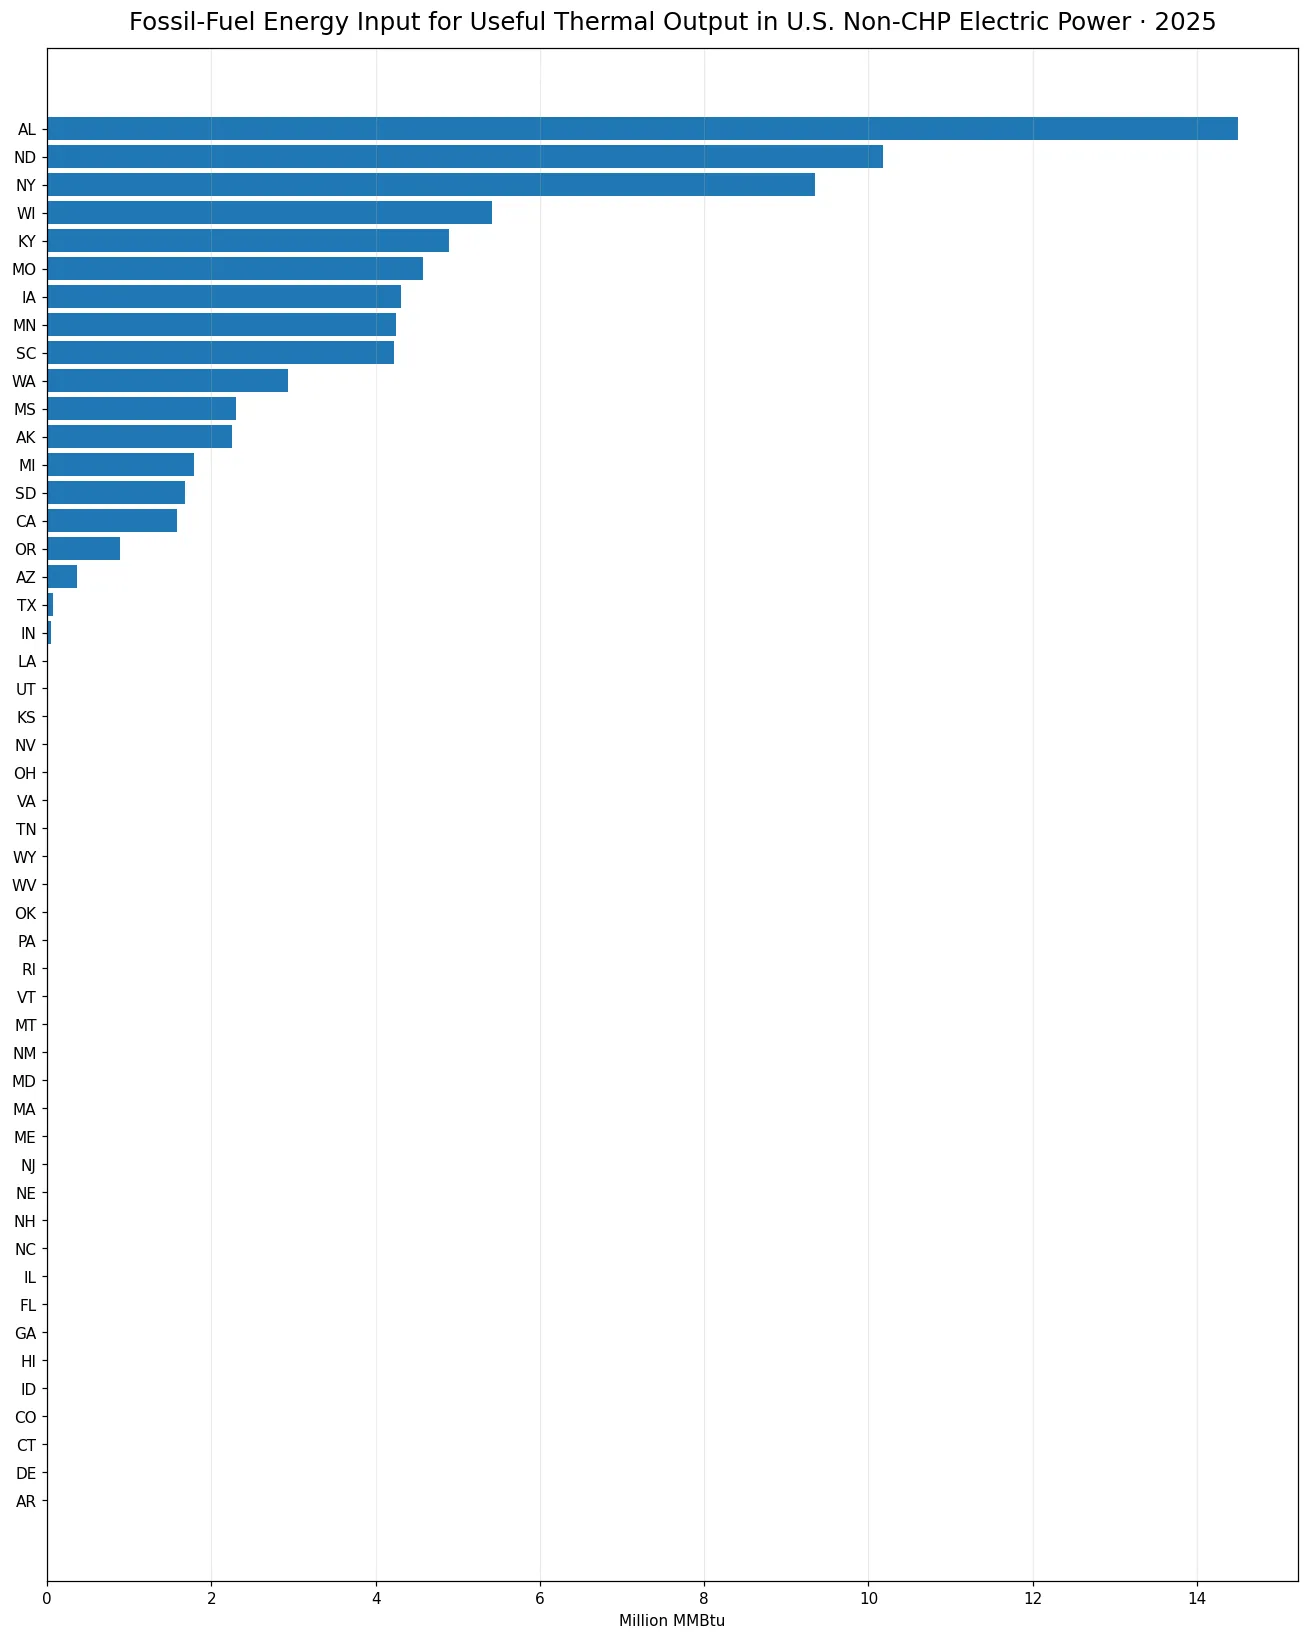
Table of Contents
Alabama led a highly concentrated state distribution
Alabama represented 19.18% of the 50-state total. North Dakota contributed 13.47% and New York 12.37%. Their combined 34.03775 million MMBtu is nearly half of the full state sum. Wisconsin ranked fourth at 5.41000 million MMBtu, or 7.16%, and Kentucky ranked fifth at 4.88752, or 6.46%. Missouri, Iowa, Minnesota, and South Carolina each exceeded 4 million MMBtu, while Washington completed the top ten at 2.92825.
The top ten states together account for 85.46% of the sum. That concentration is important because a national average alone would conceal the shape of the distribution. The mean is about 1.51204 million MMBtu, yet the median is zero. A reader looking only at the mean could imagine a modest positive value in a typical state, even though more than half the states in this series are recorded at zero.
Twenty-two states were positive and twenty-eight were exactly zero
Only 22 of the 50 states have values above zero. The remaining 28 states are reported as exactly 0.00000. There are no missing observations in the series. A zero is therefore a substantive value under this metric-year-sector combination, not a placeholder for unavailable information. Replacing those zeros with estimated values or treating them as blank observations would alter the published pattern.
This distinction also affects summary statistics. Because more than half the states are zero, the median is zero and the lower half of the distribution is compressed at the floor. The positive observations range from very small values, such as 0.03075 million MMBtu in Vermont, to Alabama’s 14.50385. It is more informative to report the number of positive states, the number of zeros, and the concentration among leaders than to rely on one central average.
| State | Million MMBtu | Share |
|---|---|---|
| Alabama | 14.50385 | 19.18% |
| North Dakota | 10.18024 | 13.47% |
| New York | 9.35366 | 12.37% |
| Wisconsin | 5.41000 | 7.16% |
| Kentucky | 4.88752 | 6.46% |
| Missouri | 4.57378 | 6.05% |
| Iowa | 4.30244 | 5.69% |
| Minnesota | 4.25047 | 5.62% |
| South Carolina | 4.22043 | 5.58% |
| Washington | 2.92825 | 3.87% |
Million MMBtu measures fuel energy input, not electricity output
MMBtu is an energy-content unit. The EIA field consumption-uto-btu expresses the energy contained in fuels used for useful thermal output, aggregated here in millions of MMBtu. It is not interchangeable with MWh. Converting fuel input into electrical output would require additional information about technology, efficiency, and how the energy was used. The present series does not supply those conversion assumptions.
The distinction matters when comparing this article with net-generation statistics. A state can have a large fuel input in one operational category without occupying the same position in a generation ranking. Generation fields describe electricity produced; consumption fields describe fuel or energy used. Keeping the numerator and unit explicit prevents a ranking of inputs from being mistaken for a ranking of outputs.
FOS is a fuel grouping rather than a single fuel
FOS identifies the fossil-fuel grouping used in this EIA slice. The value does not state how much of a state’s total came from coal, natural gas, petroleum, or another component of the broader fossil grouping. A state with a high FOS value could have a very different underlying fuel mix from another state with a similar total. The aggregate is useful for comparing the grouped energy input, but it does not support claims about the dominant individual fuel without a more detailed series.
That limitation is especially important when interpreting differences among Alabama, North Dakota, New York, and the other leaders. The numbers establish the size of the grouped input under the same sector and field, but they do not identify a common operational explanation. Fuel composition, facility type, operating schedules, and reporting characteristics can differ. Those questions require additional EIA dimensions rather than inference from the aggregate alone.
Sector 90 is not the entire electric-power system
EIA sector 90 is labeled Electric Power Sector Non-CHP. It is therefore a bounded part of the electric-power data system. It should not be renamed as all U.S. electric power, all utility operations, or all energy use in a state. CHP categories and other sector definitions appear separately in EIA operational data. A close comparison between series is valid only when the sector identity is kept constant or the difference is explicitly explained.
Useful thermal output can sound closely associated with CHP, so the sector label deserves particular attention here. The safe reading is simply that EIA reports these values under sector 90 and the consumption-uto-btu field. The series itself does not provide enough evidence to explain the specific operational arrangements behind every positive state observation. It is better to preserve the official dimensions than to invent a plant-level narrative.
Similar EIA fields answer different questions
Three related BTU fields can appear nearly identical in a title but measure different slices. total-consumption-btu covers total fuel-energy consumption in the selected sector, consumption-for-eg-btu isolates fuel energy used for electricity generation, and consumption-uto-btu isolates fuel energy used for useful thermal output. The current article is about the third field only. Treating the three as duplicates would erase a meaningful distinction in energy use.
The same warning applies to the generation field. Net generation is reported in thousand MWh and measures output, whereas this series is a fuel-energy input measured in million MMBtu. A state can rank differently across these measures because they describe different parts of the energy conversion process. The field name is therefore as important as the fuel and sector labels when deciding whether two EIA articles are actually about the same metric.
The top ten account for most of the observed total
The ten highest states sum to about 64.60864 million MMBtu, equal to 85.46% of the 50-state total. Alabama alone is nearly five times Washington, the tenth-ranked state. North Dakota and New York each exceed Washington by more than three times. This steep drop within the top ten reinforces the conclusion that the distribution is not merely concentrated between positive and zero states; it is also uneven among the positive leaders.
Concentration does not by itself indicate efficiency, policy success, cost, or environmental performance. A high absolute fuel-energy input may reflect scale, operating patterns, equipment, or other factors that this series does not isolate. The data are suitable for describing where the reported energy input is largest under the fixed EIA definition, but causal explanations should be supported by separate operational and economic information.
This is a 2025 snapshot rather than a long-term trend
All observations refer to the 2025 annual period. The chart can show the cross-state structure for that year, but it cannot establish whether Alabama has consistently ranked first, whether North Dakota recently increased, or whether a zero state had positive values in earlier years. Those are time-series questions and require the same field, sector, fuel grouping, and unit across multiple years.
For trend work, consistency of identity matters more than simply matching the topic words. Changing sector 90 to another sector, replacing FOS with an individual fuel, or switching from consumption-uto-btu to total-consumption-btu creates a different series. Year-to-year comparisons should preserve all of those dimensions so that the observed change represents time rather than a change in statistical definition.
How to read the chart without overreaching
Three checks are enough to avoid most misreadings. First, read the unit as million MMBtu and not MWh. Second, keep sector 90 in the interpretation rather than expanding it to every power-sector activity. Third, preserve reported zeros as zeros. With those constraints, the chart supports clear statements about which states have the largest recorded useful-thermal fossil-fuel inputs and how concentrated the distribution is.
It does not by itself answer why one state is high, whether a state is more efficient, what emissions resulted, or whether fuel costs were favorable. Those questions require other datasets. The value of this series is precision: it provides a directly comparable annual observation for every state under one fixed EIA definition, allowing the geographic pattern to be described without substituting assumptions for evidence.
Frequently Asked Questions
Which state had the largest fossil-fuel energy input for useful thermal output in 2025?
Alabama led with 14.50385 million MMBtu, equal to 19.18% of the 50-state sum.
Are the 28 zero values missing observations?
No. All 50 states have numeric observations; 28 are reported as exactly zero and none is missing.
Does this measure fossil-fuel electricity generation?
No. consumption-uto-btu measures fuel energy used for useful thermal output in million MMBtu, not electricity output in MWh.
What does EIA sector 90 mean?
Sector 90 is Electric Power Sector Non-CHP. CHP and other sector definitions are outside this series.
Related Articles
Green Map creates custom-edited map images using open geographic data sources such as geoBoundaries, Natural Earth, OpenStreetMap, and government open data. These maps are edited visual materials, not raw data files, and are provided for education, documents, presentations, and graphic reference.