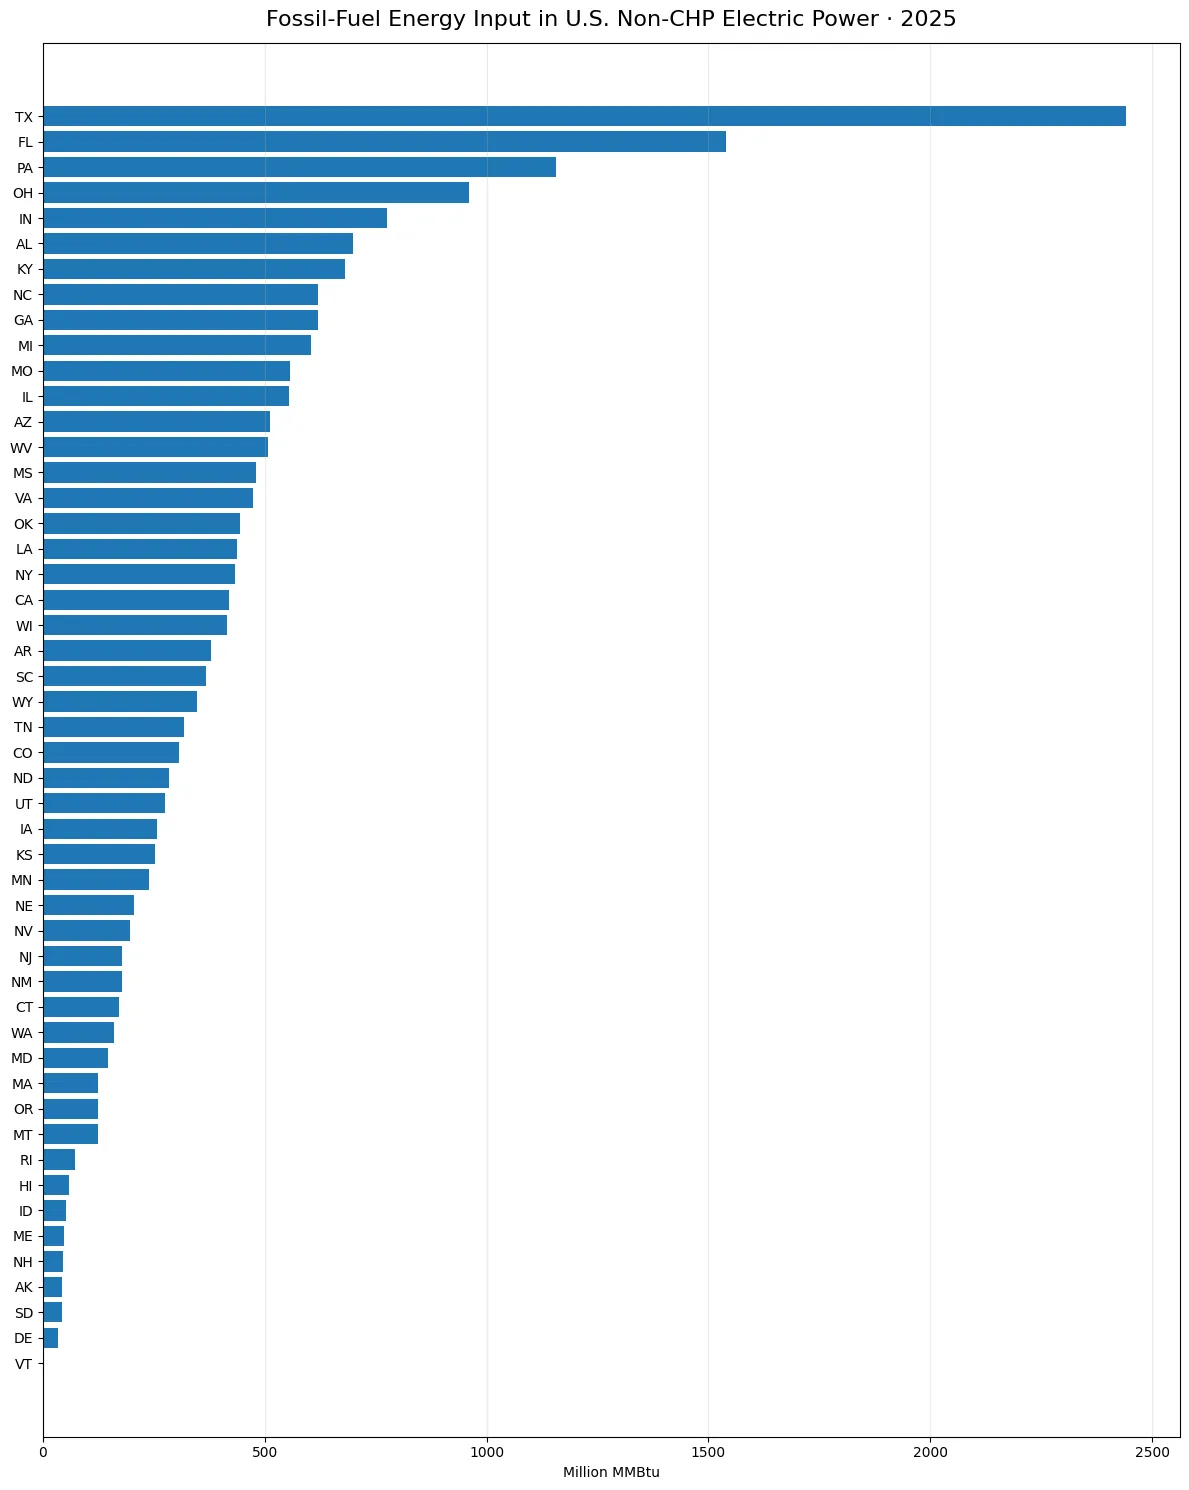
In 2025, Texas recorded the largest fossil-fuel energy input in the U.S. Electric Power Sector Non-CHP segment at 2,440.966 million MMBtu. Florida followed at 1,538.841 million MMBtu and Pennsylvania at 1,157.186. The simple sum across the 50 states was 20,352.087 million MMBtu, placing Texas at 11.99% of that state-level total. The measure is not electricity generation: it is the energy content of fossil fuels consumed for electricity generation and useful thermal output under EIA sector 90.
The source is the U.S. Energy Information Administration electric-power operational data for annual 2025 observations, using FOS, sector 90, total-consumption-btu, and million MMBtu consistently across all 50 states.
Table of Contents
What the 2025 measure covers
The 2025 observation uses EIA fuel category FOS, sector 90, and the field total-consumption-btu. FOS groups fossil fuels, while sector 90 identifies the Electric Power Sector Non-CHP segment. The unit is million MMBtu. The measure therefore represents the energy content of fossil fuels consumed for electricity generation plus useful thermal output within that non-CHP electric-power segment. It is not net generation, capacity, fuel volume, or a measure of household and industrial fossil-energy demand.
The Non-CHP qualifier matters because EIA separates combined heat and power activity from other electric-power operations. A state can rank differently when CHP is included or when only fuel used for electricity generation is counted. Keeping fuel, sector, field, year, and unit together prevents a superficially similar series from being treated as the same statistic.
Texas was far ahead of the next states
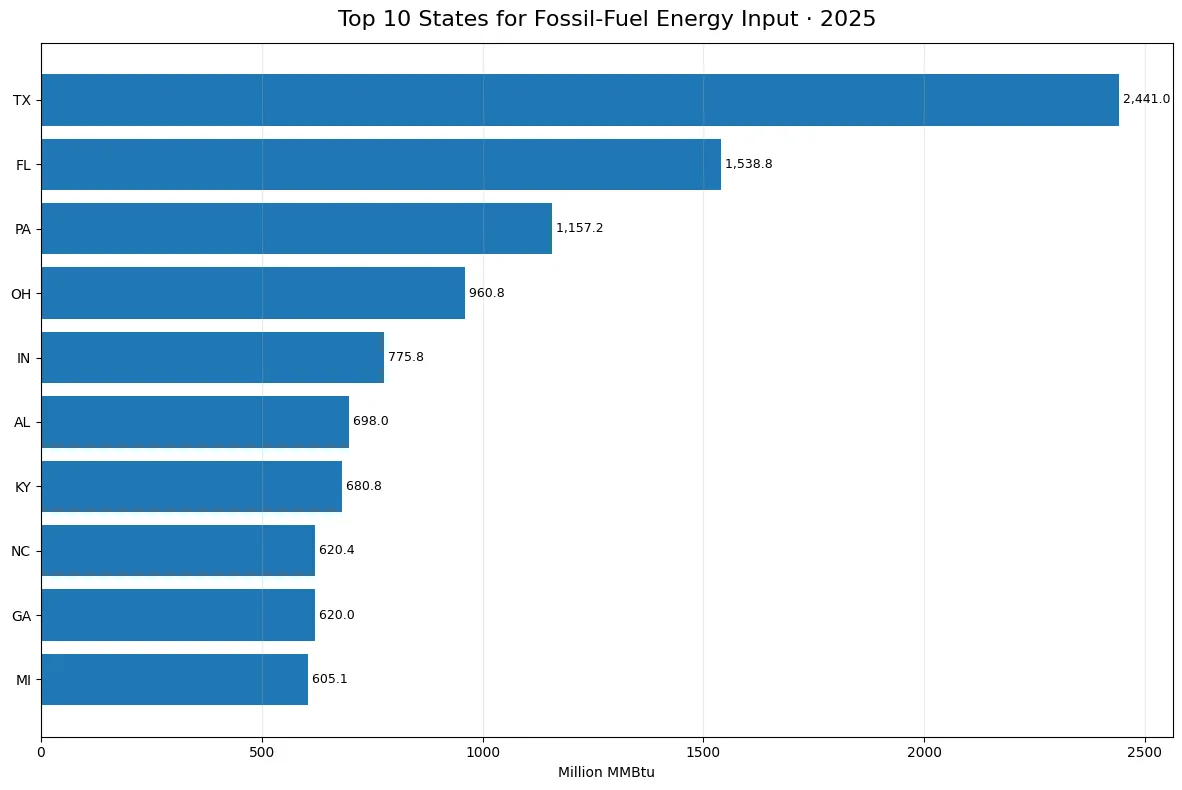
Texas recorded 2,440.966 million MMBtu, equal to 11.99% of the simple sum across the 50 states. Florida followed with 1,538.841 million MMBtu, or 7.56%, and Pennsylvania had 1,157.186 million MMBtu, or 5.69%. Together those three states represented 25.24% of the state-level sum. The gap between Texas and Florida was about 902.125 million MMBtu, showing that the leading state stood well above the rest of the distribution.
Ohio ranked fourth at 960.797 million MMBtu, followed by Indiana at 775.767, Alabama at 697.981, Kentucky at 680.781, North Carolina at 620.444, Georgia at 619.964, and Michigan at 605.126. Those ten states together accounted for 49.62% of the total of the reported state observations. That percentage is useful for describing concentration inside this series, but it is not a share of national final energy use or electricity sales.
| State | Code | Million MMBtu | Share of 50-state total |
|---|---|---|---|
| Texas | TX | 2,440.966 | 11.99% |
| Florida | FL | 1,538.841 | 7.56% |
| Pennsylvania | PA | 1,157.186 | 5.69% |
| Ohio | OH | 960.797 | 4.72% |
| Indiana | IN | 775.767 | 3.81% |
| Alabama | AL | 697.981 | 3.43% |
| Kentucky | KY | 680.781 | 3.35% |
| North Carolina | NC | 620.444 | 3.05% |
| Georgia | GA | 619.964 | 3.05% |
| Michigan | MI | 605.126 | 2.97% |
The distribution is strongly right-skewed
The mean across the 50 states was 407.042 million MMBtu, while the median was 311.712. The first quartile was 150.055 and the third quartile was 511.560 million MMBtu. The mean sits noticeably above the median because a small group of very large observations pulls the average upward. For a typical-state comparison, the median therefore gives a different perspective than the mean.
This shape is also why a ranking alone can hide useful context. A state near the middle of the list is much closer to the national median than to Texas. Looking at the median, interquartile range, and top-ten concentration together makes it easier to distinguish a broad middle from the high-end tail.
The lower end reaches almost zero without missing observations
Vermont had the smallest value at 0.119 million MMBtu. Delaware was next at 33.689, followed by South Dakota at 42.882, Alaska at 43.253, New Hampshire at 44.211, Maine at 48.485, Idaho at 51.978, Hawaii at 59.184, Rhode Island at 71.141, and Montana at 122.995. The distance between the highest and lowest observations is therefore extremely large.
None of the 50 state observations is missing and none is exactly zero. Vermont’s small value should consequently be read as a reported positive observation rather than a substitute for unavailable information. At the same time, a low value does not mean that a state has no fossil-fuel electricity generation. The scope is restricted to this particular EIA fuel-sector-field combination.
Fuel input and electricity output answer different questions
Net generation is commonly reported in MWh and describes electricity produced. This series is reported in MMBtu and describes the energy content of fuel consumed. Conversion efficiency, operating conditions, and plant technology can affect how much electricity is produced from a given energy input. A state’s percentage of fossil-fuel input therefore need not match its percentage of fossil-fuel generation.
EIA also publishes fields such as consumption-for-eg-btu, which focuses on fuel used for electricity generation. The field used here, total-consumption-btu, includes fuel used for electricity generation and useful thermal output. Those fields may produce similar values in some states, but they are definitionally different and should remain separate in comparisons.
Why this is not a duplicate of the non-CHP generation-input series
A related 2025 non-CHP series measures fuel energy used specifically for electricity generation. This observation uses total consumption, so it covers electricity generation plus useful thermal output. The distinction is small in wording but important analytically: one isolates the generation input, while the other retains the broader total for the specified non-CHP electric-power segment.
The fuel category is also an aggregate. FOS combines fossil fuels rather than identifying one fuel such as coal, natural gas, or petroleum. A high state value cannot be attributed to a single fossil fuel without examining fuel-specific observations under the same sector and field conditions.
How to read the top-ten shares
The percentages in the table use the sum of the 50 state observations as the denominator. Texas contributes 11.99%, Florida 7.56%, and Pennsylvania 5.69%. The top five states together contribute about 33.77%, and the top ten contribute 49.62%. These figures show concentration within this state-level series and allow states to be compared on a common basis.
They should not be relabeled as electricity-market shares, fossil-generation shares, or shares of all U.S. fossil-energy use. Those concepts use different denominators. The safest description is a share of the summed state observations for EIA total-consumption-btu under FOS and sector 90 in 2025.
Geography alone does not explain the ranking
The upper group includes states from several regions: Texas and Florida in the South, Pennsylvania and Ohio in the East and Midwest, and Indiana, Alabama, Kentucky, North Carolina, Georgia, and Michigan across a broad industrial and power-system geography. That mix shows why a single regional explanation would be incomplete.
Power demand, generation fleet composition, fuel availability, plant efficiency, imports and exports of electricity, maintenance schedules, and the role of other generating technologies can all affect state-level fuel input. This one measure does not isolate those causes. It is best used to identify where the energy input was large before turning to additional indicators for explanation.
A single year is a snapshot rather than a permanent ranking
The observations refer to 2025. Fuel prices, weather, plant retirements and additions, outages, demand, and dispatch conditions can change from year to year. Texas being first in 2025 does not establish that it will always rank first, and a state’s position can shift even if its long-run electricity system changes gradually.
For trend analysis, the same EIA fuel category, sector, field, and unit should be followed across multiple years. Mixing total-consumption-btu with generation-only input or with net generation can create an apparent change that is partly a change in definition rather than a change in the underlying activity.
What the charts reveal
The full-state chart highlights the long upper tail, with Texas extending far beyond the central cluster. Florida and Pennsylvania form the next tier, followed by a group of states below one thousand million MMBtu. The top-ten view makes the spacing among the leading states easier to see and shows that the decline is gradual after the first three.
Every bar uses the same million-MMBtu unit, so lengths are directly comparable within these charts. They are not directly comparable with a chart reported in barrels, short tons, physical units, or MWh. Checking the unit is essential when moving between EIA energy series.
Strengths and limits of the state comparison
The principal strength is consistency: all 50 states are reported for the same year, fuel group, sector, field, and unit. There are no missing values to impute and no zero values to reinterpret. This makes descriptive statistics such as the median, quartiles, and concentration ratios straightforward to calculate.
The main limitation is aggregation. FOS bundles several fossil fuels, and sector 90 covers a defined part of electric-power activity. The series does not tell us which individual fuel drove each state’s value, how efficiently the fuel was converted, or what emissions resulted. Those questions require fuel-specific, generation, plant, or emissions measures.
Three points to keep in view
First, Texas had the largest 2025 fossil-fuel energy input in the Non-CHP Electric Power segment, followed by Florida and Pennsylvania. Second, the top ten states accounted for just under half of the sum of the 50 observations. Third, the measure is fuel energy input for electricity generation plus useful thermal output, not electricity generation itself.
Those distinctions make the series useful without overstating what it can prove. For electricity output, a net-generation measure is the appropriate companion. For generation-only fuel input, consumption-for-eg-btu is the closer match. For the broader energy input covered here, total-consumption-btu is the relevant field.
Frequently Asked Questions
Does this measure fossil-fuel electricity generation?
No. It measures the energy content of fossil fuels consumed for electricity generation and useful thermal output in EIA sector 90, in million MMBtu.
What does sector 90 mean?
It is Electric Power Sector Non-CHP, separated from combined heat and power activity.
What does the Texas share of 11.99% represent?
It is Texas’s share of the simple sum of the 50 state observations for this exact 2025 series, not a national electricity-market share.
Are there missing or zero observations?
No. All 50 states have positive reported values; Vermont is the smallest at 0.119 million MMBtu.
Related Articles
Green Map creates custom-edited map images using open geographic data sources such as geoBoundaries, Natural Earth, OpenStreetMap, and government open data. These maps are edited visual materials, not raw data files, and are provided for education, documents, presentations, and graphic reference.