UNESCO Institute for Statistics data for 2024 show a sharply uneven picture of computer availability in primary schools. Among the 105 countries and territories with an observation, 51 report that 100% of primary schools have access to computers for pedagogical purposes, while 23 are below 50%. The lowest value is 0.75% in Burkina Faso, yet the median is 99.73%. That combination—a median near universal access alongside a long low-access tail—is the central feature of the dataset.
The indicator measures the proportion of primary schools with access to computers for teaching or other pedagogical purposes. It does not measure computers per student, whether every classroom has a device, internet quality, hardware age, or how frequently teachers and pupils actually use computers. A reported value of 100% therefore means school-level access is universal under this indicator, not that every child has a personal computer.
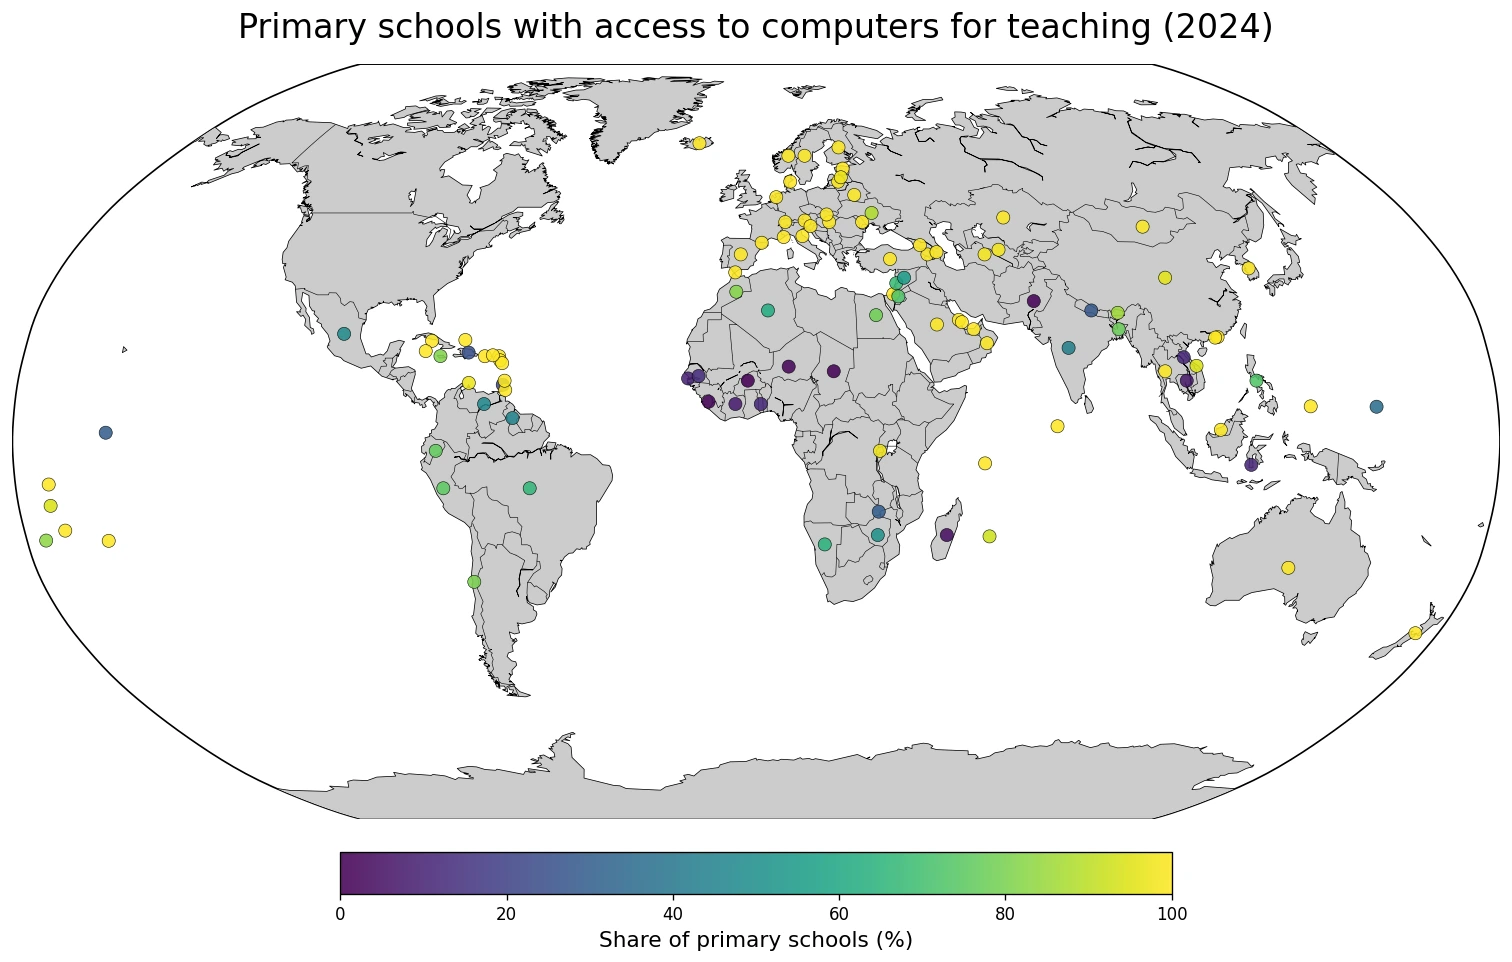
Table of Contents
A striking 51 observations are exactly 100%
51 of the 105 observations are exactly 100%, or about 48.6% of the dataset. Because so many countries tie at the ceiling, a conventional top-ten ranking would add little information. Examples of 100% observations span several regions, including Australia, Austria, the United Arab Emirates, Armenia, Bahrain, Belarus, Denmark, Finland, Iceland, Israel, Malaysia, and New Zealand.
The upper end is broader than the exact 100% group. 61 observations are at or above 95%, 64 are at or above 90%, and 74 are at or above 75%. This shows that school-level access is already close to universal in much of the observed group. At the same time, the mean is only 77.30%, far below the median of 99.73%, because a smaller set of very low values pulls the average downward.
Twenty-three countries and territories are below 50%
23 observations fall below 50%, including 15 below 25% and 9 below 10%. Burkina Faso is at 0.75%, Chad at 0.82%, Pakistan at 1.03%, Sierra Leone at 1.56%, and Niger at 2.30%. Madagascar is at 3.94%, Cambodia at 7.28%, and Côte d’Ivoire at 8.03%. These figures are not small deviations from the median; they represent a fundamentally different level of school infrastructure coverage.
| Low-end order | Country or territory | Primary schools with teaching-computer access |
|---|---|---|
| 1 | Burkina Faso | 0.75% |
| 2 | Chad | 0.82% |
| 3 | Pakistan | 1.03% |
| 4 | Sierra Leone | 1.56% |
| 5 | Niger | 2.30% |
| 6 | Madagascar | 3.94% |
| 7 | Cambodia | 7.28% |
| 8 | Côte d’Ivoire | 8.03% |
| 9 | Gambia | 9.97% |
| 10 | Lao People’s Democratic Republic | 11.13% |
| 11 | Indonesia | 11.39% |
| 12 | Togo | 11.41% |
| 13 | Senegal | 12.54% |
| 14 | Grenada | 22.08% |
| 15 | Dominican Republic | 24.82% |
The low-access group is geographically varied. Several of the smallest values are in West Africa and the Sahel, but the group below 50% also includes countries in South Asia, Southeast Asia, the Caribbean, and the Pacific. Pakistan and Nepal, Cambodia, Laos and Indonesia, Grenada and the Dominican Republic, and Kiribati and Micronesia all appear below the halfway point. The map therefore supports country-level comparison rather than a simple continent-wide label.
The distribution is concentrated at both the top and the lower tail
Grouping the observations into broad bands makes the structure clearer. The single largest group is the exact-100% category, while a substantial low-access group remains at the other end.
| Share of primary schools | Countries or territories | Share of observations |
|---|---|---|
| 0–24.9% | 15 | 14.3% |
| 25–49.9% | 8 | 7.6% |
| 50–74.9% | 8 | 7.6% |
| 75–89.9% | 10 | 9.5% |
| 90–94.9% | 3 | 2.9% |
| 95–99.9% | 10 | 9.5% |
| 100% | 51 | 48.6% |
The 51 exact-100% observations plus the 10 observations between 95% and 99.9% bring the total at or above 95% to 61. At the other end, 15 observations are below 25%. This split is important because a global summary such as ‘most countries are well equipped’ would be technically incomplete: it describes the upper majority but obscures the depth of the shortfall in the lower tail.
The 50% to 90% range contains many different stages of access
The middle range includes Zimbabwe at 50.26%, Syria at 55.05%, Algeria at 61.26%, Namibia at 64.17%, Brazil at 66.31%, Lebanon at 68.06%, Jordan at 72.56%, and the Philippines at 72.67%. Between 75% and 90% are Peru at 75.00%, Ecuador at 76.11%, Bangladesh at 77.50%, Egypt at 78.45%, Chile at 79.75%, Jamaica at 81.04%, Morocco at 82.02%, Tonga at 82.95%, Bhutan at 85.71%, and Ukraine at 88.24%.
It is tempting to treat those percentages as a simple ladder of digital development, but the indicator does not support that conclusion by itself. Countries differ in the number and distribution of primary schools, rural access, electricity supply, connectivity, equipment maintenance, and statistical systems. The measure is best used to identify how widespread basic computer access is at the school level, not to assign a complete digital-readiness score.
Universal school access does not mean equal access inside schools
A school can count as having access to computers even if the number of devices is small relative to enrolment. A 100% national value can coexist with shortages of devices, old hardware, limited timetabling, weak internet connections, or unequal access between pupils. Conversely, a country below 50% may still have well-equipped schools within the covered portion of its system.
A fuller digital-learning comparison would need additional measures such as internet connectivity, reliable electricity, devices per pupil, teacher digital skills, and actual classroom use. Those indicators answer different questions. School access is a necessary piece of infrastructure information, but it is not a direct measure of learning outcomes or the quality of technology-supported teaching.
Why the mean and median tell different stories
The mean is 77.30% while the median is 99.73%. This large gap appears because more than half of the observations are near the top of the scale, while a smaller group extends all the way down to values around 1%. Very low observations such as Burkina Faso, Chad, Pakistan, Sierra Leone, and Niger pull the mean down much more than they affect the median.
The middle 50% of observations ranges from 64.17% to 100.00%. The lower-quartile boundary is only about 64%, while the upper-quartile boundary is 100%. That wide span reinforces why a single average cannot adequately describe the dataset. The more informative story is a large group at or near universal access alongside a smaller but severe low-access group.
How to read the map correctly
The map uses one representative point for each country or territory with a 2024 observation. The point size does not represent land area, population, enrolment, or the number of schools. Small island territories and large countries are therefore visible on the same basis. Places with no included 2024 value are not assigned zero and are left unplotted.
The national percentage also summarizes school systems of very different sizes. A 100% value in a system with a small number of primary schools and a 100% value in a system with tens of thousands of schools are equal as percentages but not as counts. The map answers a country-level coverage question; it is not a map of the percentage of all primary schools worldwide that have computers.
Data scope and source
The comparison uses 2024 national-level observations from the UNESCO Institute for Statistics official indicator SCHBSP.1.WCOMPUT. The dataset contains 105 countries and territories, and the unit is percent of primary schools. The mean, median, ranges, and group counts in this analysis are calculated across those 105 observations only.
Countries without an included 2024 observation should not be interpreted as having zero access. The indicator is useful for comparing the reach of basic school computer infrastructure, but it is not a complete global census of every primary school system. Small differences near the top of the scale should also be interpreted cautiously; the strongest signals are the broad coverage bands and the large gaps between the high- and low-access groups.
The clearest takeaway
In 2024, 51 of the observed countries and territories report universal school-level access to computers for pedagogical purposes, yet 23 remain below 50%. The full range stretches from 0.75% to 100%. That combination suggests two realities at once: basic computer access is nearly universal across a large part of the observed group, while a meaningful minority still faces very large school-level infrastructure gaps. The map and distribution are therefore more informative together than either a global average or a simple ranking.
Frequently Asked Questions
Does 100% mean every primary-school student has a computer?
No. It means all primary schools covered by the indicator have access to computers for pedagogical purposes. It does not measure devices per pupil or actual frequency of use.
How many observations are below 50% in 2024?
23 of the 105 countries and territories with a 2024 observation are below 50%, and 15 are below 25%.
Do countries missing from the map have zero computer access?
No. A missing point means there is no included 2024 observation in this comparison; missing values are not converted to zero.
Related Maps
Green Map creates custom-edited map images using open geographic data sources such as geoBoundaries, Natural Earth, OpenStreetMap, and government open data.
These maps are edited visual materials, not raw data files, and are provided for education, documents, presentations, and graphic reference.