
Countries differ widely in how strongly biodiversity appears in their official curriculum frameworks and subject curricula. In the 2023 UNESCO Institute for Statistics dataset used here, the biodiversity greening-education score ranges from 7.0 in Romania to 74.6 in Honduras across 100 countries. The median is 34.7, while the mean is 36.2. The middle half of observations lies between 22.8 and 48.8, showing that the spread is substantial even before the highest and lowest cases are considered.
This is not a test of what students know about biodiversity. It is a curriculum-content indicator. UNESCO’s Greening Curriculum Indicator examines how green themes are incorporated into national curriculum frameworks and planned science and social-science curricula, with separate attention to environment and sustainability, climate change, and biodiversity. The SGE.BIODIV series used here is the biodiversity theme. A higher score therefore means biodiversity content is more strongly represented in the official curriculum documents covered by the methodology, not that classroom implementation or student learning is automatically stronger.
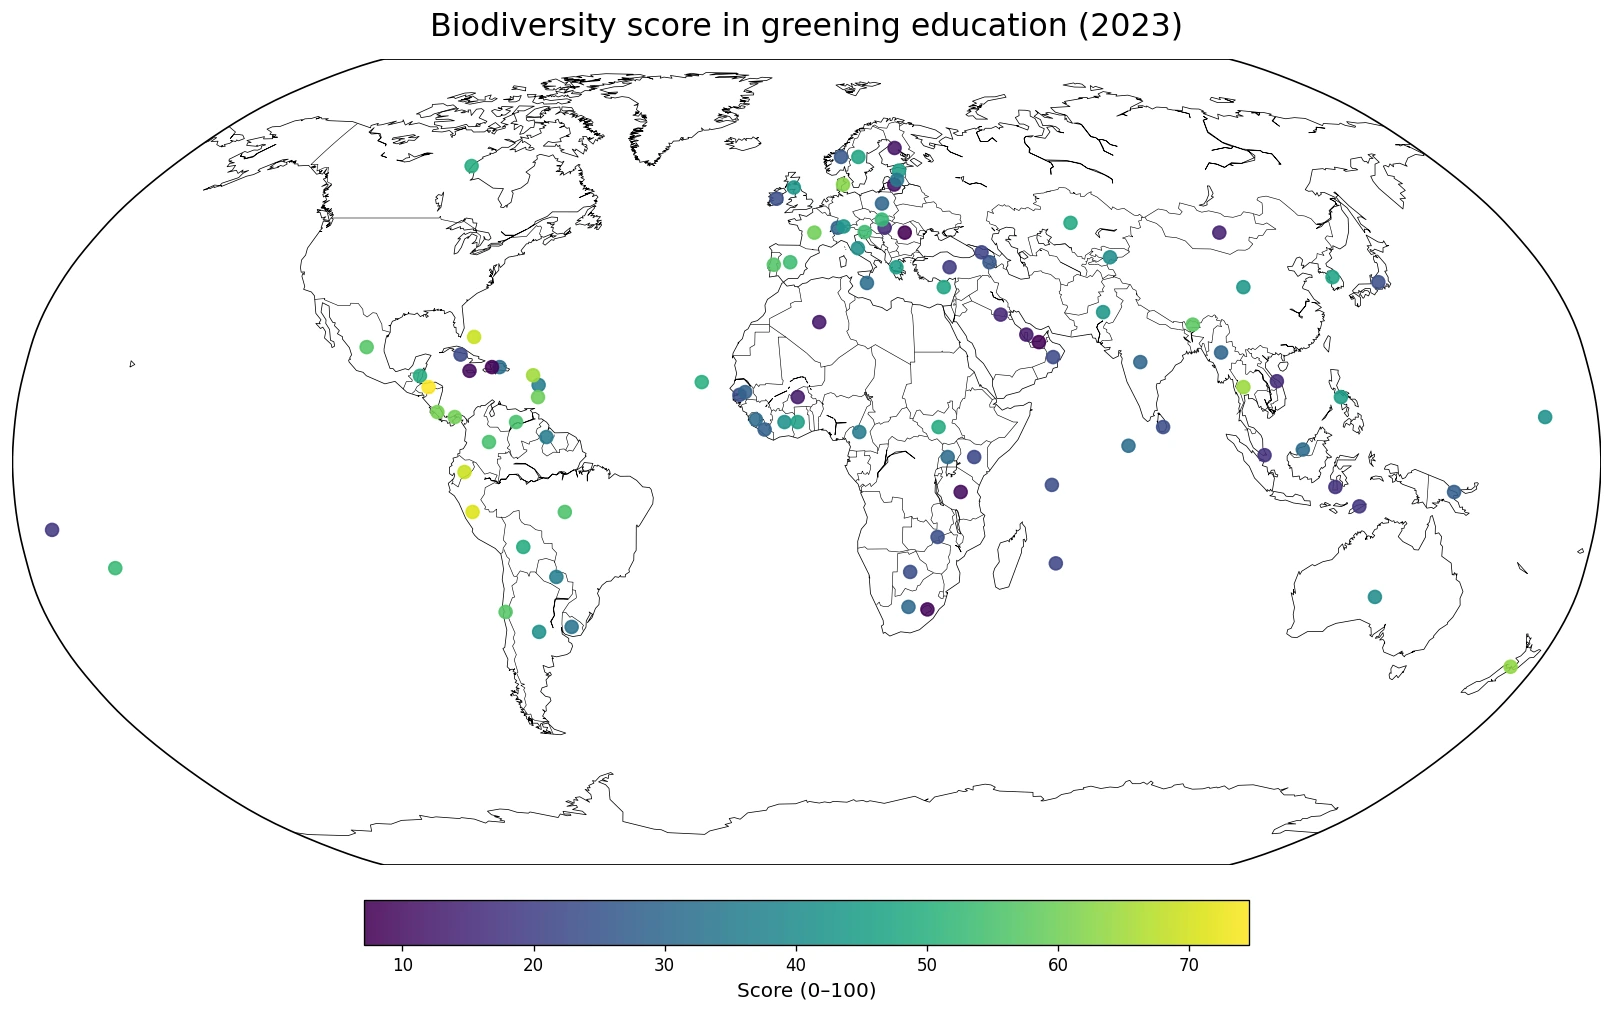
Table of Contents
Scores range from single digits to the mid-70s
The distribution is broad. 20 countries score below 20, 35 are from 20 to under 40, 34 are from 40 to under 60, and 11 reach 60 or higher. Only 2 countries are at or above 70, while 7 are below 10. Most observations therefore sit in the middle bands, but the tails are large enough that a single global average does not describe the country pattern very well.
The median of 34.7 is slightly below the mean of 36.2. High scores in Honduras, Peru, Ecuador and several other countries pull the average upward, but the dataset is not concentrated near the top. The 25th percentile is 22.8 and the 75th percentile is 48.8, a gap of roughly 26 points across the middle half of countries.
Latin America and the Caribbean are prominent near the top
Seven of the ten highest observations are in Latin America or the Caribbean: Honduras, Peru, Ecuador, the Bahamas, Saint Kitts and Nevis, Costa Rica, and Panama. Thailand, New Zealand, and Denmark complete the top ten. This does not mean that every country in the region scores highly, but it is a visible geographic pattern in the 100-country sample.
| Rank | Country | Biodiversity score |
|---|---|---|
| 1 | Honduras | 74.6 |
| 2 | Peru | 70.9 |
| 3 | Ecuador | 69.1 |
| 4 | Bahamas | 69.1 |
| 5 | Saint Kitts and Nevis | 65.1 |
| 6 | Thailand | 64.4 |
| 7 | New Zealand | 63.4 |
| 8 | Denmark | 62.4 |
| 9 | Costa Rica | 60.6 |
| 10 | Panama | 60.1 |
Honduras leads with 74.6, followed by Peru at 70.9. Ecuador and the Bahamas are almost tied at 69.1, while Saint Kitts and Nevis records 65.1. Thailand reaches 64.4, New Zealand 63.4, and Denmark 62.4. Costa Rica and Panama are just above 60. The gap between first and tenth place is about 14.5 points, so even the high-scoring group contains meaningful variation.
The indicator should still be read as evidence about curriculum documents rather than a league table of overall environmental education quality. A high score shows that biodiversity is more extensively represented in the policy and curriculum materials included in the methodology. It does not establish how much classroom time is devoted to the topic, how teachers approach it, or how well students understand it.
The lowest scores are geographically dispersed
The bottom of the distribution is not confined to one region. Romania has the lowest value at 7.0, followed by the United Arab Emirates at 7.4, Haiti at 8.1, and Lesotho at 8.4. Jamaica, the United Republic of Tanzania, and Lithuania are also below 10. Finland is at 11.0, Algeria at 11.6, and Qatar at 12.4.
| Low-end rank | Country | Biodiversity score |
|---|---|---|
| 1 | Romania | 7.0 |
| 2 | United Arab Emirates | 7.4 |
| 3 | Haiti | 8.1 |
| 4 | Lesotho | 8.4 |
| 5 | Jamaica | 9.4 |
| 6 | United Republic of Tanzania | 9.5 |
| 7 | Lithuania | 9.6 |
| 8 | Finland | 11.0 |
| 9 | Algeria | 11.6 |
| 10 | Qatar | 12.4 |
This geographic spread is important because it argues against a simple continent-based explanation. Denmark, for example, is above 62 while Finland is close to 11 even though both are in Northern Europe. The map contains similar contrasts elsewhere. Geographic proximity may help reveal comparisons worth investigating, but the score itself does not identify the policy or institutional reasons behind those differences.
Large differences also appear within the same broad region
Latin America provides several of the clearest high-score clusters. Honduras reaches 74.6, Peru 70.9, Ecuador 69.1, Costa Rica 60.6, and Panama 60.1, while Mexico and Chile are in the upper 50s. The Caribbean is more mixed: the Bahamas and Saint Kitts and Nevis are high, but Haiti and Jamaica are both below 10. Looking only at a broad regional average would hide those very different national curriculum profiles.
Europe is similarly diverse. Denmark and France are around 60, while Romania, Lithuania, Finland, and Hungary are below 20. In Asia, Thailand is above 64 and Bhutan is above 57, but the United Arab Emirates, Qatar, Kuwait, and Viet Nam are much lower. The country-level map is useful precisely because it reveals these internal contrasts rather than treating each region as a uniform block.
A score of 40 or 60 is not a pass mark
The 0–100 scale should not be interpreted as a school-grade threshold. It quantifies how extensively biodiversity-related content is represented in the official curriculum materials examined by the Greening Curriculum Indicator. A country above 60 has stronger documented mainstreaming of biodiversity content than one around 20 under this methodology, but 60 does not mean that biodiversity education is “complete,” and a score below 20 does not mean the subject is entirely absent from every classroom.
UNESCO describes the indicator as drawing on national curriculum frameworks and planned science and social-science curricula at grades 3, 6, and 9. This makes it primarily an input or policy-and-curriculum measure. It captures what education systems formally prioritize in curriculum documents. It does not directly observe classroom practice, local school variation, teaching materials, teacher preparation, or student behavior.
Rank matters less than the distance between scores
Rankings are easy to read, but neighboring ranks can represent very different gaps. Honduras and Peru are separated by about 3.6 points, while Ecuador and the Bahamas are nearly tied around 69.1. At the lower end, Romania, the United Arab Emirates, Haiti, and Lesotho occupy four different ranks but all fall within about 1.4 points. The exact score therefore gives more information than the rank alone.
The dataset median of 34.7 provides a useful reference point. Countries near 35 are close to the center of the distribution, while those above 60 are clearly separated from the typical observation and those below 20 are well into the lower tail. This kind of comparison is more informative than attaching qualitative labels such as “good” or “poor,” which the official indicator does not define.
What the biodiversity curriculum score does not measure
First, it does not measure student knowledge of ecology or biodiversity. Learning assessments are a separate type of evidence. Second, it does not measure how faithfully the planned curriculum is implemented. Teachers, textbooks, school resources, lesson time, and local programs can all affect what students actually experience even when national documents contain similar language.
Third, the score should not be treated as a measure of national biodiversity conservation performance. Protected areas, species trends, forest loss, ecosystem condition, and conservation spending are different outcomes. Whether stronger biodiversity content in curricula is associated with environmental outcomes would require additional datasets and a separate analytical design. The curriculum score alone cannot establish that relationship.
Fourth, this is a 2023 cross-section. Curriculum reforms adopted later may not be reflected, and a single observation does not show whether a country is improving or declining over time. A trend analysis would require multiple comparable releases based on the same methodology. The safest interpretation is therefore a snapshot of documented curriculum emphasis at the observation date.
Data coverage and official source
The comparison uses the 2023 country observations for UNESCO UIS series SGE.BIODIV from the official UIS indicator API. The supplied dataset contains 100 countries, with values from 7.0 to 74.6. It is not a complete list of every country in the world, so the mean, median, and ranks in this article refer to these 100 observations rather than to an imputed global dataset.
The conceptual definition follows the UIS official glossary for the Greening Curriculum Indicator. Countries without a 2023 value are not assigned zero on the map. They are left unplotted, which keeps missing data distinct from genuinely low scores.
The main takeaway from the map
The biodiversity greening-education score spans almost 68 points across the 100 countries observed in 2023, from 7.0 to 74.6. The median is 34.7. Latin America and the Caribbean account for many of the highest scores, yet those regions also contain low-scoring countries, and large contrasts appear within Europe and Asia as well. The most useful reading is not simply which country ranks first, but how strongly biodiversity is represented in each country’s official curriculum documents relative to its peers.
Frequently Asked Questions
What does the biodiversity greening-education score measure?
It measures how strongly biodiversity-related content is represented in the national curriculum frameworks and subject curricula covered by the UNESCO methodology. It does not directly measure student achievement or classroom implementation.
Which countries have the highest and lowest 2023 scores?
Among the 100 observations in this comparison, Honduras is highest at 74.6 and Romania is lowest at 7.0.
Do countries missing from the map have a score of zero?
No. A missing point means that a 2023 observation is not included in this dataset. Missing values are not converted to zero.
Related Maps
Green Map creates custom-edited map images using open geographic data sources such as geoBoundaries, Natural Earth, OpenStreetMap, and government open data.
These maps are edited visual materials, not raw data files, and are provided for education, documents, presentations, and graphic reference.





