Canada had an estimated 41,417,056 residents on April 1, 2026. Ontario was the largest province, with 16,103,890 people, followed by Quebec, British Columbia and Alberta. Together, these four provinces accounted for 86.49% of the national population. That concentration is the central feature of the provincial comparison: most residents lived in just four of the country’s 13 provinces and territories.
The figures come from Statistics Canada’s quarterly population estimates, Table 17-10-0009-01. All regions are compared on the same reference date. These are preliminary population levels, rather than annual averages, growth rates or a count of people added during a quarter.
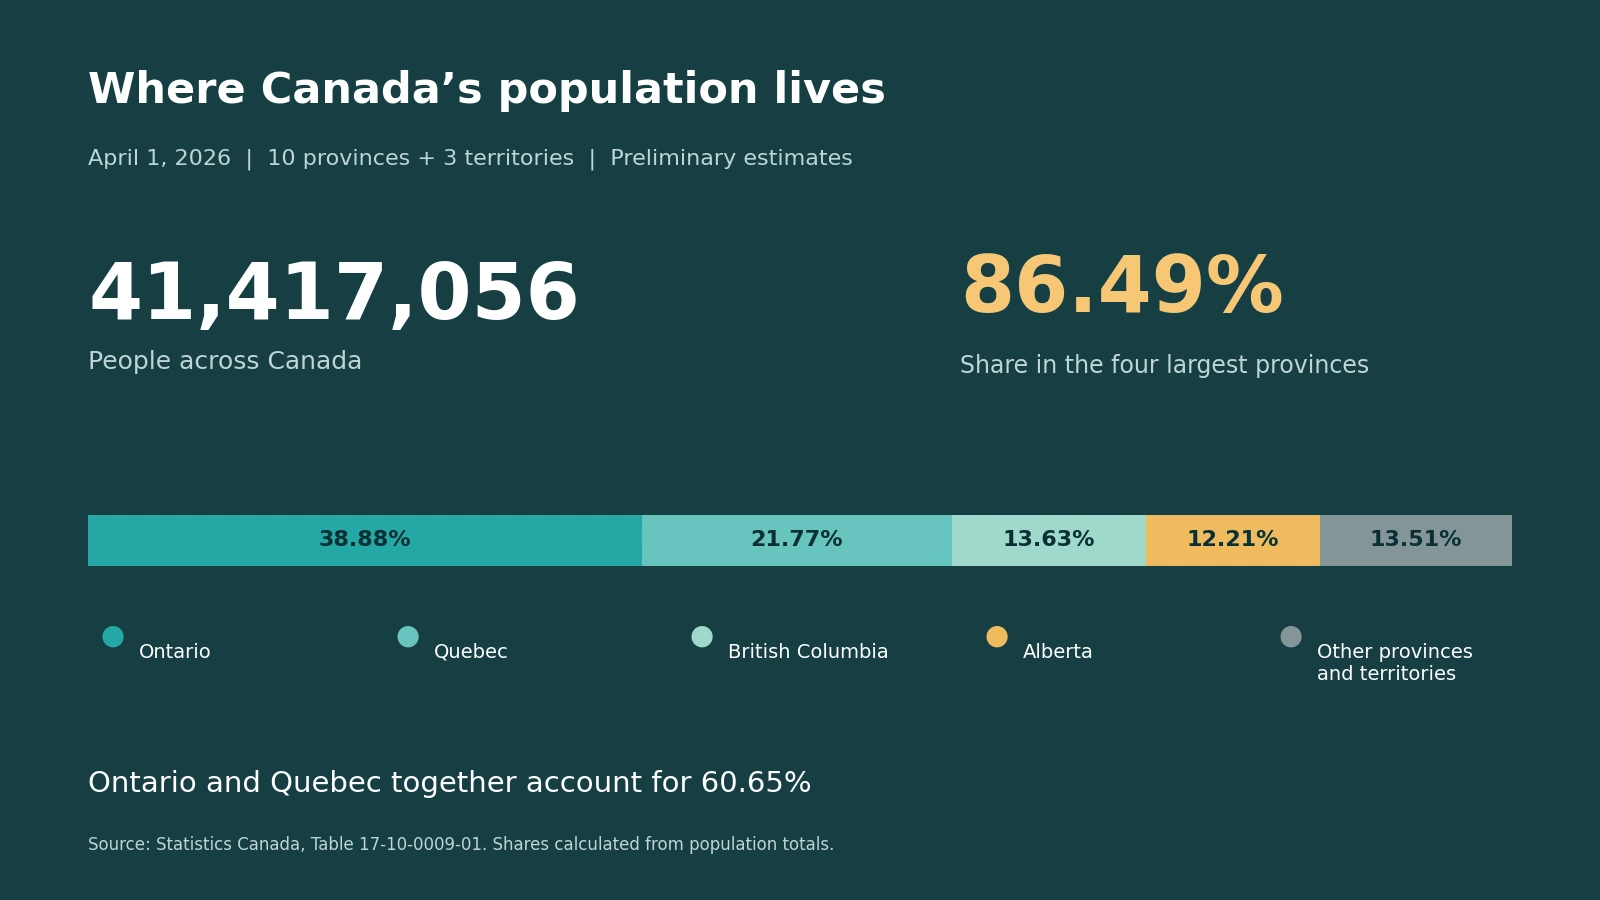
Table of Contents
The complete provincial and territorial ranking
The table keeps every province and territory in the comparison. Counts are shown in persons, without rounding to thousands or millions. National shares are calculated from the combined population of all 13 regions and rounded to two decimal places. The province-or-territory column matters when distinguishing the smallest province from the smallest region overall.
| Rank | Province or territory | Type | Population | National share |
|---|---|---|---|---|
| 1 | Ontario | Province | 16,103,890 | 38.88% |
| 2 | Quebec | Province | 9,016,222 | 21.77% |
| 3 | British Columbia | Province | 5,646,420 | 13.63% |
| 4 | Alberta | Province | 5,057,077 | 12.21% |
| 5 | Manitoba | Province | 1,503,865 | 3.63% |
| 6 | Saskatchewan | Province | 1,266,092 | 3.06% |
| 7 | Nova Scotia | Province | 1,090,852 | 2.63% |
| 8 | New Brunswick | Province | 866,497 | 2.09% |
| 9 | Newfoundland and Labrador | Province | 547,910 | 1.32% |
| 10 | Prince Edward Island | Province | 181,715 | 0.44% |
| 11 | Yukon | Territory | 48,493 | 0.12% |
| 12 | Northwest Territories | Territory | 45,808 | 0.11% |
| 13 | Nunavut | Territory | 42,215 | 0.10% |
| — | Canada total | — | 41,417,056 | 100.00% |
Seven provinces had more than one million residents. Manitoba, Saskatchewan and Nova Scotia occupied the middle of the ranking, after the four largest provinces. New Brunswick, Newfoundland and Labrador, and Prince Edward Island each had fewer than one million residents. The million-person threshold is simply a convenient way to describe scale; it is not a separate statistical classification.
Prince Edward Island was the smallest province, with 181,715 people. Nunavut, with 42,215, was the smallest when territories were included. Those answers are both correct, but they answer different questions. The distinction also explains why a list described as covering only provinces should not silently add the territories at the bottom without identifying them.
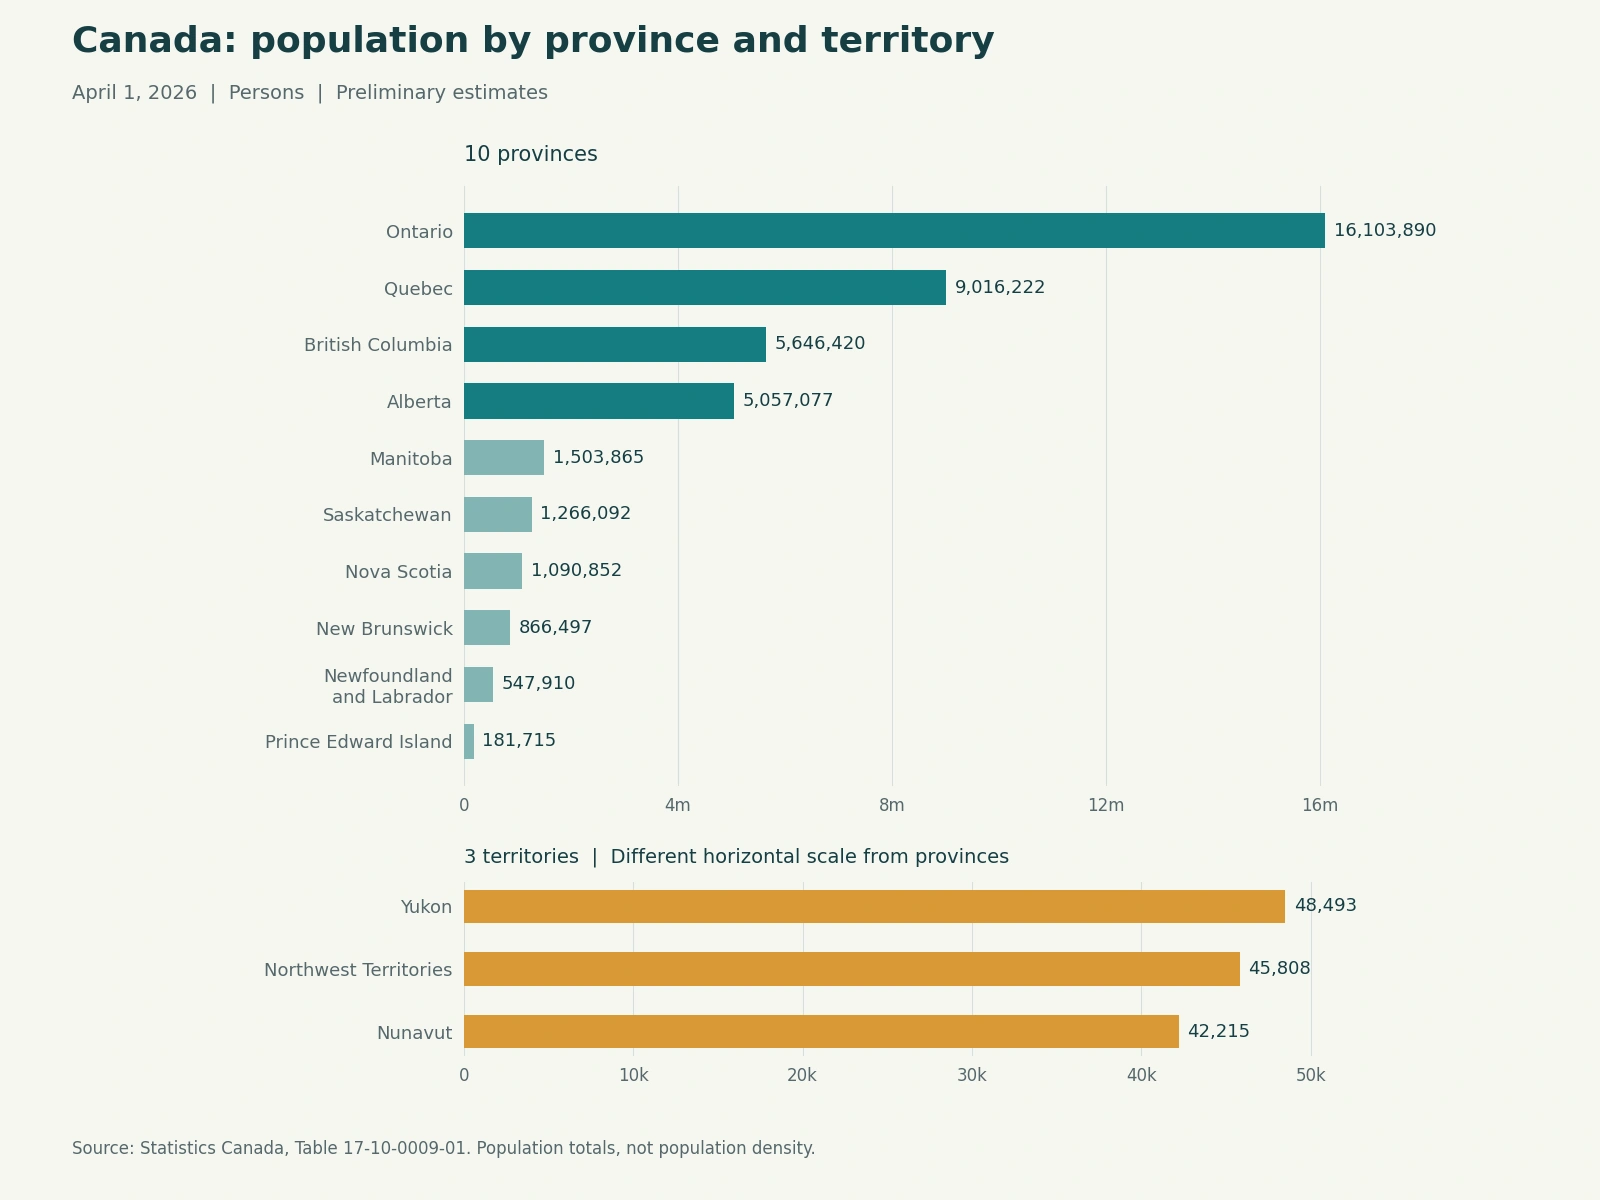
The chart uses separate horizontal scales for provinces and territories so that the three territorial populations remain readable. Both panels start at zero. Compare bar lengths within a panel, and use the printed population counts for comparisons between panels. A territorial bar that fills much of its panel does not represent a population comparable to Ontario’s.
How much of Canada lived in the four largest provinces?
Ontario represented 38.88% of Canada’s population, or roughly 39 out of every 100 residents. Quebec accounted for another 21.77%. Their combined population was 25,120,112, equivalent to 60.65% of the national total. Ontario was about 1.79 times Quebec’s size, with a gap of 7,087,668 residents between them.
British Columbia and Alberta formed the next tier. British Columbia had 5,646,420 residents and Alberta had 5,057,077, a difference of 589,343. Their national shares were 13.63% and 12.21%, respectively. Both exceeded five million residents, while the next-largest province, Manitoba, was much smaller at 1,503,865.
Adding the four largest provinces gives 35,823,609 residents. The other nine provinces and territories together had 5,593,447. One useful comparison is that British Columbia alone had 52,973 more residents than those nine regions combined. The number of administrative units in a group therefore gives very little indication of how many people the group contains.
This concentration is a description of population levels. It does not establish which provinces contributed most to recent national growth. A province can account for a large share of residents without having the fastest growth rate. Contributions to growth require changes between two dates, while the ranking here describes the distribution on one date.
Regional groupings reveal differences that ranks alone miss
Combining Alberta, Saskatchewan and Manitoba gives a Prairie population of 7,827,034, or 18.90% of Canada. Alberta contained 64.61% of that three-province total. Its population was approximately 1.83 times the combined 2,769,957 residents of Saskatchewan and Manitoba. Treating the three provinces as equally sized units would conceal this imbalance.
The four Atlantic provinces—Newfoundland and Labrador, Prince Edward Island, Nova Scotia and New Brunswick—had 2,686,974 residents altogether. Their share of the Canadian total was 6.49%. Nova Scotia was the largest of the four, accounting for 40.60% of their combined population. It was the only member of this group with more than one million residents.
An informative cross-group comparison is that Atlantic Canada’s four provinces had 82,983 fewer residents than Saskatchewan and Manitoba combined. The groups differ in the number of provinces they contain, yet their population totals were relatively close. Such comparisons are easier to interpret when membership is explicit, rather than hidden behind a broad regional label.
British Columbia is not included in the Prairie calculation above. Similarly, the Atlantic total uses four named provinces, rather than an unspecified eastern grouping. When presenting regional statistics, list the included areas alongside the group name. That allows readers to reproduce the sum and prevents different definitions of a region from being mistaken for conflicting population figures.
The territories should remain visible in the numbers
Yukon, the Northwest Territories and Nunavut together had 136,516 residents, approximately 0.33% of Canada’s population. Yukon was the largest territory at 48,493, followed by the Northwest Territories at 45,808 and Nunavut at 42,215. The difference between Yukon and Nunavut was 6,278 people.
All three national shares would disappear if rounded to whole percentages. Keeping the counts alongside shares of 0.12%, 0.11% and 0.10% avoids presenting small populations as zero. These percentages use Canada as the denominator; they are not each territory’s share of the territorial total. Changing the denominator would answer a different question.
Small national shares do not describe the spacing of settlements, the age of residents or access to services. A territory-wide total cannot identify the population of an individual community. Those questions require smaller-area or more detailed demographic statistics. Preserving the territorial rows makes the national comparison complete without pretending that a single population total explains local conditions.
What the April 2026 reference date means
In this quarterly series, the April observation refers to April 1. It is not the average population over April, May and June. Nor is it a count of births, immigrants or new residents during those months. The date fixes the point at which the population level is being compared across all regions.
For a growth calculation, an April level needs an appropriate earlier observation. A quarter-to-quarter comparison and a year-over-year comparison cover different intervals. Neither can be calculated from the April snapshot alone. A larger population in one province than another should therefore be described as a difference in size, without turning it into a claim about faster expansion.
The estimates cover the resident population, including eligible non-permanent residents, rather than Canadian citizens alone. Short-term visitors are excluded. Statistics Canada’s Quarterly Demographic Estimates documentation sets out the population covered. The totals should not be used interchangeably with counts of voters, employed people or households.
Statistics Canada’s June 2026 release identifies the estimates as preliminary and subject to revision. If another source gives a slightly different value, check both its reference date and release vintage. A figure for a different quarter, or an earlier version of an estimate, is not automatically a contradiction.
Population totals are not density or city populations
Ontario’s first-place ranking means it had the most residents. It does not mean it had the highest population density. Density requires a comparable area denominator, such as land area measured in square kilometres. No density ranking can be obtained simply by sorting the population counts in this table.
The provincial totals also should not be assigned to their best-known cities. Ontario’s 16,103,890 residents are not Toronto’s population, and British Columbia’s 5,646,420 residents are not Vancouver’s population. Municipalities and metropolitan areas are different geographic units. A comparison involving them needs observations for those boundaries rather than a provincial substitute.
Population alone does not establish why one place is larger than another. Explaining demographic change would require information about births, deaths and migration. Comparing living conditions would require other measures, such as housing, income or access to services. The population ranking supplies the scale of each region, which is useful context but not an explanation of every regional difference.
Reproducing the shares and combining population data
Every national share is calculated as regional population divided by 41,417,056, multiplied by 100. Alberta, for example, has 5,057,077 divided by the national total, giving 12.21% after rounding. Group shares are calculated by adding the original population counts before dividing, rather than by adding already rounded percentages.
The national total is the sum of the 13 regional observations. It must not be added to those regional rows again, which would double-count the same residents. An average giving every province and territory equal weight describes an average administrative unit, not the experience of an average Canadian resident.
When using population as a denominator for another measure, match its geography, date and target population. A statistic about students needs the relevant student population; a household statistic needs households. Total resident population is not a universal replacement for either. This distinction keeps a useful regional ranking from becoming a misleading input to an unrelated rate.
Sources and calculation notes
The population observations are from Statistics Canada, Table 17-10-0009-01, Population estimates, quarterly, for April 1, 2026. Coverage includes all 10 provinces and three territories, with no missing regional values. Counts are expressed in persons.
Ranks, national shares, regional subtotals, differences and ratios were calculated from those counts. Rankings use the unrounded population values. Percentages and ratios are rounded only for display. The full table supplies the values needed to reproduce the comparisons, while the reference date keeps them tied to a specific population snapshot.
Frequently Asked Questions
Which Canadian province had the most people in April 2026?
Ontario had 16,103,890 residents on April 1, 2026, representing about 38.88% of Canada’s estimated population. Quebec ranked second, followed by British Columbia and Alberta.
What share of Canada’s population lived in the four largest provinces?
Ontario, Quebec, British Columbia and Alberta together had 35,823,609 residents. Dividing that total by Canada’s 41,417,056 residents gives 86.49% after rounding.
Are these provincial figures annual averages or growth rates?
Neither. They are preliminary population levels for April 1, 2026. A growth rate requires a comparable population estimate for an earlier date, while an annual average represents a different measure.
Related Articles
- Canada 2021 Census Profile data by geography
- Using Canada’s Proximity Measures Database
- Canada environmental maps and regional statistics
Green Map creates custom-edited map images using open geographic data sources such as geoBoundaries, Natural Earth, OpenStreetMap, and government open data.
These maps are edited visual materials, not raw data files, and are provided for education, documents, presentations, and graphic reference.