Statistics Canada’s Proximity Measures Database (PMD) is designed for a practical spatial question: how close are neighbourhood-scale areas to services and amenities such as employment, grocery stores, health care, schools, transit, parks and libraries? The 2021 product provides ten proximity measures plus a composite indicator at the dissemination block (DB) level. A linked Data Viewer makes the spatial distribution easier to inspect, while the database itself is the better source when you need values for a table, GIS workflow or reproducible analysis.
The key is to treat the product as a measure of relative proximity, not as a general neighbourhood quality score. The published indexes are normalized from 0 to 1, with 0 representing the lowest proximity and 1 the highest proximity in Canada for that measure. A value of 0.8 does not mean an amenity is 80 percent closer, nor does it state an exact travel time. It is a relative index created from the PMD method.
How to read the official Proximity Measures Data Viewer
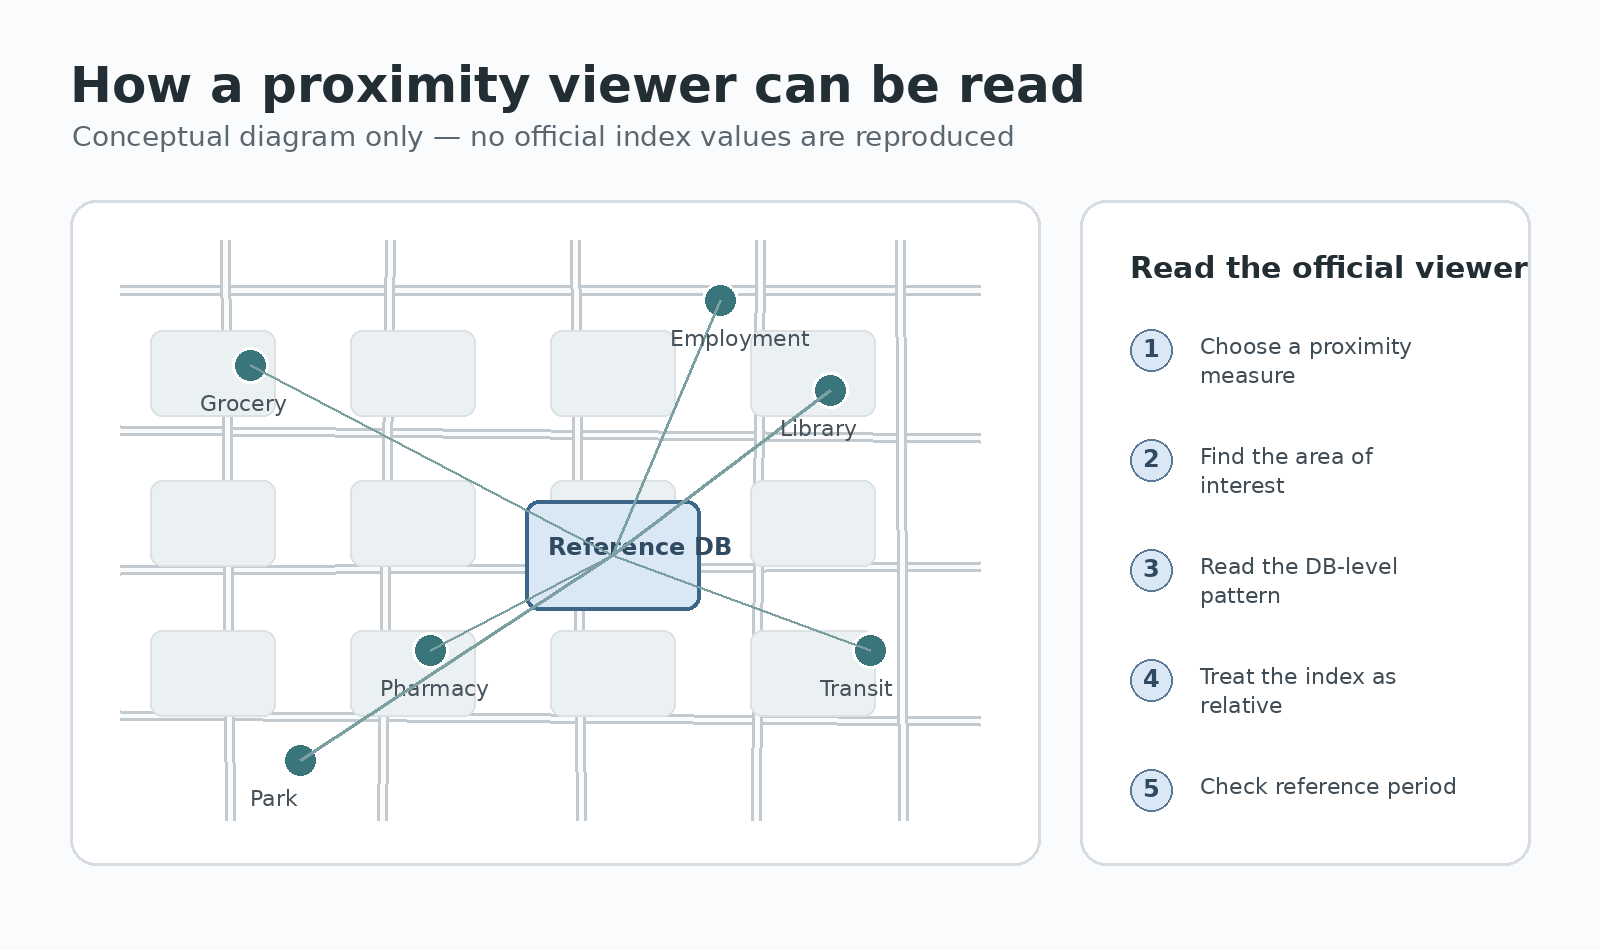
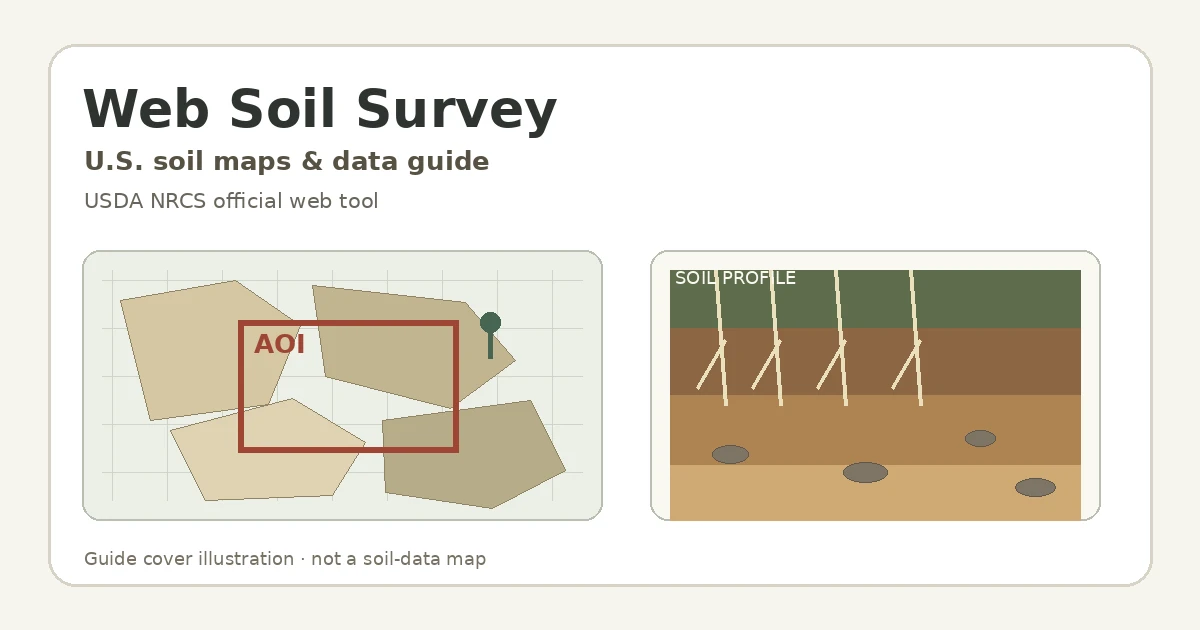
The Proximity Measures Database catalogue links to the Proximity Measures Data Viewer as a related visualization product. Statistics Canada describes the viewer as a tool for displaying the spatial distribution of each proximity measure at the dissemination-block level. The diagram above is not a screenshot and contains no measured values; it simply shows the reading workflow: choose a measure, move to an area of interest, inspect the local DB pattern, and then return to the definitions before interpreting the result.
The viewer is most useful for seeing variation that a province- or city-wide average can hide. Two nearby parts of the same municipality can fall into different proximity bands because the PMD works at a much finer geographic scale. That does not automatically mean one neighbourhood has better services overall. It means the selected proximity measure, calculated under its specific method, differs between those areas.
Because the index is national and normalized, the colours or values should be read comparatively. They are not direct minutes, kilometres, service ratings, utilization counts or capacity measures. A high proximity index says something about relative access under the PMD model; it does not by itself establish that a facility is high quality, inexpensive, uncongested or available at the time a person needs it.
The ten proximity measures in the 2021 database
The 2021 PMD contains ten service- and amenity-related measures. The method is not identical for every measure: Statistics Canada uses service-specific inputs and walking or driving network distances depending on the type of destination. Before comparing measures, open the definition for each one rather than assuming they all represent the same distance threshold or service size.
- Employment — proximity to dissemination blocks containing sources of employment.
- Grocery stores — proximity to grocery-store services.
- Pharmacies — proximity to pharmacy services.
- Health care — proximity to health-care facilities.
- Child care — proximity to child-care facilities.
- Primary education — proximity to primary schools.
- Secondary education — proximity to secondary schools.
- Public transit — proximity to public transportation.
- Neighbourhood parks — proximity to neighbourhood parks.
- Libraries — proximity to library services.
The database also includes a composite indicator that combines selected proximity measures. That composite should not be treated as a universal quality-of-life ranking. It summarizes a defined set of access conditions. If your question concerns housing affordability, service capacity, school performance, safety, travel reliability or another dimension not represented by those measures, a separate dataset is needed.
How the method turns service locations into a proximity index
Statistics Canada describes the PMD as using a gravity model. In simple terms, the calculation considers the distance from a reference dissemination block to dissemination blocks containing a service within the applicable range, while also accounting for the size or presence of the service. Services located in the reference DB can also contribute to the measure.
For the 2021 measures, distances are based on network travel between representative points of dissemination blocks rather than simple straight-line distance. Some measures use a walking network and others use a driving network. This matters when a map looks surprising: two destinations that appear equally close on a small map can have different network access because roads, crossings or routes connect them differently.
The DB geography is what gives the product much of its mapping value. It is granular enough to reveal local variation that disappears in a national, provincial or municipal average. The trade-off is that a single DB should not be treated as a complete description of its surroundings. The viewer is good at identifying patterns that deserve attention; explaining the cause of a pattern may require separate evidence about land use, transportation, population or service operations.
A reliable workflow for using the PMD
- Step 1: open the official PMD catalogue and confirm the product and reference version you intend to use.
- Step 2: for a quick spatial check, open the official Data Viewer and select the proximity measure relevant to your question.
- Step 3: inspect the DB-level pattern around the area of interest, but keep the normalized and relative nature of the index in mind.
- Step 4: when you need data values, open the 2021 database page and review the measure definition before downloading the file.
- Step 5: in a spreadsheet or GIS, preserve the dissemination-block identifier and make sure any boundary layer or joined dataset uses the matching geography.
- Step 6: before comparing with another PMD vintage, read the version notes and normalization changes rather than calculating a simple year-to-year difference.
This sequence separates discovery from analysis. The viewer answers “where should I look more closely?” The data file then supports sorting, filtering, joining and repeatable calculation. It also reduces the risk of treating a map colour as though it were the underlying measurement itself.
Why the 2021 indexes should not be compared directly with 2020
A major limitation is easy to miss: Statistics Canada cautions that the 2021 measures cannot be directly compared with the version released in 2020. The indexes are rescaled relative to the minimum and maximum values in each period. If those endpoints change, the same normalized number does not represent a fixed absolute level over time.
The 2021 product also incorporates 2021 Census geographies, an updated road network and refreshed amenity inputs. Statistics Canada changed how representative points for dissemination blocks were determined as well. These changes are useful for the newer product, but they make a simple “0.45 in 2020 versus 0.60 in 2021” interpretation unsafe. The numbers look like a time series because they share a 0–1 range; the official documentation says the comparison is not that simple.
The 2021 page also carries a correction notice dated August 22, 2023. Statistics Canada corrected proximity-to-employment estimates after rectifying the allocation of employment counts to dissemination blocks, and it removed the suppression pattern from the proximity measures. If you downloaded an earlier copy and are revisiting the project later, verify that you are using the current official file.
When to use the viewer and when to use the CSV database
The viewer is the faster option for visual exploration. It helps you identify clusters, contrasts and local transitions without first building a GIS project. The downloadable database is more appropriate when you want to rank areas, filter a selected measure, reproduce a comparison, calculate summaries or join the proximity values to other geography-compatible information. Statistics Canada provides the 2021 full database as a compressed CSV file.
A practical workflow is to start in the viewer, note the measure and location that appear relevant, and then move to the database if the question requires exact values. When joining other data, match geography carefully. A dissemination block, dissemination area, census tract and census subdivision are not interchangeable simply because they refer to the same broad place.
Some measures, particularly public transit and neighbourhood parks, have more limited nationwide coverage because suitable data are not always available at the desired geographic level. A blank area or unexpected pattern should therefore trigger a check of the measure documentation, not an automatic conclusion that the service does not exist.
Questions the PMD can answer well — and questions it cannot
The PMD is well suited to questions such as: Which parts of a city have relatively higher or lower proximity to a selected amenity? How does access vary within a municipality rather than only between provinces? Where does a local pattern appear different enough to justify closer investigation? These are spatial-comparison questions, and the DB-level viewer is built for that scale of exploration.
It does not directly answer whether a particular home is valuable, whether a school is high performing, whether a hospital has available appointments, whether a transit service is reliable, or whether a park is safe and well maintained. It also does not by itself explain why a neighbourhood has a high or low proximity score. Proximity is one measurable component of access, not a complete assessment of service quality or lived experience.
Official source
This guide is based on Statistics Canada’s Proximity Measures Database, its 2021 product documentation, and the related Proximity Measures Data Viewer. Use the official pages to verify current files, definitions and corrections before publishing an analysis.
Frequently asked questions
Is a PMD value between 0 and 1 an actual distance?
No. It is a normalized proximity index relative to values in Canada for that measure. It should not be read as kilometres, minutes or a percentage reduction in distance.
Can I compare the 2021 PMD index directly with the 2020 index?
Statistics Canada cautions against direct comparison because each period is rescaled using its own minimum and maximum values, and the 2021 geography and representative-point methods also changed.
Do I need the CSV if I can use the Data Viewer?
The viewer is enough for quick spatial exploration, but the official CSV is better for exact values, filtering, joins and reproducible analysis across many dissemination blocks.
Related articles
- How to Use Statistics Canada Keyword Search for Maps and Geographic Data
- How to Download Canada 2021 Census Profile Data by Geography
- Canada Environmental Maps and Reports: Using Human Activity and the Environment
Green Map creates custom-edited map images using open geographic data sources such as geoBoundaries, Natural Earth, OpenStreetMap, and government open data.
These maps are edited visual materials, not raw data files, and are provided for education, documents, presentations, and graphic reference.