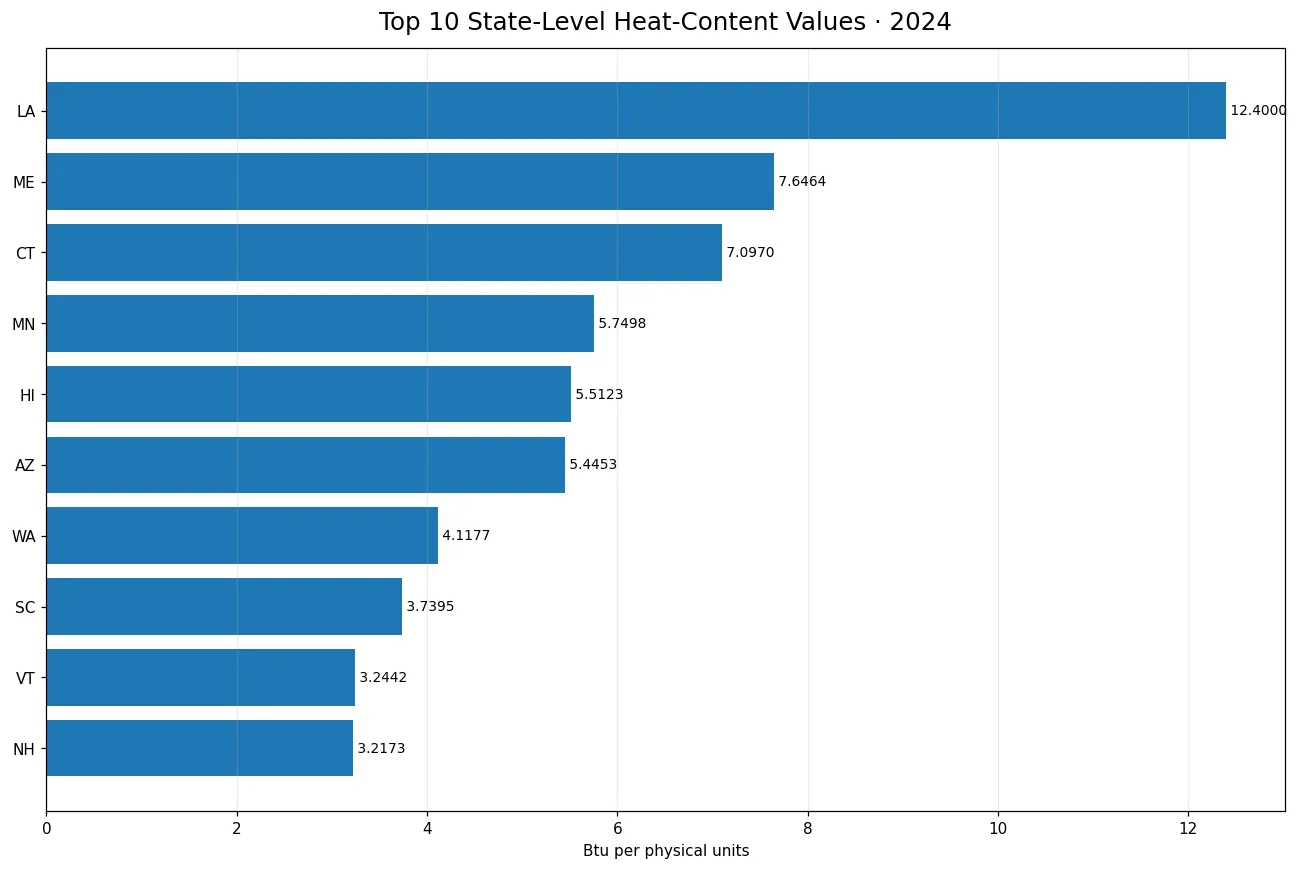
Louisiana recorded the highest 2024 average heat-content value for renewable fuels in the U.S. Electric Power sector at 12.4000. Maine followed at 7.6464 and Connecticut at 7.0970, with Minnesota at 5.7498, Hawaii at 5.5123, and Arizona at 5.4453. The comparison holds the EIA definition constant: fueltypeid=REN, sectorid=98, field=heat-content, annual frequency, and year 2024 across the 50 states and the District of Columbia.
This measure is not renewable electricity generation and it is not the amount of renewable fuel consumed. It is an average heat-content coefficient published for the selected fuel and sector combination. The source unit label is Btu per physical units. Because REN is an aggregate renewable category rather than one homogeneous fuel, the physical-unit basis can reflect the composition of renewable sources represented in a state. The safest reading is therefore a comparison of the published state-level coefficients, not a universal conversion factor for every renewable technology.
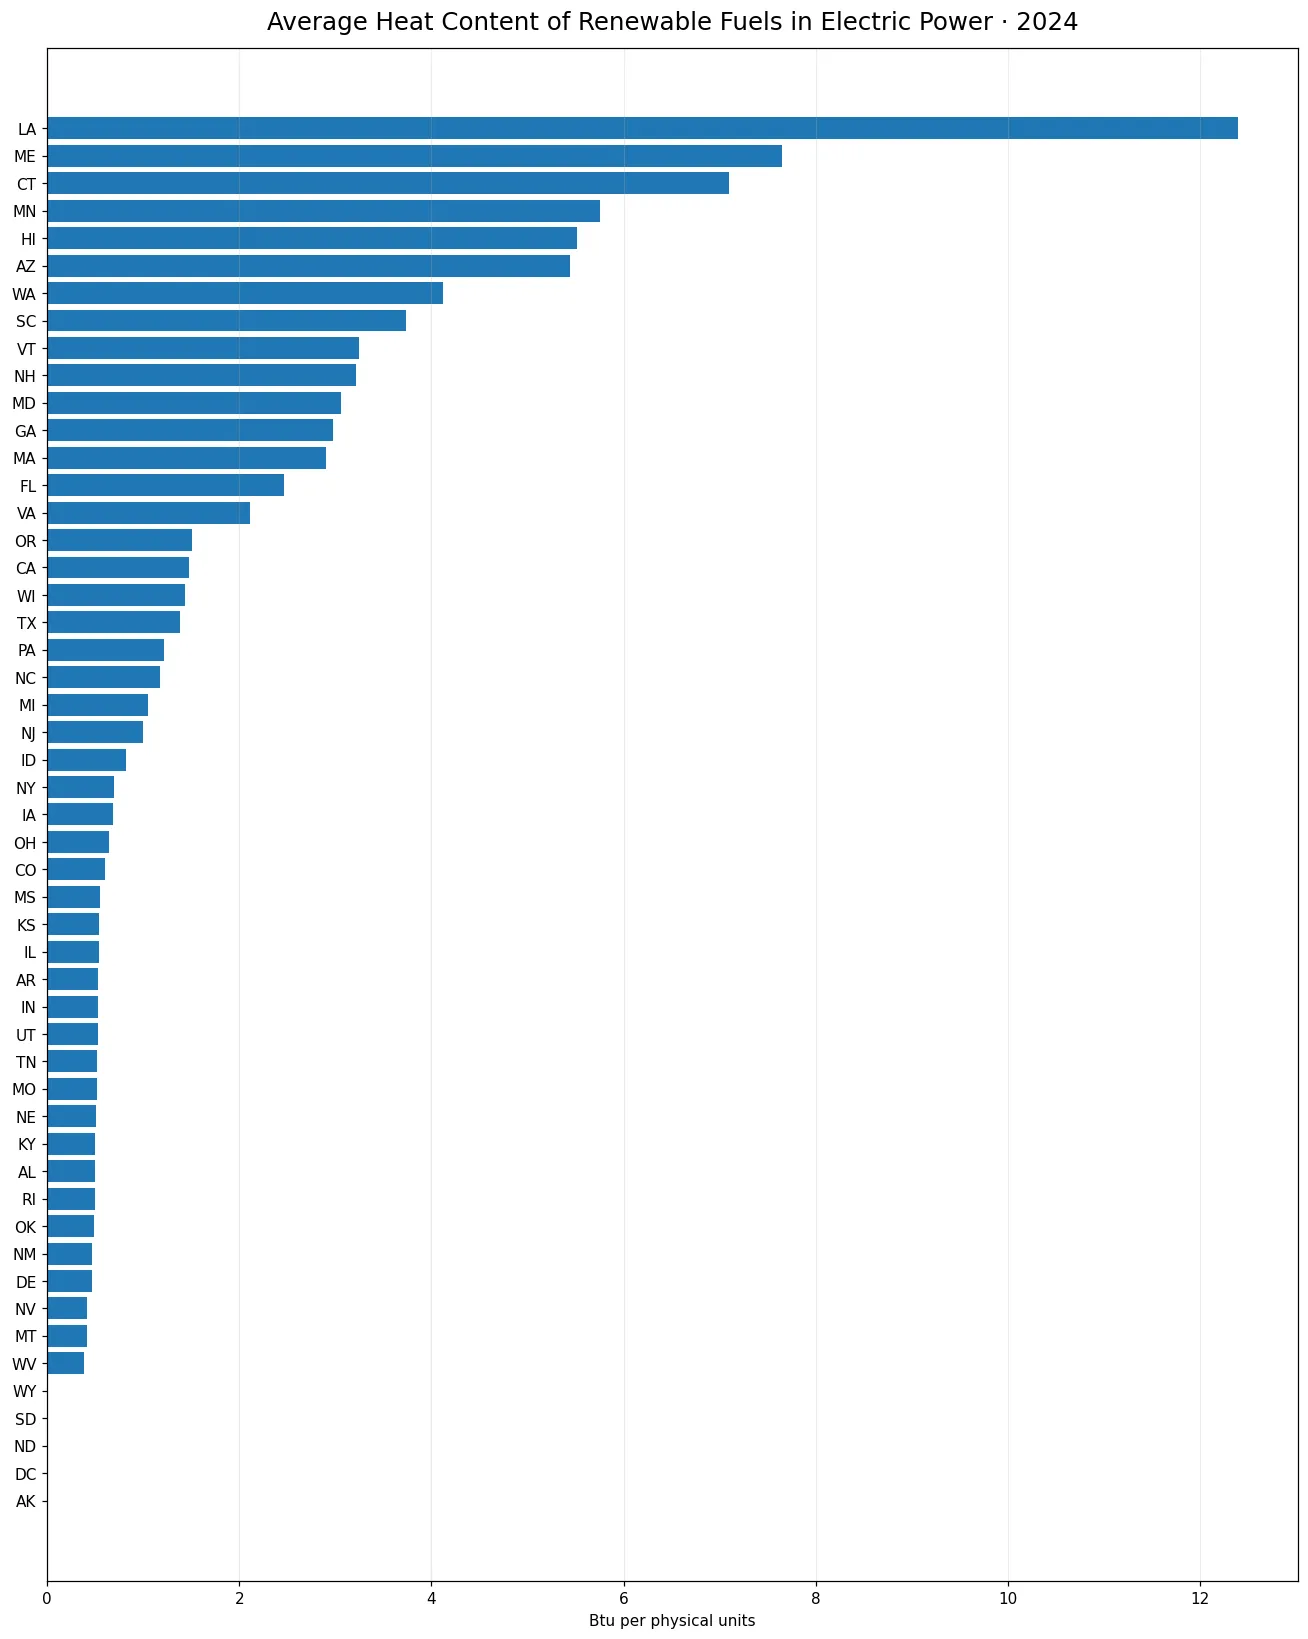
Table of Contents
Louisiana stood well above a strongly right-skewed distribution
The 51 observations have a mean of 1.8481 and a median of 0.6823. The first quartile is 0.5013 and the third quartile is 2.6818, so half of the jurisdictions lie roughly between those two values. The mean is much higher than the median because a relatively small group of high observations pulls the distribution upward. Louisiana is especially prominent at 12.4000, while Maine and Connecticut are the only other jurisdictions above 7. This shape makes the median a useful companion to the average when describing a typical state-level observation.
The upper tier remains spread out after the first three places. Minnesota reports 5.7498, Hawaii 5.5123, Arizona 5.4453, Washington 4.1177, South Carolina 3.7395, Vermont 3.2442, and New Hampshire 3.2173. Those ten jurisdictions form the visible upper end of the series, but their positions should not be read as a ranking of renewable power production. They rank only the heat-content coefficient within the fixed REN, sector 98, heat-content definition for 2024.
| State | Code | Average heat content |
|---|---|---|
| Louisiana | LA | 12.4000 |
| Maine | ME | 7.6464 |
| Connecticut | CT | 7.0970 |
| Minnesota | MN | 5.7498 |
| Hawaii | HI | 5.5123 |
| Arizona | AZ | 5.4453 |
| Washington | WA | 4.1177 |
| South Carolina | SC | 3.7395 |
| Vermont | VT | 3.2442 |
| New Hampshire | NH | 3.2173 |
Five reported zeros are observations, not missing values
Alaska, the District of Columbia, North Dakota, South Dakota, and Wyoming each have a reported value of exactly zero in this series. None of the 51 rows is missing. That distinction matters because replacing a reported zero with a blank would change the statistical distribution, while treating a missing observation as zero would create information that the source did not provide. Here the zero values are retained exactly as reported. They should still be interpreted narrowly: a zero does not mean that a jurisdiction has no renewable energy activity of any kind.
Among positive observations, West Virginia is lowest at 0.3780, followed by Montana at 0.4110 and Nevada at 0.4160. Delaware is 0.4686, New Mexico 0.4713, Oklahoma 0.4880, Rhode Island 0.4936, and Alabama 0.5000. Twenty-three jurisdictions are at or above 1, fifteen are at or above 2, six are at or above 5, and only three reach 7 or more. These thresholds illustrate why the series is better described as a broad distribution than by one national average.
Why the unit label is kept as Btu per physical units
For a single fuel such as natural gas, a heat-content coefficient often has a clearly defined physical denominator. REN is different because it aggregates renewable energy sources whose physical quantities can be reported in different ways. Without fuel-level detail, forcing every value into a single alternative unit could imply a comparability that the aggregate definition does not guarantee. For that reason, the published label Btu per physical units is retained and the analysis avoids conversions to Btu per kilowatt-hour, MMBtu per ton, or another invented common denominator.
The coefficient is useful for characterizing energy content, but it does not measure plant efficiency. A higher value does not automatically imply lower costs, better technology, lower emissions, higher capacity factors, or more renewable generation. Those questions require other EIA fields and sometimes different datasets. Generation should be studied with generation measures, fuel input with consumption measures, and capacity with capacity data. Keeping those concepts separate prevents an energy-property coefficient from being turned into a performance score.
Sector 98 limits the comparison to the Electric Power scope
Sectorid=98 identifies the Electric Power scope used in this comparison. It does not represent all renewable energy use across the entire state economy. A renewable heat-content observation for another sector can differ because the included facilities, ownership types, technologies, and reporting populations are different. Even when fueltypeid remains REN, changing sectorid changes the statistical universe. Comparisons across sectors should therefore be framed as comparisons between different operational scopes rather than as direct changes in the same population.
The same rule applies to comparisons across time. A year-to-year change is most meaningful when fueltypeid, sectorid, field, frequency, unit definition, and reporting conventions remain aligned. If classifications or reporting practices change, part of an apparent increase or decrease could reflect statistical treatment instead of a physical change in renewable fuels. This article focuses on the 2024 cross-section and does not infer causes for movements in other years.
Heat content is not a proxy for the size of renewable generation
Louisiana’s 12.4000 is the largest coefficient in the series, but that does not establish Louisiana as the largest renewable electricity producer. A state can have a high heat-content coefficient and a modest quantity of renewable generation, or a large renewable generation portfolio and a lower coefficient. Electricity output depends on the amount of energy input, technology, operating hours, efficiency, resource availability, and other factors. A single coefficient cannot substitute for those variables.
The same caution applies to Hawaii and Arizona, which are both above 5. Their positions can motivate a closer look at the detailed renewable fuels reported in the Electric Power sector, but the aggregate REN value alone cannot identify which technology caused the difference. Explaining the cause would require more granular fuel codes or facility-level evidence. The present comparison therefore distinguishes observed patterns from explanations that would require additional evidence.
The median reveals a different picture from the top-ten chart
The median of 0.6823 is far below the top values and also below the mean of 1.8481. This means the typical jurisdiction in the ordered list sits much closer to the cluster of low coefficients than to Louisiana, Maine, or Connecticut. Looking only at the top ten would make high values appear more common than they are. The full 51-jurisdiction chart shows that many states remain below 1 and that the upper end consists of a comparatively small set of observations.
Closely spaced or repeated values should not automatically be treated as errors. Similar coefficients may arise from similar fuel mixes, shared conversion assumptions, or comparable reporting structures. The aggregate REN category does not provide enough detail to identify the reason for each cluster. The appropriate approach is to present the pattern, retain the published numbers, and reserve causal claims for analyses with fuel-specific evidence.
How to combine this measure with other EIA indicators
Heat-content values become more informative when examined alongside generation and consumption indicators that use matching definitions. A researcher might ask whether states with high coefficients also have large renewable fuel inputs, or whether high generation occurs in states with comparatively low coefficients. Those are valid questions, but they require careful alignment of year, fueltypeid, sectorid, field, and units. Numbers from different facets should not be divided or combined simply because they refer to the same state.
For REN in particular, fuel-specific detail can help explain why the aggregate coefficient differs across states. The mix may include renewable sources with different measurement conventions and energy characteristics. The state-level series is therefore best viewed as a first layer: it shows where the published Electric Power coefficient is high or low, while more detailed fuel categories can be used to investigate the composition behind those differences.
What the 2024 state comparison establishes
Three facts are especially clear. First, Louisiana is a pronounced high observation at 12.4000, followed by Maine and Connecticut above 7. Second, the distribution is skewed: the median is 0.6823 while the mean is 1.8481. Third, all 51 jurisdictions have reported values, including five exact zeros. Those features can be stated directly without estimating missing data or creating a national total, neither of which is needed for a coefficient series.
The comparison also defines what cannot be concluded. It does not rank renewable policy success, electricity affordability, emissions performance, installed capacity, or total renewable production. It does not show that a zero-value jurisdiction lacks renewable resources. It does not justify a universal conversion of the REN aggregate into one physical denominator. These limits are not weaknesses of the series; they are part of using a narrowly defined operational indicator correctly.
In summary, Louisiana recorded the highest 2024 renewable heat-content value in the EIA Electric Power sector, with Maine and Connecticut next. The important interpretation is the metric identity: REN fuel aggregate, sector 98, heat-content field, annual 2024, and the published Btu per physical units label. Preserving that identity keeps the state comparison useful while preventing the values from being mistaken for generation, consumption, efficiency, or a broad renewable-energy score.
Frequently asked questions
Which jurisdiction had the highest 2024 renewable heat-content value in Electric Power?
Louisiana was highest at 12.4000 in the EIA REN, sector 98, heat-content series, followed by Maine at 7.6464 and Connecticut at 7.0970.
Does a higher heat-content value mean more renewable electricity generation?
No. Heat content is an energy-property coefficient, not generation, capacity, efficiency, or renewable share.
Do the five reported zeros mean those jurisdictions have no renewable energy?
No. They mean this specific EIA fuel, sector, field, and year combination reports a value of zero for those jurisdictions.
How should Btu per physical units be interpreted for REN?
It is the source unit label for the aggregate renewable category. Because REN combines multiple renewable sources, a universal physical-unit conversion should not be imposed without fuel-level detail.
Related Articles
Green Map creates custom-edited map images using open geographic data sources such as geoBoundaries, Natural Earth, OpenStreetMap, and government open data. These maps are edited visual materials, not raw data files, and are provided for education, documents, presentations, and graphic reference.