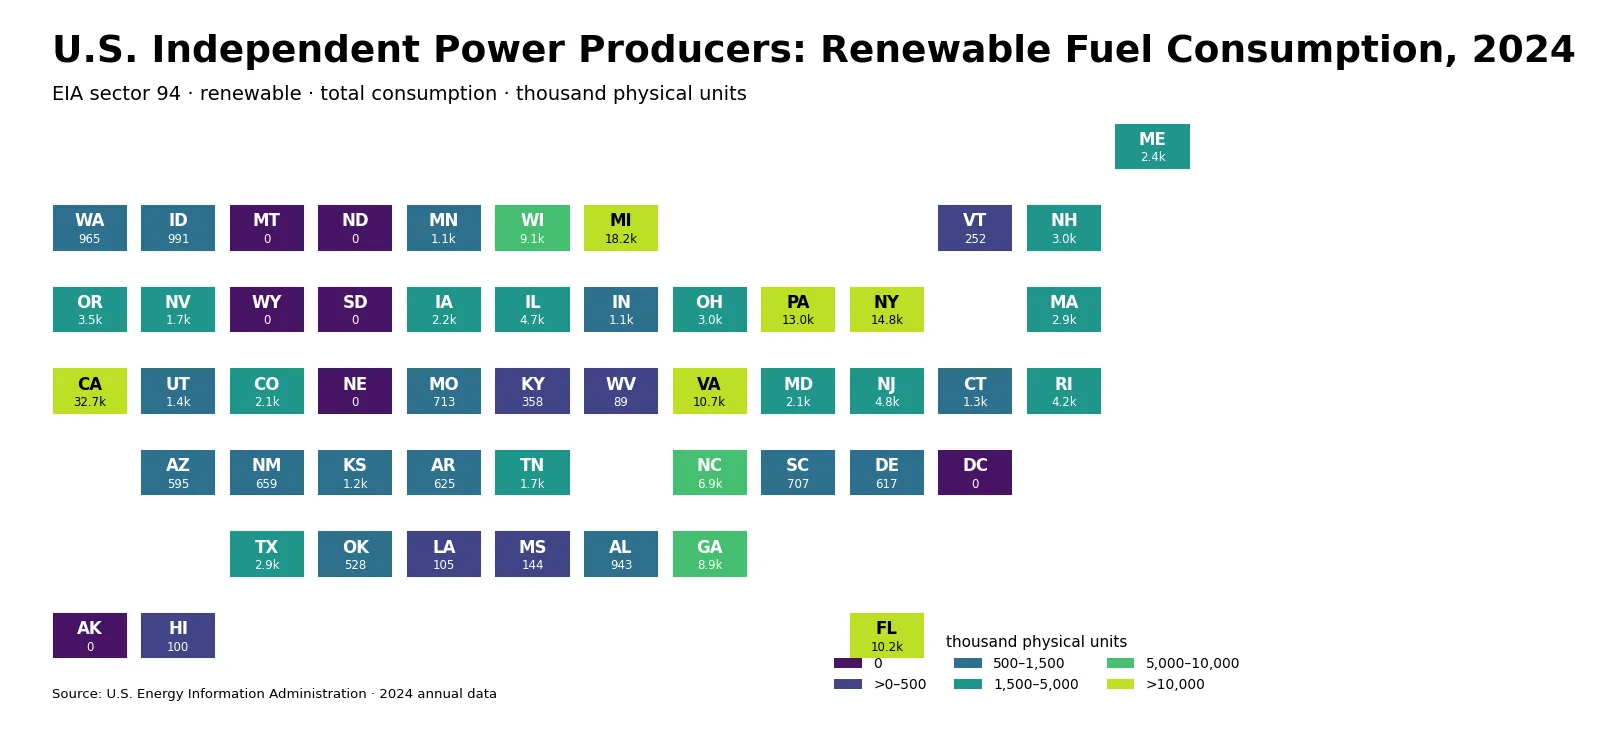
Texas recorded the largest 2025 renewable net generation among EIA Independent Power Producer Non-CHP state-level observations, at 184,422.403 thousand MWh. California followed with 82,355.401 thousand MWh and Oklahoma with 32,029.539 thousand MWh. The 51 observations for the 50 states and the District of Columbia sum to 654,829.148 thousand MWh. Texas therefore represented 28.16% of that comparable sum. This series measures electricity output, not the energy content of fuel inputs.
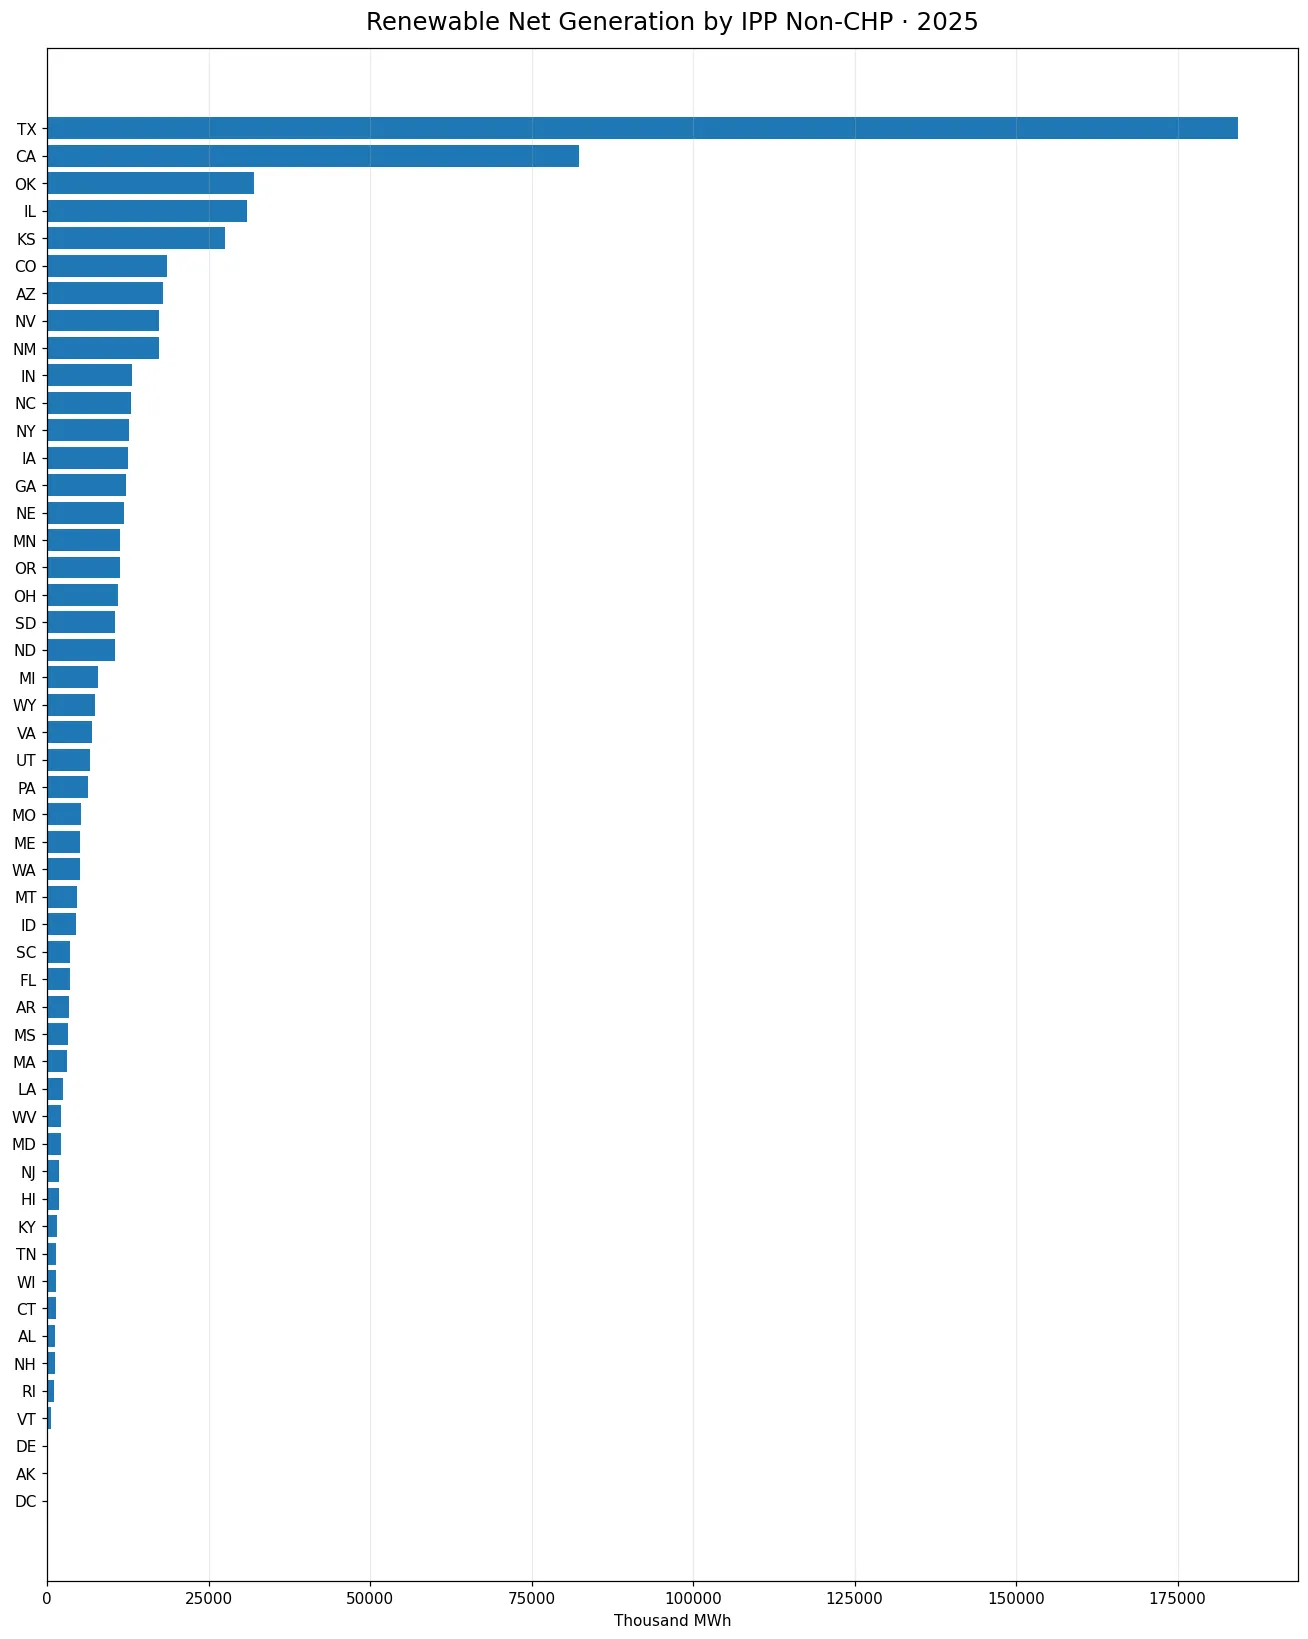
The source is the U.S. Energy Information Administration Electric Power Operational Data. The comparison fixes annual frequency, 2025, fueltypeid=AOR, sectorid=2, and the generation field. Every one of the 51 jurisdictions has a positive reported value, so there are no source-missing observations and no zero values to replace. The smallest observation is the District of Columbia at 48.472 thousand MWh, followed by Alaska at 63.197. The ranking therefore compares reported values under one consistent EIA definition.
Table of Contents
What this generation series measures
The generation field reports electricity produced. Its unit is thousand megawatthours, so a value of 1 represents one thousand MWh of net generation. This is conceptually different from fuel-consumption fields such as consumption-for-eg-btu or total-consumption-btu, which express fuel energy input in thermal units. A state can be large in both output and input, but an efficiency conclusion requires more information about plant technologies, fuel mix, operating conditions, and the exact scope of the facilities included.
The AOR fuel facet represents all renewables in this EIA series. It is therefore an aggregate renewable category rather than a single technology such as wind or solar. A high state value does not establish which renewable technology produced most of the electricity. Answering that question requires looking at the component fuel facets separately. The aggregate is useful for comparing overall renewable output within the specified producer sector, while the components are better for explaining the generation mix.
The IPP Non-CHP sector boundary matters
Sector 2 identifies Independent Power Producers Non-CHP. The values do not represent every renewable generator in each state and should not be treated as total statewide renewable generation without qualification. Electric utilities, combined-heat-and-power facilities, commercial or industrial generators, and other producer categories can appear under different EIA sectors. The correct interpretation is renewable net generation within the IPP Non-CHP operating category.
This distinction also separates the series from other EIA articles that may share the same year, unit, or renewable label. Changing the sector from 2 to 90, 94, 98, or another code changes the set of facilities represented. Changing the fuel facet from AOR to solar, wind, hydro, or another category changes the technology scope. The year alone is not enough to establish that two series measure the same thing.
Texas and California dominate the upper end
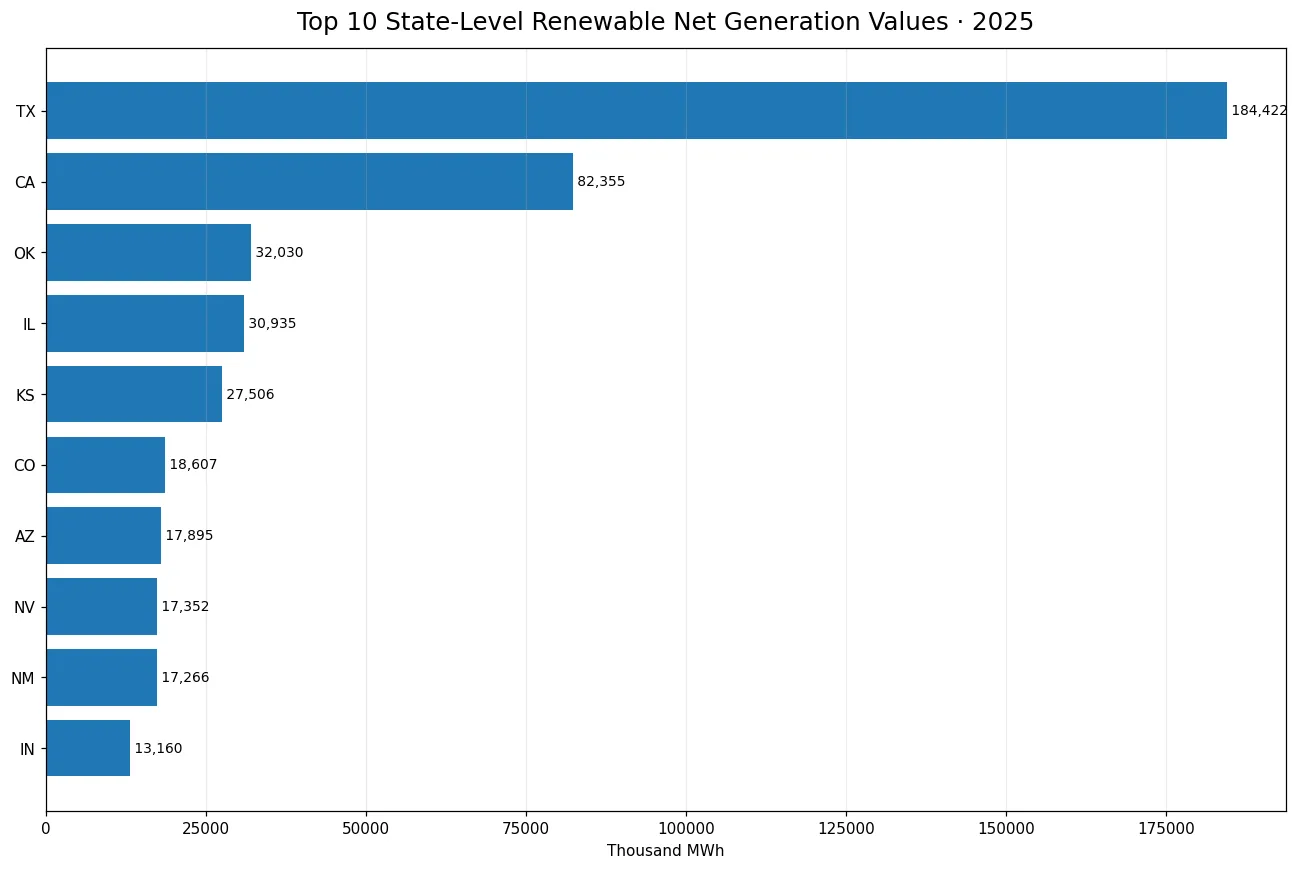
Texas contributed 184,422.403 thousand MWh, equal to 28.16% of the 51-jurisdiction sum. California contributed 82,355.401 thousand MWh, or 12.58%. Together they made up 40.74%. Adding Oklahoma raises the top-three share to 45.63%. That concentration is the clearest feature of the distribution, although it should be described as concentration within this EIA sector rather than within all U.S. renewable generation.
Illinois ranked fourth at 30,935.288 thousand MWh and Kansas fifth at 27,505.675. Colorado, Arizona, Nevada, New Mexico, and Indiana completed the top ten. Their combined output brings the top-ten share to 67.43% of the 51-observation sum. The pattern is therefore broader than Texas and California alone: several central and western states also contribute substantial IPP Non-CHP renewable generation.
| Jurisdiction | Code | Net generation (thousand MWh) | Share of 51-observation sum |
|---|---|---|---|
| Texas | TX | 184,422.403 | 28.16% |
| California | CA | 82,355.401 | 12.58% |
| Oklahoma | OK | 32,029.539 | 4.89% |
| Illinois | IL | 30,935.288 | 4.72% |
| Kansas | KS | 27,505.675 | 4.20% |
| Colorado | CO | 18,607.431 | 2.84% |
| Arizona | AZ | 17,895.099 | 2.73% |
| Nevada | NV | 17,351.632 | 2.65% |
| New Mexico | NM | 17,265.939 | 2.64% |
| Indiana | IN | 13,159.569 | 2.01% |
Mean and median show a strongly skewed distribution
The arithmetic mean across 51 jurisdictions is 12,839.787 thousand MWh, while the median is 5,230.510. The mean is about 2.45 times the median, showing how a relatively small number of high-output states pull the average upward. The median is less sensitive to Texas and other very large observations, so it is often a better reference point for describing the middle of this particular state-level distribution.
At the lower end, the District of Columbia reported 48.472 thousand MWh, Alaska 63.197, and Delaware 186.121. Those low values should not be interpreted as a complete scorecard of renewable development. They describe only IPP Non-CHP renewable generation. Generation assigned to other EIA sectors can be outside this comparison, so a low position here does not automatically mean low renewable generation from every type of producer.
Generation is not the same as fuel consumption
EIA operational data contain several fields that can look similar when presented in state rankings. Generation is an electricity-output measure. Consumption-for-eg-btu describes the energy content of fuel used for electricity generation. Consumption-uto-btu covers fuel used for useful thermal output, and total-consumption-btu combines electricity-generation and useful-thermal fuel energy. Average heat content is another distinct measure. Using the exact field name is necessary because each answers a different question.
The distinction is especially important for renewables. Some renewable sources do not have a conventional fuel flow that is naturally expressed in barrels, tons, or cubic feet, while electricity output remains directly comparable in MWh. For that reason, this generation series is well suited to comparing output across the renewable aggregate. It does not by itself reveal thermal efficiency, fuel conversion efficiency, or the physical quantity of renewable fuel consumed.
How to read the concentration shares
Texas’s 28.16% share and the top-ten share of 67.43% are calculated against the sum of the 51 observations under the AOR, sector 2, generation, and 2025 filters. They are useful for describing concentration inside this defined comparison. They are not claims about the share of every renewable megawatthour generated in the United States, because other producer sectors and classifications are outside this slice of the EIA data.
The ranking is also based on absolute generation. It is not normalized by population, electricity demand, land area, installed renewable capacity, or total state generation. A large state with extensive generating capacity can rank high in absolute MWh even if a different state has a higher renewable share of electricity or more output per resident. Absolute-output and ratio-based indicators answer different questions and should not be substituted for one another.
Values just outside the top ten add useful context
North Carolina ranked eleventh at 12,972.439 thousand MWh, New York twelfth at 12,673.321, and Iowa thirteenth at 12,516.040. Those values are close enough to the lower edge of the top ten that a modest year-to-year change could alter several ranking positions. A one-year ranking is therefore best treated as a snapshot. A trend analysis would keep the same fuel and sector definitions while comparing multiple years.
Annual renewable generation can respond to weather, water availability, wind conditions, solar resources, plant additions, maintenance schedules, curtailment, grid conditions, and electricity demand. The state totals show where generation occurred, but they do not isolate which of those factors caused a particular result. Explaining causes requires additional plant, capacity, weather, market, and operational data rather than inference from the ranking alone.
Questions this indicator can answer well
This series is useful for asking where IPP Non-CHP renewable net generation was concentrated in 2025, how large the leading state values were, and how much of the observed distribution was held by the top ten jurisdictions. It is less suitable for judging renewable-policy quality, plant efficiency, cost competitiveness, emissions performance, or the overall cleanliness of a state’s electricity supply. Those are broader concepts that require different measures.
In summary, Texas and California form a clear upper tier in 2025 IPP Non-CHP renewable net generation, with Oklahoma, Illinois, and Kansas forming the next group. The large gap between the mean and median and the 67.43% top-ten share show a concentrated state distribution. The result is most informative when the EIA sector boundary remains explicit: this is a comparison of renewable electricity output from Independent Power Producers Non-CHP, not a universal ranking of all renewable generation in each state.
Frequently Asked Questions
Which state had the largest IPP Non-CHP renewable net generation in 2025?
Texas was highest at 184,422.403 thousand MWh, equal to 28.16% of the sum of the 51 reported observations.
What does AOR mean in this EIA series?
AOR is the all-renewables aggregate used in this EIA operational series rather than a single renewable technology.
Does IPP Non-CHP represent all renewable generation in a state?
No. It represents the Independent Power Producers Non-CHP sector, so other producer sectors can be outside the comparison.
Were missing values or zeros present?
No. All 51 jurisdictions have positive reported 2025 values, with no source-missing observations and no reported zeros.
Related Articles
Green Map creates custom-edited map images using open geographic data sources such as geoBoundaries, Natural Earth, OpenStreetMap, and government open data. These maps are edited visual materials, not raw data files, and are provided for education, documents, presentations, and graphic reference.