In 2025, Vermont recorded the highest state-level value for average heat content of renewable fuels in the Independent Power Producer Non-CHP category, at 9.5316. South Carolina followed at 8.7473, Louisiana at 7.4654, Connecticut at 7.3352, and Maine at 6.4418. The comparison uses annual observations from the U.S. Energy Information Administration’s Electric Power Operational Data with fueltypeid=REN, sectorid=2, and the heat-content field fixed for 2025 across the 50 states and the District of Columbia.
This measure is not renewable electricity generation, fuel consumption, capacity, or market share. It is an average heat-content coefficient reported for a specific EIA fuel and sector combination. The source labels the unit as Btu per physical units. Because REN aggregates multiple renewable energy sources rather than a single homogeneous fuel, the physical basis should not be treated as one universal unit that means exactly the same thing for every renewable resource. Differences can reflect the mix of renewable fuels reported within each state as well as their heat characteristics.
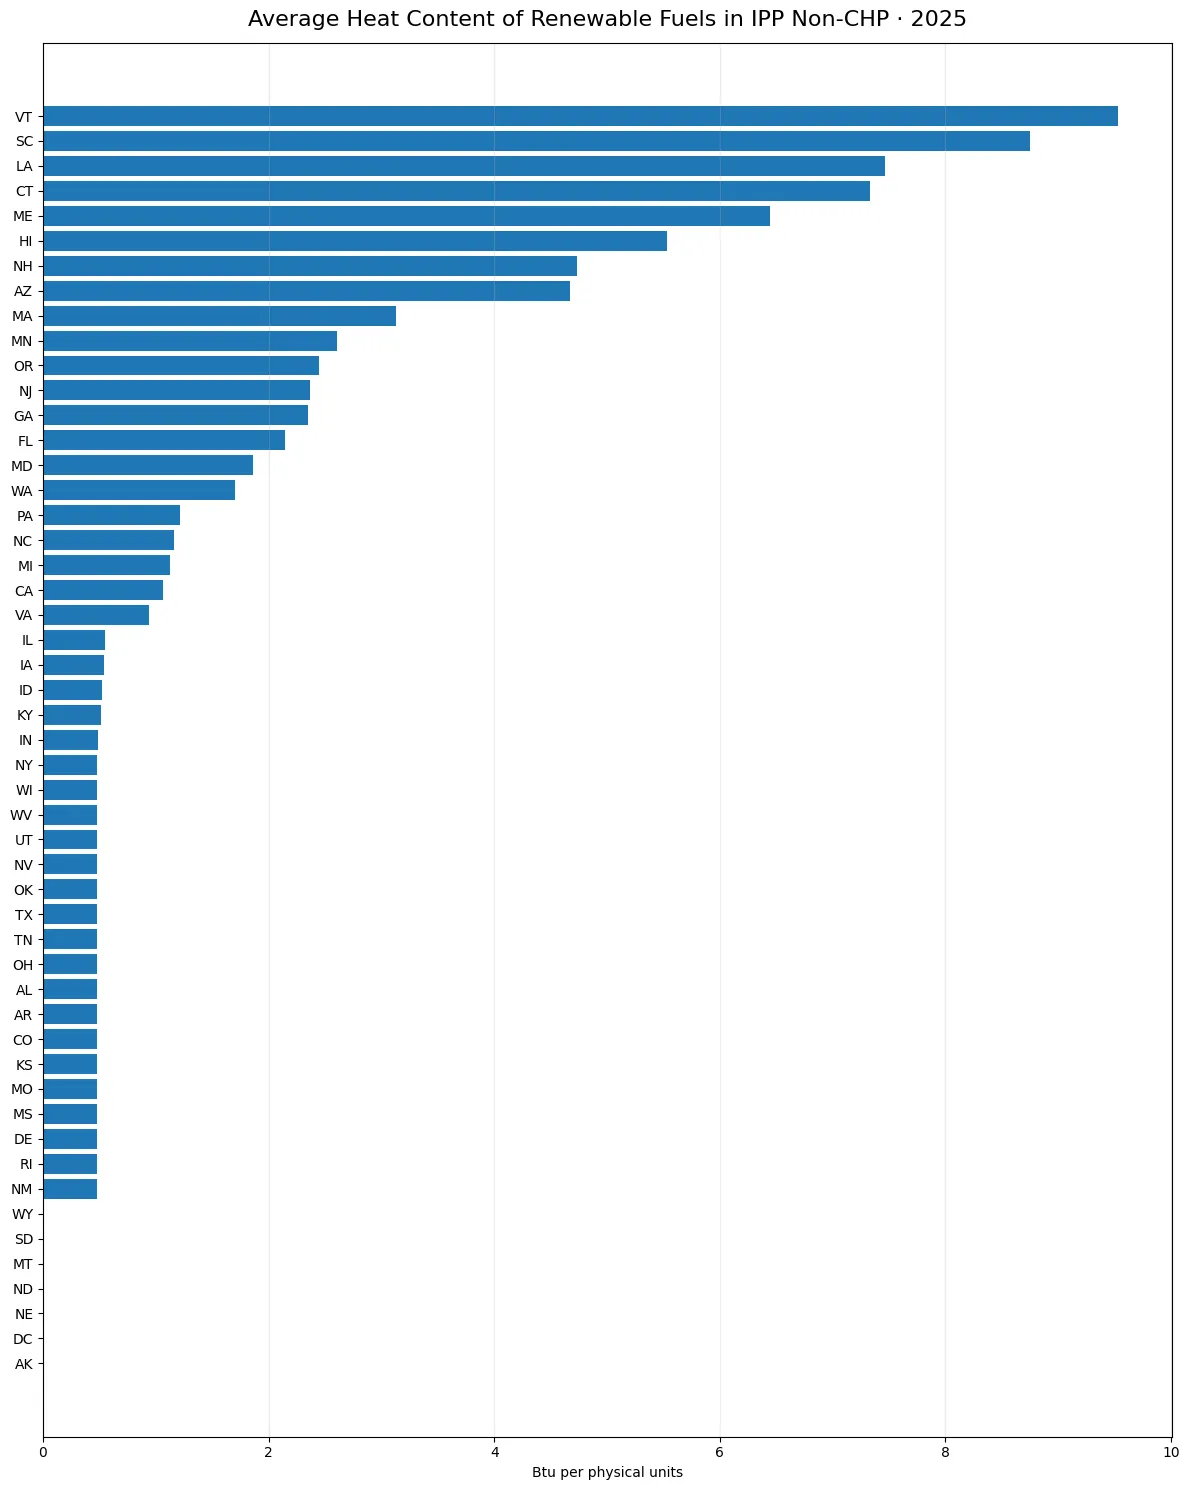
Table of Contents
Vermont and South Carolina stand well above the middle of the distribution
All 51 jurisdictions have a numeric observation. Forty-four values are positive and seven are reported as exactly zero, so there are no source-missing rows in this slice. The mean is 1.7603, while the median is only 0.4911. The first quartile is 0.4759 and the third quartile is 2.2511. The large gap between the mean and median shows how strongly a relatively small number of high observations pull the average upward.
The upper end of the distribution is distinct. Vermont and South Carolina are above 8, Louisiana and Connecticut are above 7, Maine is at 6.4418, and Hawaii is at 5.5296. New Hampshire follows at 4.7325, Arizona at 4.6726, Massachusetts at 3.1310, and Minnesota at 2.6041. At the same time, many states are clustered near 0.47 to 0.50. That wide spread is why the full-state chart and the top-10 view should be read together.
| State | Code | Average heat content |
|---|---|---|
| Vermont | VT | 9.5316 |
| South Carolina | SC | 8.7473 |
| Louisiana | LA | 7.4654 |
| Connecticut | CT | 7.3352 |
| Maine | ME | 6.4418 |
| Hawaii | HI | 5.5296 |
| New Hampshire | NH | 4.7325 |
| Arizona | AZ | 4.6726 |
| Massachusetts | MA | 3.1310 |
| Minnesota | MN | 2.6041 |
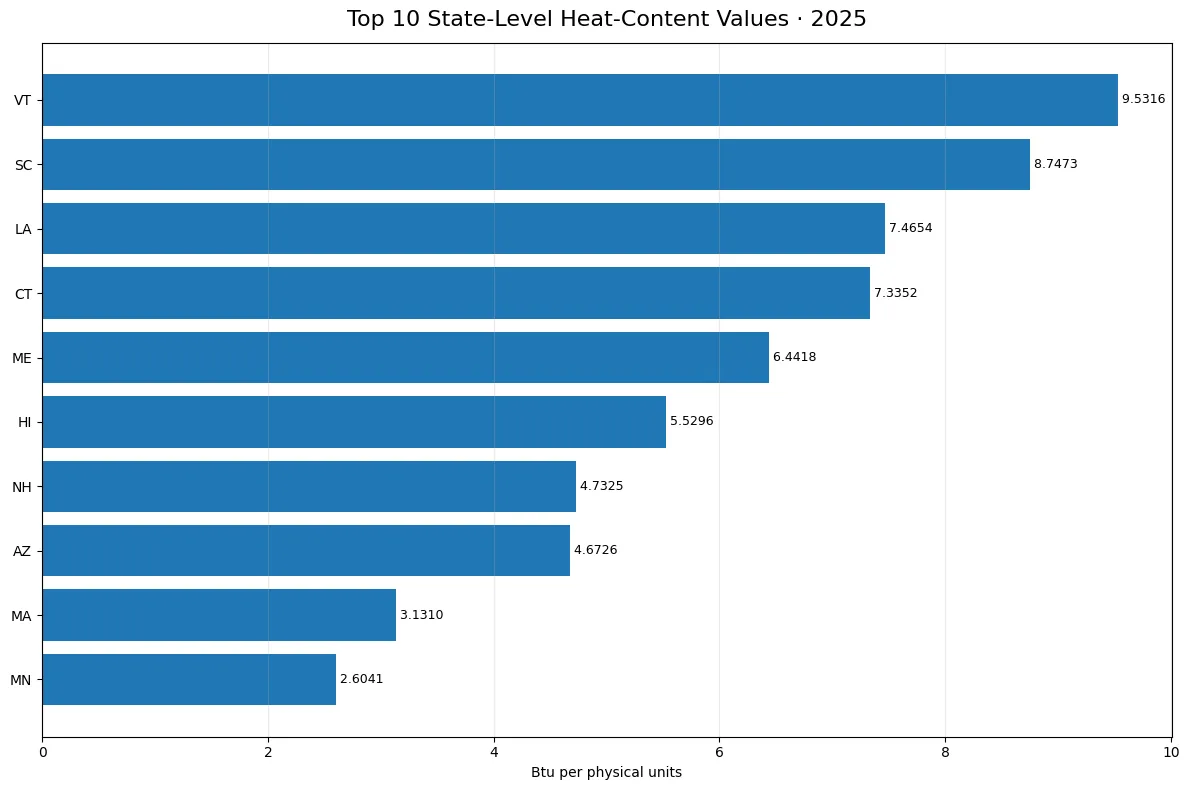
Heat content is not a measure of generation or performance
A value such as Vermont’s 9.5316 should not be described as meaning that its renewable energy is nine times better, more efficient, or more productive than a state near 1. Heat content is a fuel-property measure used in energy accounting. It does not directly measure plant efficiency, electricity quality, capacity factor, generation volume, or cost. For a composite renewable category, the mix of combustible and non-combustible renewable sources also matters when interpreting a state-level coefficient.
The sector definition is equally important. Sectorid=2 refers to the IPP Non-CHP category, so these observations do not represent every renewable generator in each state. Utility-owned plants, combined heat and power facilities, and other sector classifications can appear under different EIA sector identifiers. A state with a high value in this slice can have a different position when a broader electric-power sector or an all-sector aggregation is selected.
Reported zeros and the low median matter
Seven jurisdictions are reported at zero: Alaska, the District of Columbia, Montana, Nebraska, North Dakota, South Dakota, and Wyoming. Those zeros are preserved as reported observations rather than converted into missing values. However, zero here should not be expanded into the claim that a jurisdiction has no renewable energy. It only indicates that this particular 2025 EIA fuel-sector-field combination carries a reported value of zero.
The center of the distribution is much lower than the headline maximum. Twenty-four jurisdictions have a positive value below 1, fourteen are at or above 2, and six are at or above 5. The median of 0.4911 therefore gives a very different impression from the mean of 1.7603. When a distribution is this skewed, a ranking alone can exaggerate how typical the high-value states are.
Keep the same EIA dimensions when comparing years
Year-to-year comparisons require the same dimensional definition. A proper trend comparison should hold fueltypeid=REN, sectorid=2, the heat-content field, the frequency, and the unit convention constant. If a later EIA release changes classification or reporting coverage, an apparent jump may partly reflect a statistical change rather than a physical change in renewable fuels. This article therefore treats 2025 as a cross-sectional snapshot and does not assign causes to differences from earlier years.
There are several questions this measure cannot answer on its own. It does not reveal how many megawatt-hours of renewable electricity a state generated, what share of its electricity came from renewables, how much renewable fuel was consumed, or how much carbon dioxide was avoided. It also cannot identify the exact technology mix behind a state value without additional fuel-level detail. Those questions require generation, consumption, capacity, or technology-specific data.
The reported unit deserves special attention for readers comparing this series with gas, coal, petroleum, or biomass heat-content measures. For a single fuel, a physical unit can be defined more directly. For the REN aggregate, however, renewable sources can use different physical conventions. The safe interpretation is therefore to preserve the EIA label and compare the published coefficient within the fixed REN and IPP Non-CHP slice, rather than converting the values into a different universal unit without supporting detail.
The overall pattern is clear even with those cautions. Vermont, South Carolina, Louisiana, and Connecticut form a high group, while a large number of states sit close to the lower cluster near one-half of the reported unit. The seven zeros are actual reported values and not replacements for missing data. This makes the distribution internally complete for 2025, but completeness does not remove the need to respect what the metric measures.
This series can be useful as a signal for a deeper fuel-mix review. If a state has a very high heat-content coefficient, the next analytical step is to inspect the renewable fuel categories reported by IPP Non-CHP facilities in that state. States near 0.4759 may share a similar reported fuel basis or a common coefficient, but the aggregate series alone does not establish why. The observed pattern should therefore guide follow-up rather than substitute for fuel-level evidence.
In practical terms, this series is most useful as a state comparison of one EIA operating coefficient, not as a scorecard of renewable-energy performance. It can help identify where the reported heat-content value differs sharply from the national state-level distribution and prompt a closer look at renewable fuel composition. It should be paired with generation and consumption statistics when the question concerns scale, output, or the role of renewables in a state’s electricity system.
Taken together, the 2025 observations show Vermont at 9.5316, South Carolina at 8.7473, Louisiana at 7.4654, and Connecticut at 7.3352 at the top of this specific measure. The median state value remains 0.4911. That contrast is the central finding: a handful of states have much higher reported heat-content coefficients than the middle of the distribution, but those coefficients should not be mistaken for generation or overall renewable-energy leadership.
Frequently Asked Questions
Which state had the highest 2025 renewable heat-content value for IPP Non-CHP?
Vermont was highest at 9.5316 in the EIA REN, sector 2, heat-content slice, followed by South Carolina at 8.7473.
Does a higher heat-content value mean more renewable generation?
No. Heat content is an energy-property coefficient, not generation, capacity, renewable share, or plant efficiency.
Do the seven reported zeros mean those places have no renewable energy?
No. They mean this specific EIA fuel-sector-field combination reports a value of zero for 2025.
How should Btu per physical units be interpreted for REN?
It is the source unit label for the aggregate renewable category. Because REN combines multiple renewable sources, it should not be converted into one universal physical-unit measure without additional fuel-level detail.
Related Articles
Green Map creates custom-edited map images using open geographic data sources such as geoBoundaries, Natural Earth, OpenStreetMap, and government open data. These maps are edited visual materials, not raw data files, and are provided for education, documents, presentations, and graphic reference.