“Access to clean water” can refer to several different measures. The World Bank indicator SH.H2O.BASW.ZS used here measures the share of the population using at least basic drinking water services. A basic service uses an improved drinking-water source and requires no more than 30 minutes for a round trip to collect water. It is therefore broader and more precise than simply asking whether a household has a piped connection.
The verified latest-available dataset contains 214 economies. Of these, 202 observations are from 2024 and 12 are latest values from 2016–2023. The map shows each economy’s latest available observation, with a dark outline for values that are not from 2024. Distribution statistics below use only the 202 economies with 2024 data.
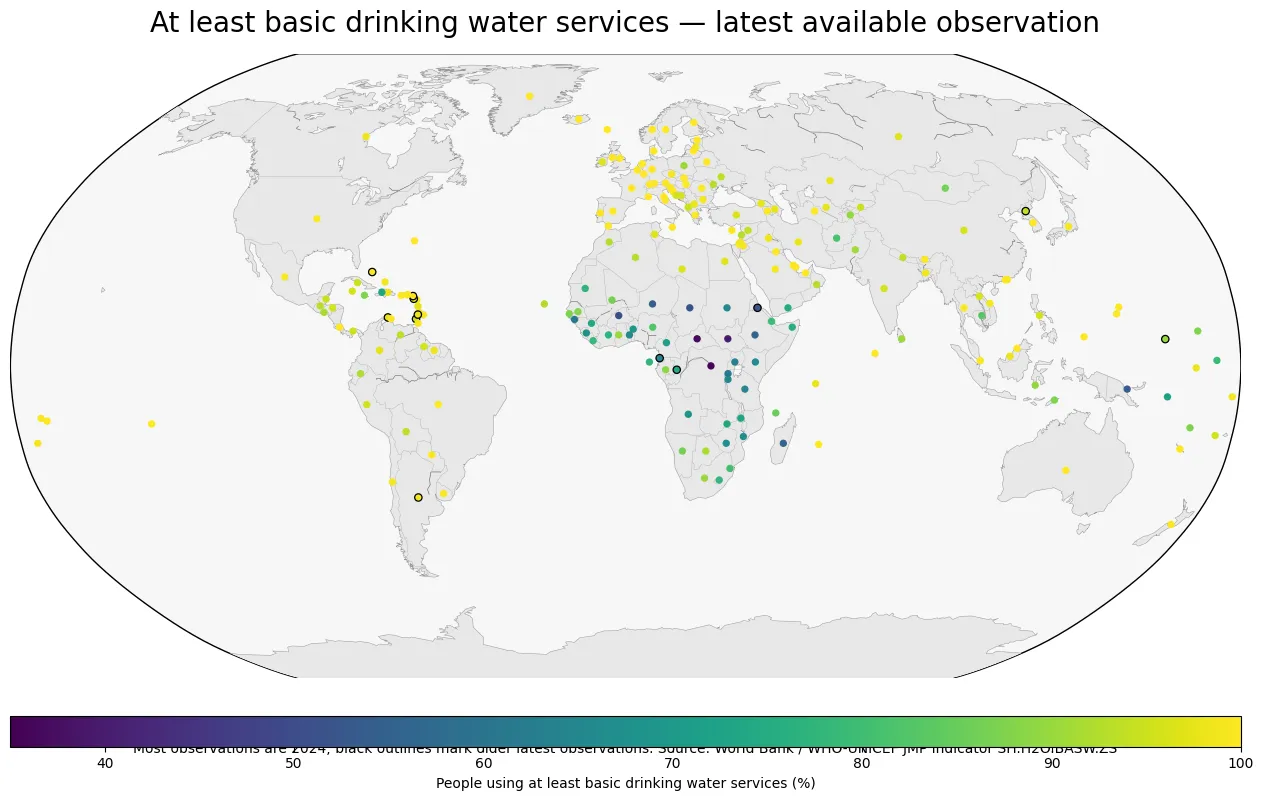
Table of Contents
What counts as an at least basic drinking water service?
The definition combines the type of water source with collection time. Improved sources can include piped water, boreholes or tubewells, protected dug wells, protected springs, and packaged or delivered water. If collection from an improved source takes more than 30 minutes for a round trip, the service may fall below the basic level.
The phrase at least basic matters. The indicator includes people receiving basic service and people receiving the higher “safely managed” level. A country with 98% at least-basic coverage does not necessarily have 98% safely managed coverage. Safely managed drinking water adds requirements such as availability when needed and freedom from specified contamination, so it is a stricter measure.
The 2024 median was 97.38%, but the lower tail remains wide
Among the 202 economies with 2024 observations, the median was 97.38% and the simple mean was 90.87%. The first quartile was 87.68% and the third quartile was 99.92%. The high median shows that near-universal basic coverage is common at the country level, while the lower mean reflects a smaller set of economies where coverage remains much lower.
| 2024 coverage band | Economies |
|---|---|
| <50% | 4 |
| 50–69.9% | 18 |
| 70–84.9% | 19 |
| 85–94.9% | 36 |
| 95–98.9% | 45 |
| 99–100% | 80 |
Many economies cluster near 99–100%, so tiny differences at the top are less informative than the size of the lower-coverage group. National averages also conceal internal disparities. Rural areas, poorer households, informal settlements, and remote communities can face very different conditions even where a national value is high.
The lowest 2024 values show where basic access is still far from universal
The Democratic Republic of Congo records the lowest 2024 value in the verified file at about 35.68%, followed by the Central African Republic at 36.50% and South Sudan at 39.75%. Burkina Faso is near 50.00%, while Chad, Papua New Guinea, and Niger are just above 52–53%. These values show that the global picture is not simply one of universal access with minor residual gaps.
| Economy | 2024 coverage |
|---|---|
| Congo, Dem. Rep. | 35.7% |
| Central African Republic | 36.5% |
| South Sudan | 39.7% |
| Burkina Faso | 50.0% |
| Chad | 52.2% |
| Papua New Guinea | 53.3% |
| Niger | 53.4% |
| Madagascar | 55.3% |
| Ethiopia | 55.6% |
| Rwanda | 61.4% |
A low value does not identify a single cause. Conflict, dispersed rural settlement, climate and water availability, infrastructure investment, maintenance capacity, and institutional conditions may all matter. The map is best used to identify where gaps are concentrated; explaining those gaps requires country-specific evidence.
Near-100% coverage does not describe every dimension of water service quality
Several economies report 100% in 2024, including Andorra, the United Arab Emirates, Belgium, Germany, and Greece. That does not mean every aspect of water service is perfect. This indicator does not by itself measure affordability, continuity of supply, resilience to drought, network condition, or all dimensions of water quality. It measures whether people use at least a basic service.
Different latest years should not be treated as a precise common-year ranking
Twelve of the 214 latest observations are not from 2024. Older latest values can still be useful for broad coverage mapping, but they should not be ranked to decimal precision against 2024 observations as if all countries were measured at the same moment. Water-service coverage can change through infrastructure expansion, conflict, disasters, migration, and survey or estimation updates.
For that reason, this article separates the latest-available map from the 2024-only statistics. It also keeps missingness conceptually separate from zero. A missing observation is not evidence that nobody has access.
What to compare next
At-least-basic coverage is a strong first measure of minimum water access, but it is not the end of the story. Safely managed drinking water, rural-versus-urban access, basic sanitation, and handwashing facilities provide complementary views. In countries already close to universal basic access, these stricter indicators often reveal differences that the basic-access measure cannot.
Frequently Asked Questions
What is an at least basic drinking water service?
It uses an improved drinking-water source and requires no more than 30 minutes for a round trip to collect water.
Is basic drinking water the same as safely managed drinking water?
No. At least basic includes basic service and higher safely managed service; safely managed has additional requirements.
Why does the map include older observations?
It shows each economy’s latest available value, while the same-year statistics are calculated separately from 2024 observations.
Related Articles
Green Map creates custom-edited map images using open geographic data sources such as geoBoundaries, Natural Earth, OpenStreetMap, and government open data.
These maps are edited visual materials, not raw data files, and are provided for education, documents, presentations, and graphic reference.