The U.S. Energy Information Administration (EIA) reports a 2025 annual slice for fuel consumption in the Electric Power Sector Non-CHP category. This comparison uses the total-consumption-btu field with fueltypeid=ALL and sectorid=90 for every available state jurisdiction. The unit is million MMBtu, and the dataset covers all 50 states plus Washington, D.C. It is therefore a state comparison of fuel input under one specific EIA operational definition, not a measure of every form of energy consumed within each state.
Across the 51 rows, the simple sum is 32,374.050 million MMBtu. Texas is the largest observation at 3,524.336, followed by Pennsylvania at 1,992.784 and Florida at 1,985.304. Texas alone represents 10.9% of the row sum. The top three account for 23.2%, and the top ten for 49.2%. The mean is 634.785, while the median is 482.453, so a relatively small group of large state values pulls the average well above the middle observation.
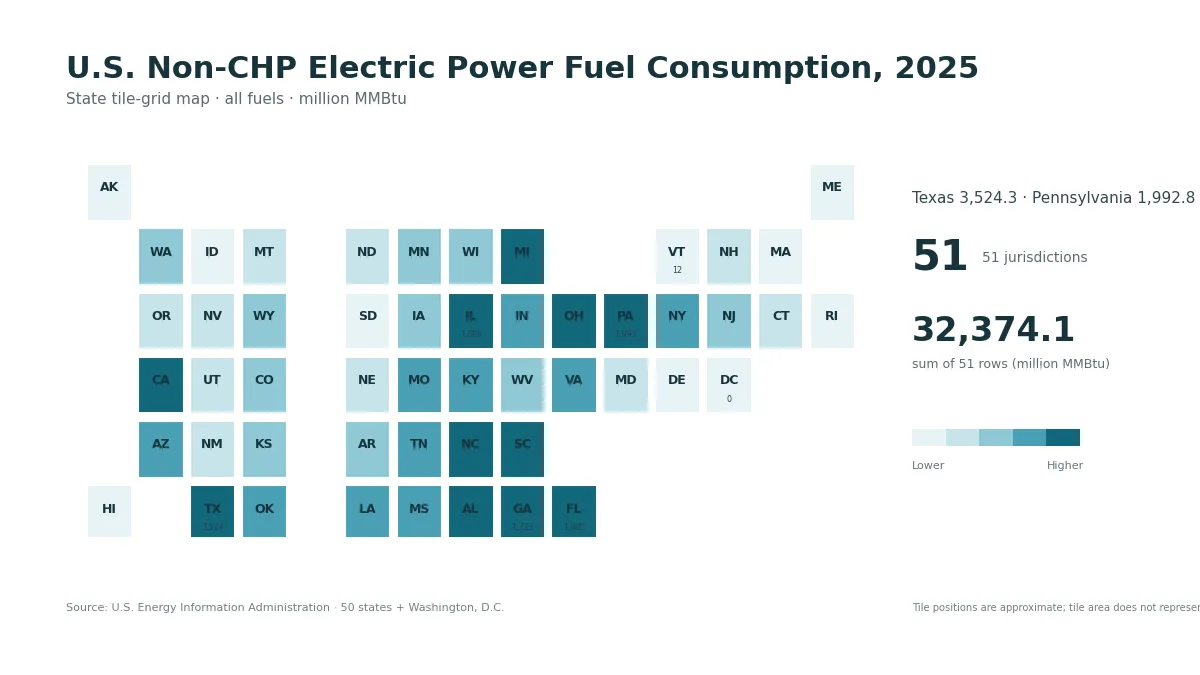
Table of Contents
What this EIA series measures
The source metric is titled “Consumption of Fuels for Electricity Generation and Useful Thermal Output (BTUs).” For this article, the fuel facet is all fuels and the sector facet is Electric Power Sector Non-CHP. The figures are fuel-input energy expressed in thermal units. They are not the same as electricity generated, electricity sold, retail demand, plant capacity, or the cost of fuel. That distinction is important because two states can use different amounts of fuel for reasons that are not visible in this single series.
Non-CHP separates this slice from combined heat and power categories. The supplied data do not break the all-fuels total into causal components, and they do not tell us why a given state is high or low. Plant efficiency, utilization, generation mix, power imports and exports, and demand conditions would require additional datasets. The defensible use of this table is narrower: compare the size of 2025 fuel input across jurisdictions under the same EIA field, unit, fuel facet, and sector facet.
The largest state observations in 2025
Texas stands apart at 3,524.336 million MMBtu, about 7.31 times the median state value. Pennsylvania and Florida are nearly tied around 2,000 million MMBtu, and Illinois follows at 1,686.492. Georgia is fifth at 1,223.174. Ohio, Alabama, North Carolina, California, and South Carolina complete the top ten. These rankings are based on absolute fuel input, so they should not be interpreted as per-capita intensity or efficiency rankings.
| Rank | State or jurisdiction | 2025 value (million MMBtu) |
|---|---|---|
| 1 | Texas | 3,524.336 |
| 2 | Pennsylvania | 1,992.784 |
| 3 | Florida | 1,985.304 |
| 4 | Illinois | 1,686.492 |
| 5 | Georgia | 1,223.174 |
| 6 | Ohio | 1,179.560 |
| 7 | Alabama | 1,177.059 |
| 8 | North Carolina | 1,139.445 |
| 9 | California | 1,022.704 |
| 10 | South Carolina | 983.534 |
The top five jurisdictions represent 32.2% of the 51-row sum. Extending the cutoff to the top ten raises that share to 49.2%, and the top fifteen account for 62.8%. This shows meaningful concentration among large state systems without reducing the national pattern to only one or two places. A substantial portion of the total remains distributed across the broad middle of the ranking.
Median, quartiles, and the shape of the distribution
The median of 482.453 million MMBtu is a useful benchmark because it is less sensitive to extreme values than the mean. The first quartile is 256.565, and the third quartile is 850.892. In other words, the middle half of the 51 jurisdictions falls roughly between 256.6 and 850.9 million MMBtu. Texas is far beyond that range, while several other large states also sit well above the upper quartile.
The gap between the mean and median is a reminder that “average state” can be misleading in a skewed distribution. A jurisdiction near the mean ranks above the midpoint because the mean is lifted by the largest observations. For quick comparison, the median works well as a typical-state reference, while the top-share statistics show how much of the row sum is concentrated near the top. Neither statistic explains the underlying operating causes; they simply describe the distribution of the EIA values.
Very small values are still observations, not missing data
All 51 jurisdictions have a numeric value in the supplied 2025 file, so no missing record was replaced with zero. Washington, D.C. is the smallest at 0.173 million MMBtu, followed by Vermont at 12.490, Delaware at 34.514, Alaska at 49.285, and Hawaii at 67.605. These small values remain part of the ranking because they are reported observations. Treating them as missing would change both the distribution and the summary statistics.
| Low-to-high rank | State or jurisdiction | 2025 value (million MMBtu) |
|---|---|---|
| 1 | District of Columbia | 0.173 |
| 2 | Vermont | 12.490 |
| 3 | Delaware | 34.514 |
| 4 | Alaska | 49.285 |
| 5 | Hawaii | 67.605 |
| 6 | Rhode Island | 76.209 |
| 7 | Maine | 83.121 |
| 8 | Idaho | 101.975 |
| 9 | South Dakota | 104.251 |
| 10 | Massachusetts | 151.359 |
A low value does not mean that a jurisdiction uses little electricity overall, nor does it prove that its electric system is more efficient. The metric is limited to all-fuels input in the non-CHP electric power sector. Differences in generation structure, classification, local capacity, imported electricity, and other operational factors may matter, but they are outside the evidence supplied by this one series. The safest interpretation is simply that these jurisdictions reported smaller values for this specific EIA measure in 2025.
How to read the state tile-grid map
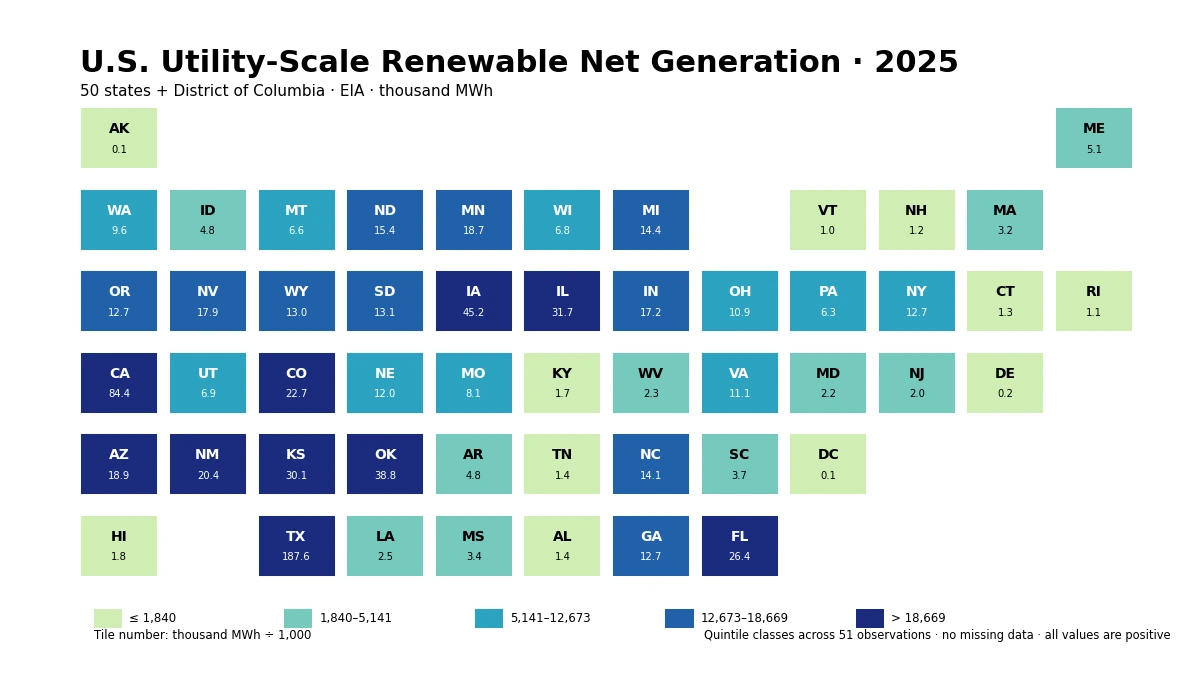
The featured visual uses an equal-size state tile grid rather than conventional geographic polygons. Every state and Washington, D.C. receives one tile, so small northeastern states remain visible and Alaska does not dominate the layout by land area. Darker tiles correspond to higher value bands in the same 51-row dataset. The layout is geographically approximate; the size of a tile carries no quantitative meaning.
The grid makes regional clusters easier to scan, but it should be paired with the ranking table. Several southern and eastern states occupy higher bands, while many small northeastern and western jurisdictions appear in lower bands. That visual pattern is descriptive, not causal. It can guide a second-stage analysis—for example, comparing fuel mix or generation—but it does not identify weather, population, industry, or policy as the reason for the differences.
Why “all fuels” matters
The all-fuels facet is an aggregate category. It is useful when the question is the total scale of fuel input under the selected sector definition, but it does not reveal how much of a state’s value comes from natural gas, coal, petroleum, renewables, or other individual categories. A state with a high total could have a very different fuel mix from another state with a similar total. Fuel-specific EIA slices are necessary for that comparison.
This distinction also helps prevent double counting when multiple EIA articles are compared. The all-fuels total should be treated as the broad total for the selected facet combination, while fuel-specific series are components or related views. Adding multiple overlapping categories together without checking EIA definitions could produce a misleading number. For this page, all calculations stay within the single all-fuels series supplied for opportunity 14384.
What a single year can and cannot show
Because the file contains only 2025 observations, the analysis is cross-sectional. It can rank states and describe the spread in that year, but it cannot establish a trend. Statements such as “Texas increased” or “Vermont declined” would require at least one comparable prior year using the same field, fuel facet, sector facet, and unit. A future time-series extension should preserve those definitions before calculating changes.
The same caution applies to structural conclusions. A high 2025 value may reflect long-standing generation patterns or temporary operating conditions; a single-year slice cannot distinguish between them. The current dataset is best viewed as a benchmark for where states stood under this EIA definition in 2025. It is a strong starting point for follow-up work but not a substitute for a multiyear operational analysis.
Practical ways to use the comparison
For market or research screening, the ranking can identify states where the absolute scale of non-CHP electric-power fuel input is large. Analysts can then connect those states to generation by fuel, plant capacity, emissions, electricity sales, or price datasets. The median and quartiles help separate a small number of very large systems from the broad middle without relying only on the top ten.
If the question is intensity rather than scale, a denominator is needed. Fuel input per resident would require population; fuel input per unit of electricity generated would require generation; fuel input relative to economic output would require a compatible economic measure. Those ratios answer different questions and should not be inferred from the absolute totals shown here. This page intentionally keeps the published observations unnormalized so the base quantity remains clear.
Source and calculation notes
The source is the U.S. Energy Information Administration electricity/electric-power-operational-data API. The annual field is total-consumption-btu, fueltypeid is ALL, sectorid is 90, and the unit is million MMBtu. The supplied file contains 51 rows for 2025: the 50 states and Washington, D.C. Summary values on this page were calculated directly from those observations. No missing-value imputation, cross-year substitution, or third-party estimates were used.
The 32,374.050 million MMBtu figure is a simple sum of the 51 jurisdiction rows. It should not automatically be treated as an independently published national total, because a separate EIA U.S. aggregate may use its own aggregation or rounding conventions. For the purpose of state comparison, the consistent approach is to use the same set of jurisdiction rows for the sum, shares, mean, median, quartiles, and ranking.
Frequently Asked Questions
Does this measure total energy consumption in each state?
No. It is the EIA all-fuels, total-consumption-btu series for the Electric Power Sector Non-CHP category. It is not total residential, commercial, industrial, and transportation energy use.
Are any of the 51 jurisdictions missing a 2025 value?
No. All 50 states and Washington, D.C. have a numeric observation in the supplied file, and no missing record was replaced with zero.
Does the dataset explain why Texas is highest?
No. It measures the scale of fuel input. Explaining the ranking would require additional data on generation, capacity, utilization, fuel mix, demand, and other operating conditions.
Related Articles
Green Map creates custom-edited map images using open geographic data sources such as geoBoundaries, Natural Earth, OpenStreetMap, and government open data. These maps are edited visual materials, not raw data files, and are provided for education, documents, presentations, and graphic reference.