North America and Western Europe are major destinations for internationally mobile tertiary students, but raw student counts do not show how intensive that flow is relative to the size of each origin population. UNESCO Institute for Statistics indicator MOGER.5T8.40500 provides a population-normalized view: it compares internationally mobile tertiary students from each origin who are studying in North America and Western Europe with the origin country’s five-year reference-age population immediately following upper-secondary education.
The verified 2023 extract contains 200 countries and separately reported areas. The unweighted country-row median is 0.85%, while the simple mean is 3.28%. The mean is much higher than the median because several small states and territories have very high values. All rows in this extract refer to 2023, so the comparison does not mix observation years.
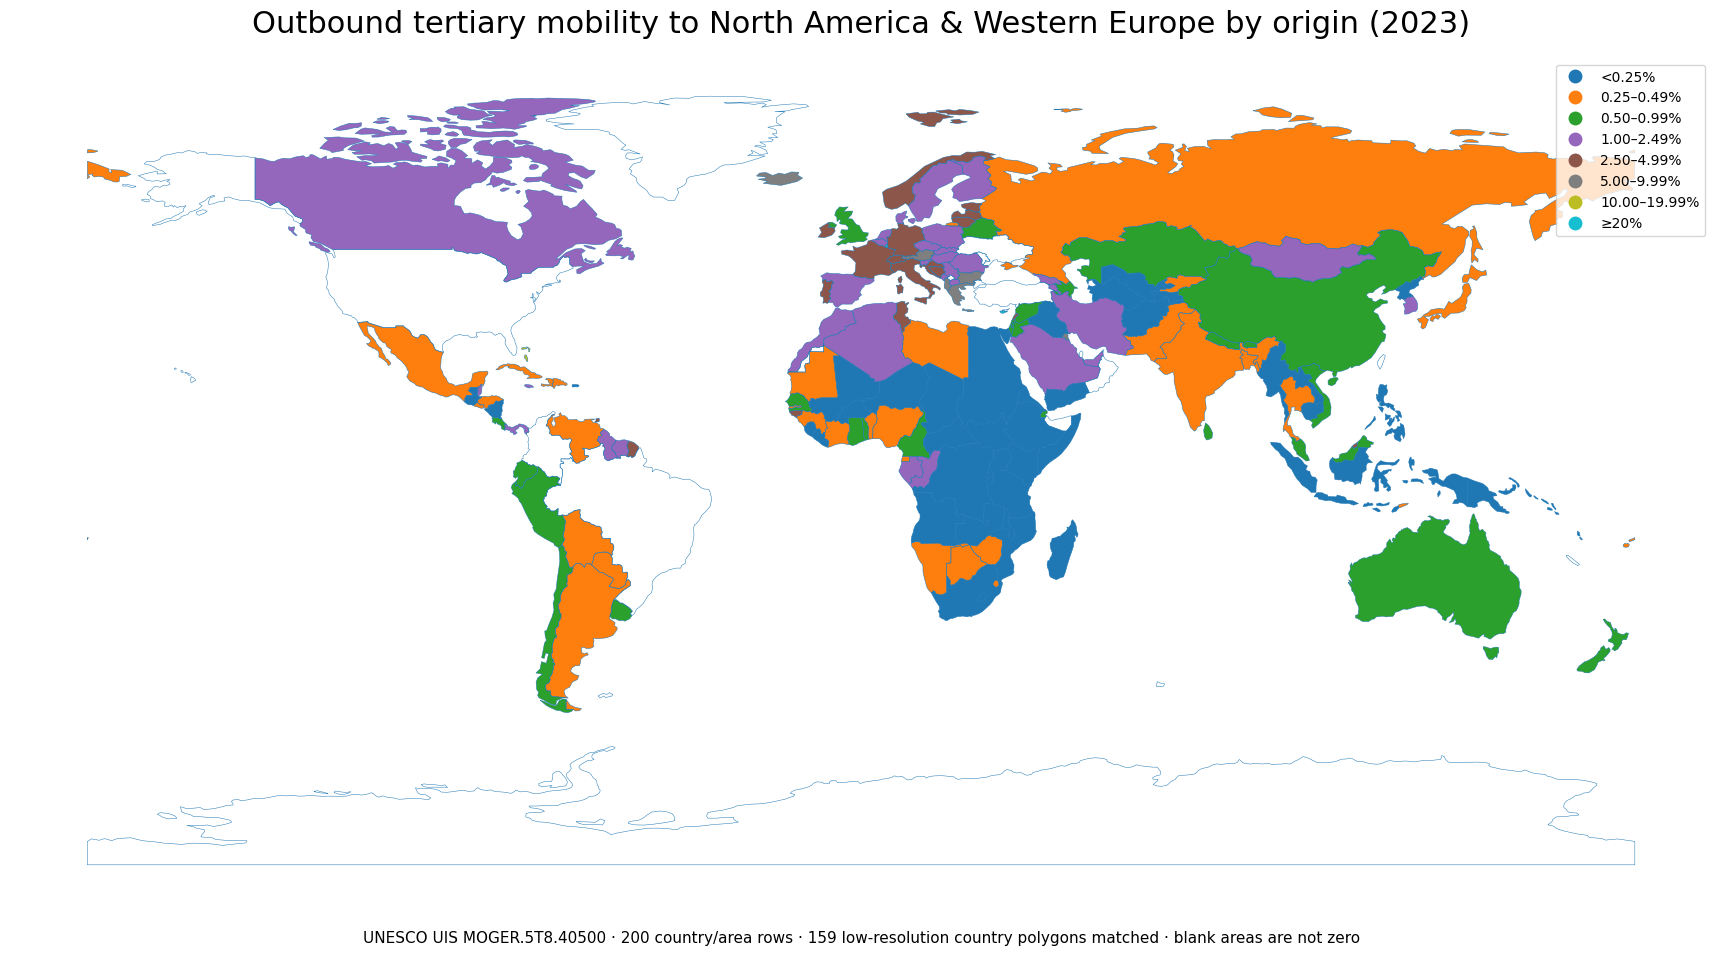
Table of Contents
This is not the share of all tertiary students who study abroad
UIS defines the mobile outbound gross enrolment ratio as internationally mobile tertiary enrolment in a specified host country or region expressed relative to the population in the five-year age group immediately following the end of upper-secondary education. This particular series restricts the destination to North America and Western Europe and combines both sexes. The numerator is therefore a destination-specific internationally mobile student count, while the denominator is an origin-country reference-age population.
A value of 5% does not mean that 5% of all university students in the origin country are studying in North America or Western Europe. Total tertiary enrolment is not the denominator. Because this is a gross ratio, the numerator can also include mobile students outside the reference age range. It should be interpreted as the scale of outbound tertiary mobility relative to the origin’s post-secondary reference-age population, not as an individual probability of studying abroad.
International student mobility is also narrower than any form of cross-border learning. UIS treats physical movement between education systems as central to international student mobility; distance learning from a foreign institution without crossing an international border is not counted in the same way. The country of origin is ideally based on where the student obtained upper-secondary qualifications, with residence or citizenship used only when countries cannot apply the preferred definition.
The median is 0.85%, and 26 countries or areas are at 5% or more
Across the 200 rows, the first quartile is 0.29%, the median is 0.85%, and the third quartile is 2.57%. Half of the observations therefore lie between roughly 0.29% and 2.57%. Values above 5% are already in the upper tail of this distribution.
There are 44 observations below 0.25%, 34 from 0.25% to 0.49%, and 30 from 0.50% to 0.99%. Together, 108 of the 200 rows are below 1%. At the other end, 26 are at or above 5%, 14 are at or above 10%, 8 are at or above 20%, and only 5 reach 30% or more.
| 2023 ratio band | Countries/areas |
|---|---|
| Below 0.25% | 44 |
| 0.25–0.49% | 34 |
| 0.50–0.99% | 30 |
| 1.00–2.49% | 39 |
| 2.50–4.99% | 27 |
| 5% or more | 26 |
The simple mean of 3.28% is not a population-weighted world rate. Every country or area contributes one row regardless of population size, so a microstate and a very large country have equal weight in that arithmetic average. The median and the full distribution are more useful for understanding what a typical row looks like.
The highest ratios are concentrated among small states and territories
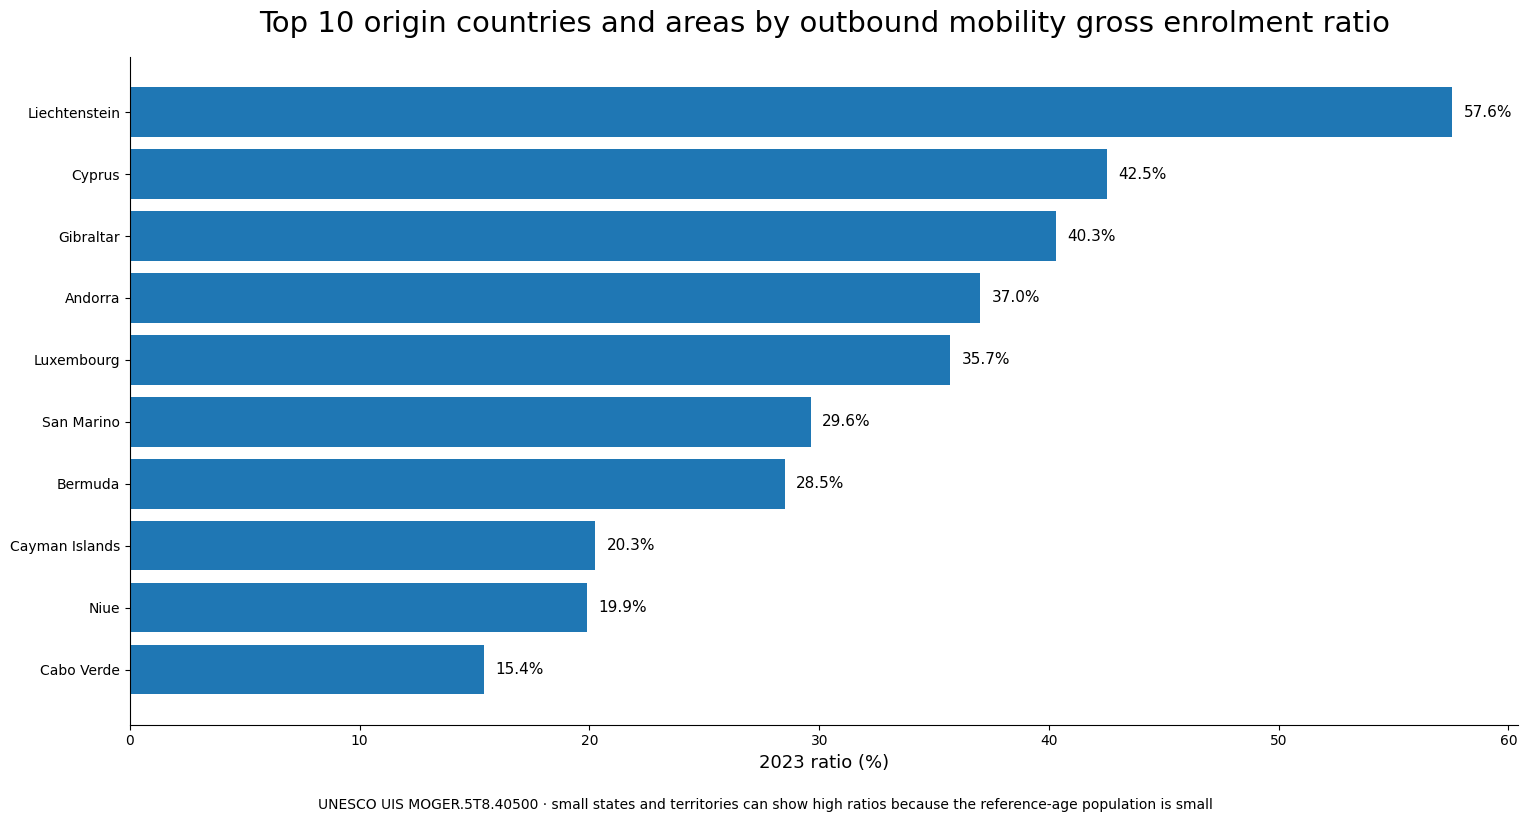
Liechtenstein records 57.56%, followed by Cyprus at 42.51%, Gibraltar at 40.31%, Andorra at 37.01%, and Luxembourg at 35.69%. San Marino and Bermuda are also high at 29.63% and 28.50%. These values should not be read as absolute student counts. A modest number of mobile students can produce a large ratio when the five-year reference-age population is small.
| Country or area | Code | 2023 ratio |
|---|---|---|
| Liechtenstein | LIE | 57.56% |
| Cyprus | CYP | 42.51% |
| Gibraltar | GIB | 40.31% |
| Andorra | AND | 37.01% |
| Luxembourg | LUX | 35.69% |
| San Marino | SMR | 29.63% |
| Bermuda | BMU | 28.50% |
| Cayman Islands | CYM | 20.25% |
| Niue | NIU | 19.89% |
| Cabo Verde | CPV | 15.40% |
| Dominica | DMA | 14.51% |
| Bahamas | BHS | 13.45% |
| China, Hong Kong Special Administrative Region | HKG | 11.07% |
| British Virgin Islands | VGB | 10.60% |
| Montserrat | MSR | 9.73% |
The ranking also includes separately reported territories such as Gibraltar, Bermuda, the Cayman Islands, the British Virgin Islands, and Montserrat. It is therefore better described as a ranking of UIS country-and-area statistical units than as a list of sovereign states only.
Larger economies generally sit in the low-single-digit range
Removing attention from the microstate tail gives a different sense of scale. Iceland is 8.31% and Ireland 4.42%. Germany is 2.60%, France 2.55%, and the Republic of Korea 2.44%. Canada is 1.80% and Saudi Arabia 1.24%. The United Kingdom is 0.75%, China 0.73%, Australia 0.54%, India 0.48%, Japan 0.38%, Mexico 0.31%, and South Africa 0.17%.
| Selected origin | Code | 2023 ratio |
|---|---|---|
| Iceland | ISL | 8.31% |
| Ireland | IRL | 4.42% |
| Germany | DEU | 2.60% |
| France | FRA | 2.55% |
| Republic of Korea | KOR | 2.44% |
| United Arab Emirates | ARE | 2.41% |
| Canada | CAN | 1.80% |
| Saudi Arabia | SAU | 1.24% |
| United Kingdom of Great Britain and Northern Ireland | GBR | 0.75% |
| China | CHN | 0.73% |
| Australia | AUS | 0.54% |
| India | IND | 0.48% |
| Japan | JPN | 0.38% |
| Mexico | MEX | 0.31% |
| South Africa | ZAF | 0.17% |
These values still do not measure each origin country’s total propensity to study abroad. The destination is restricted to North America and Western Europe. Students who move to East Asia, Oceania, the Middle East, Eastern Europe, or another destination region are outside this series. A complete view of outward student mobility requires all-destination outbound mobility indicators or destination-by-origin student counts.
Why can a small state reach 20%, 30%, or even 50%?
A gross enrolment ratio is sensitive to the size of its denominator. In a small state or territory, the five-year population immediately following upper-secondary education may be small enough that a few thousand, or sometimes far fewer, mobile tertiary students represent a large percentage. Cross-border access to nearby universities can also be an ordinary part of the education system rather than an exceptional choice.
Domestic programme availability, language, historical ties, scholarship arrangements, visa rules, transport connections, and university networks can all shape mobility. The indicator does not identify which of these mechanisms caused a high or low value. It is a measurement of the resulting flow relative to a reference population, not a causal model.
The same caution applies in the opposite direction. A low ratio does not automatically mean that a country is internationally isolated. Students may choose other destination regions, domestic tertiary capacity may be large, or absolute outbound numbers may still be substantial in a populous country. Ratios and headcounts answer different questions.
A low value does not mean that students never study abroad
The smallest values in the extract include Papua New Guinea at 0.0163%, the Democratic People’s Republic of Korea at 0.0188%, South Sudan at 0.0193%, and Somalia at 0.0254%. These are destination-specific ratios. They do not include every internationally mobile student from those origins, and they do not measure domestic tertiary participation.
Very small differences at the bottom should not be over-ranked. A difference between 0.08% and 0.10% is not, by itself, evidence of a meaningful policy or economic gap. Small numerators, reporting coverage, and origin-country classification can matter when the observed ratio is close to zero.
The series is most useful for recognizing broad differences in mobility intensity, the concentration of high ratios among small systems, and origin-country connections to the North American and Western European destination region. It is not an education-performance scorecard.
Some small islands and territories are not visible as separate map polygons
The statistical file contains 200 country and area rows, while the low-resolution world boundary layer used for the map matches 159 country polygons. Very small islands and territories may be present in the table but lack a separate polygon at this map resolution. France and Norway were matched through their standard ISO-3 codes before plotting.
An unfilled area on the map does not mean a reported value of zero. It can indicate missing geometry or no matched row. Exact comparisons should therefore use the numerical tables, while the map is best treated as a quick spatial overview.
The ratio does not measure university quality or the economic return to studying abroad
A high outbound ratio to North America and Western Europe does not prove that domestic universities are weak, and a low ratio does not prove that they are strong. Student mobility can reflect programme availability, language, funding, visa access, family networks, migration pathways, perceived labour-market returns, and many other factors.
The series also does not measure graduation rates, tuition costs, scholarship coverage, post-study employment, return migration, brain drain, or permanent settlement. Those questions require separate evidence, preferably including headcounts, destination shares, completion outcomes, and labour-market or migration statistics.
The destination grouping matters as well. North America and Western Europe are only one part of global higher-education mobility. An origin with strong links to East Asia or another region can look low here while still having a substantial overall outbound student population.
Data source and comparison method
The statistical source is UNESCO Institute for Statistics indicator MOGER.5T8.40500 for 2023, both sexes combined. It reports the mobile outbound gross enrolment ratio for tertiary students from each origin who are studying in North America and Western Europe. All summary statistics, thresholds, rankings, and tables in this article are calculated directly from the 200 verified rows.
Missing observations were not converted to zero, and observations from different years were not mixed. All 200 rows in the verified extract are dated 2023, which supports a synchronized cross-country comparison. Small-state outliers remain genuine source values, but they should be interpreted alongside population size and, where possible, absolute student counts.
For interpretation, the UIS glossary is important because the denominator differs from the more familiar outbound mobility ratio that uses total tertiary enrolment. The purpose of this indicator is to compare the relative scale of destination-specific tertiary mobility, not to rank education systems.
Frequently Asked Questions
Is this the percentage of all tertiary students who study in North America and Western Europe?
No. The denominator is the five-year age group immediately following upper-secondary education, not total tertiary enrolment. It is a gross enrolment ratio that normalizes destination-specific mobile students by the origin reference-age population.
Why are ratios especially high for small states and territories?
Their reference-age populations can be small, and cross-border tertiary study may be a normal part of the education system. A high ratio does not necessarily mean a large absolute number of students.
Can the 2023 values be treated as a synchronized ranking?
The observation year is synchronized, but statistical units differ greatly in population and some are territories rather than sovereign states. The ratio should be interpreted together with population size and, where available, student headcounts.
Does a low value mean that few students from that origin study abroad?
Not necessarily. This series includes only students studying in North America and Western Europe. Students going to other destination regions are outside the measure.
Related Articles
The following articles provide complementary views of tertiary education structure and attainment.
- Private tertiary enrolment share by country
- Short-cycle tertiary attainment for adults 25+
- Post-secondary attainment for adults 25+
Green Map creates custom-edited map images using open geographic data sources such as geoBoundaries, Natural Earth, OpenStreetMap, and government open data.
These maps are edited visual materials, not raw data files, and are provided for education, documents, presentations, and graphic reference.