How common is a Master’s degree or equivalent among adults age 25 and older? UNESCO Institute for Statistics indicator EA.7T8.AG25T99 measures the percentage of the population age 25+ who have completed Master’s or equivalent education or a higher level, for both sexes combined. Adults whose highest completed level is only a bachelor’s degree are not included, while doctoral or equivalent attainment is included.
Among the 75 country and area observations available for 2023, the unweighted median is 7.7% and the mean is 9.0%. 35 observations are at or above 10%, 19 are at or above 15%, and only 5 reach 20% or more. At the other end, 13 observations are below 1%, showing a very wide cross-country spread.
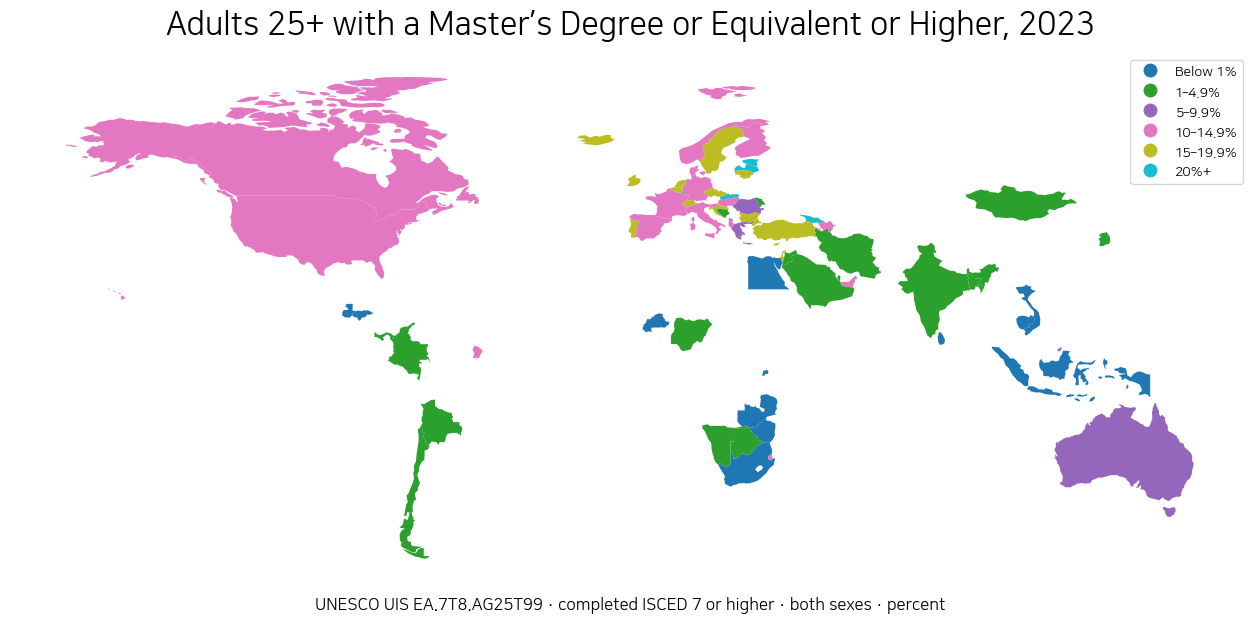
Table of Contents
What ‘Master’s or equivalent or higher’ means
UIS defines educational attainment as the highest ISCED level that an individual has successfully completed. ISCED 7 covers Master’s or equivalent programmes, which are generally designed to provide advanced academic or professional knowledge, skills and competencies. ISCED 8 covers doctoral or equivalent programmes and is included by the phrase ‘or higher.’ The indicator therefore represents an accumulated stock of advanced educational attainment rather than current participation in graduate school.
The international classification matters because national degree names and programme structures are not identical. Some professional qualifications are classified at a level equivalent to a Master’s degree even when the national title differs, while other long programmes may be structured differently. UIS uses the ISCED framework so that countries can be compared by education level rather than by matching degree names word for word.
The denominator is the population age 25 and older and the sex category is both sexes. The series is not the number of new Master’s graduates in 2023, the share of university students in postgraduate programmes, or the rate at which bachelor’s graduates progress immediately into graduate education. It combines many cohorts and therefore moves more slowly than annual graduation flows.
Thirty-five of the 75 observations are at or above 10%
35 of the 75 observations, or about 46.7%, are at least 10%. 19 reach 15% or more and 5 reach 20% or more. 41 observations are at least 5%, while 34 are below 5%, including 13 below 1%. The data therefore do not cluster around a single typical level.
The first quartile is 2.4% and the third quartile is 15.1%, which means the middle half of the observations lies roughly between those two values. The median is 7.7%, while the mean is higher at 9.0% because the countries in the upper teens and twenties pull the average upward.
The 75-country coverage is also an important limitation. These are the 2023 country and area observations available in the supplied UIS series, not a perfectly complete list of every country in the world. It is more responsible to discuss the observed distribution and relative positions than to present the table as a definitive global league ranking.
Luxembourg, Georgia and Slovakia have the highest values
Luxembourg has the highest 2023 observation at 29.1%. Georgia follows at 26.4%, Slovakia at 22.3%, Estonia at 21.8% and Latvia at 20.2%. Those are the only five observations in this dataset at or above 20%. In those countries, at least one in five adults age 25+ is recorded as having completed Master’s-equivalent or higher education.
Bulgaria at 18.9%, Switzerland at 18.8%, Croatia at 17.0%, Sweden at 17.0%, Iceland at 16.7%, Czechia at 16.6%, Portugal at 16.3%, Belgium at 16.0% and Ireland at 16.0% are also near the upper end. European countries are prominent in the top group, but Georgia and other observations show that the pattern cannot be reduced to a simple continent-wide rule.
A high rate should not automatically be treated as proof of a better education system. National programme structures, professional licensing, the role of Master’s degrees in labour-market entry, historical access to higher education and the migration of highly educated adults can all affect the stock of advanced qualifications in the adult population.
| Rank | Country | ISO3 | 2023 rate |
|---|---|---|---|
| 1 | Luxembourg | LUX | 29.1% |
| 2 | Georgia | GEO | 26.4% |
| 3 | Slovakia | SVK | 22.3% |
| 4 | Estonia | EST | 21.8% |
| 5 | Latvia | LVA | 20.2% |
| 6 | Bulgaria | BGR | 18.9% |
| 7 | Switzerland | CHE | 18.8% |
| 8 | Croatia | HRV | 17.0% |
| 9 | Sweden | SWE | 17.0% |
| 10 | Iceland | ISL | 16.7% |
The Republic of Korea is at 4.9%, below the median
The Republic of Korea has a 2023 value of 4.9%. That is slightly below the 5% threshold and below the 75-observation median of 7.7%. The number describes adults age 25+ who have already completed a Master’s-equivalent or higher level. It is not Korea’s graduate-school admission rate or a one-year percentage of students earning a Master’s degree.
The United States is at 14.8%, France 13.5%, Germany 12.7%, Canada 11.2% and Australia 9.6%. The United States, France and Germany are above the 10% threshold, while Australia is just below it. These comparisons show differences in accumulated advanced-degree attainment but do not, by themselves, identify which education system is more effective.
India is at 3.1% and South Africa at 0.8%. Countries can also have very different gaps between bachelor’s-or-higher and Master’s-or-higher attainment. A large bachelor’s-educated population does not guarantee a similarly large postgraduate-educated population if progression into graduate education is relatively selective.
| Country | ISO3 | 2023 Master’s-or-higher rate |
|---|---|---|
| Republic of Korea | KOR | 4.9% |
| United States | USA | 14.8% |
| Germany | DEU | 12.7% |
| France | FRA | 13.5% |
| Canada | CAN | 11.2% |
| Australia | AUS | 9.6% |
| India | IND | 3.1% |
| South Africa | ZAF | 0.8% |
Thirteen observations are below 1%
At the lower end, Zimbabwe is at 0.22%, Egypt 0.38%, Honduras 0.41%, Guatemala 0.42%, Zambia 0.45%, Cambodia 0.60%, Kiribati 0.66%, Viet Nam 0.70%, Rwanda 0.71% and Indonesia 0.72%. South Africa and Burkina Faso are also below 1%. These figures refer to the share of the entire age-25-plus population, not the availability of graduate programmes.
A rate below 1% does not mean that a country has no Master’s programmes. It means that relatively few adults in the population have accumulated a Master’s-equivalent or higher completed qualification. Historical tertiary access, the size of the bachelor’s-educated population, the cost and capacity of graduate education, labour-market incentives and international migration may all contribute to the observed level.
National qualification systems also differ. In some countries an advanced degree is commonly required for particular professions, while elsewhere a bachelor’s degree, professional certification or work experience may be sufficient. Those institutional differences can change the proportion of adults who continue to ISCED 7 even when undergraduate education is widespread.
Bachelor’s-or-higher and Master’s-or-higher answer different questions
Bachelor’s-or-higher attainment describes how widely undergraduate-level tertiary completion has spread through the adult population. Master’s-or-higher attainment asks how much further advanced education has accumulated beyond that point. The two indicators are related, but their country rankings need not match because progression from bachelor’s to graduate education differs substantially.
A country can have a large bachelor’s-educated population but a lower Master’s share if postgraduate study is a selective professional pathway. Another country can have a higher Master’s share when integrated long-cycle programmes, professional Master’s qualifications or postgraduate credentials are common. For this reason, the Master’s rate should be read as a separate layer rather than a substitute for total tertiary attainment.
If the analytical goal is broad tertiary access, the bachelor’s-or-higher indicator is usually the starting point. If the goal is to examine how common advanced qualifications are, the Master’s-or-higher series adds useful information. A doctoral-only question would require a separate ISCED 8 measure rather than inferring doctoral prevalence from this combined ISCED 7-plus indicator.
An age-25-plus attainment measure changes slowly
The population age 25 and older includes many generations. A rapid recent increase in graduate enrolment or Master’s completion affects only a small part of the total adult population at first, so the attainment rate changes gradually. The stock can remain low for years after access improves, or remain high for a time even if recent graduate flows become smaller.
Cohort history therefore matters. Countries expanded tertiary education at different times, and adults who are now in their fifties or sixties faced very different postgraduate opportunities when they were young. A 2023 cross-section mixes those histories together, which is why it should not be interpreted as a direct score for current graduate-education policy.
Migration can also change the composition of advanced attainment. Countries that attract adults with Master’s and doctoral qualifications can increase the share of highly educated residents, while countries that experience sustained emigration of highly educated workers may see a different pattern. The indicator captures the resulting resident population but does not identify the source of the change.
Because both sexes are combined, the indicator does not show gender gaps
EA.7T8.AG25T99 combines women and men. A country can have an overall Master’s-or-higher rate of 10% while still having a substantial difference between female and male attainment. To study that dimension, sex-disaggregated attainment rates or an appropriate gender parity measure are needed.
This is particularly relevant because recent cohorts in many education systems have experienced changing gender patterns in tertiary completion. The age-25-plus total can blend recent female gains with older cohort differences. An overall percentage is therefore useful for total advanced attainment but not sufficient for analysing gender balance.
A high share of advanced degrees is not the same as education quality
The indicator counts completed levels of education. It does not evaluate the curriculum, research quality, learning outcomes, labour-market relevance, wages or productivity associated with those degrees. Two countries with identical Master’s-or-higher percentages can have very different fields of study, programme quality and employment outcomes.
A broader assessment of human capital would need additional evidence such as literacy and numeracy, field-of-study composition, research capacity, employment structure and the use of skills in the labour market. The Master’s-or-higher rate is best treated as one clearly defined measure of how widespread advanced formal qualifications are among adults.
Blank areas on the map are not zero
Of the 75 statistical rows, 68 match separate country polygons in the low-resolution boundary layer used for the map. Several small states or areas may not appear as independent shapes at this resolution even when they have valid observations. Their values remain part of the tables and calculations.
Countries that are not present in the 2023 extract are also left unclassified. Missing data and an observed rate of 0% are different statistical states, so a blank map area should never be interpreted as evidence that no adults have Master’s-equivalent or higher qualifications.
A single 2023 cross-section cannot show the speed of change
This dataset compares one year. It cannot tell whether a country’s advanced-attainment rate has been rising quickly, remaining stable or declining. A trend analysis would require multiple years of the same indicator and careful attention to any breaks in national data or classification.
Adult attainment measures also respond slowly to policy. Expanding graduate funding today will not immediately transform the educational profile of everyone age 25 and older. New graduates have to accumulate across multiple cohorts before the effect becomes large in the population stock. This lag is another reason not to use the 2023 level as a simple scorecard for recent policy decisions.
Data source and interpretation
Country values come from the UNESCO UIS Data Browser for indicator EA.7T8.AG25T99, using the 2023 observations. The UIS Glossary defines educational attainment as the highest ISCED level successfully completed and describes ISCED 7 as Master’s or equivalent level.
The mean, median, quartiles and threshold counts give every one of the 75 country and area observations equal weight. They are not population-weighted global estimates. The percentage values are used directly as published by UIS without creating additional estimates.
The original internal classification tags incorrectly identified the provider as World Bank, while the official metadata and API indicator are UNESCO UIS EA.7T8.AG25T99. The completed content corrects that provider identity to UNESCO UIS.
Frequently Asked Questions
Does Master’s-or-higher attainment include doctoral degrees?
Yes. The indicator includes adults who completed ISCED 7 Master’s or equivalent education and anyone who completed a higher level such as ISCED 8 doctoral or equivalent education.
Is Korea’s 4.9% a graduate-school enrolment rate?
No. It is the share of the population age 25+ in 2023 who had already completed a Master’s-equivalent or higher level. It is not a one-year enrolment or graduation rate.
Is the 9.0% average a global population average?
No. It is an unweighted mean across the 75 country and area observations. It does not weight countries by the size of their age-25-plus populations.
Does a high Master’s-or-higher rate prove that an education system is better?
No. It measures one aspect of advanced-degree attainment. Overall tertiary attainment, learning quality, labour-market structure, cohort composition and other factors are needed for a broader assessment.
Related Maps
Green Map creates custom-edited map images using open geographic data sources such as geoBoundaries, Natural Earth, OpenStreetMap, and government open data.
These maps are edited visual materials, not raw data files, and are provided for education, documents, presentations, and graphic reference.