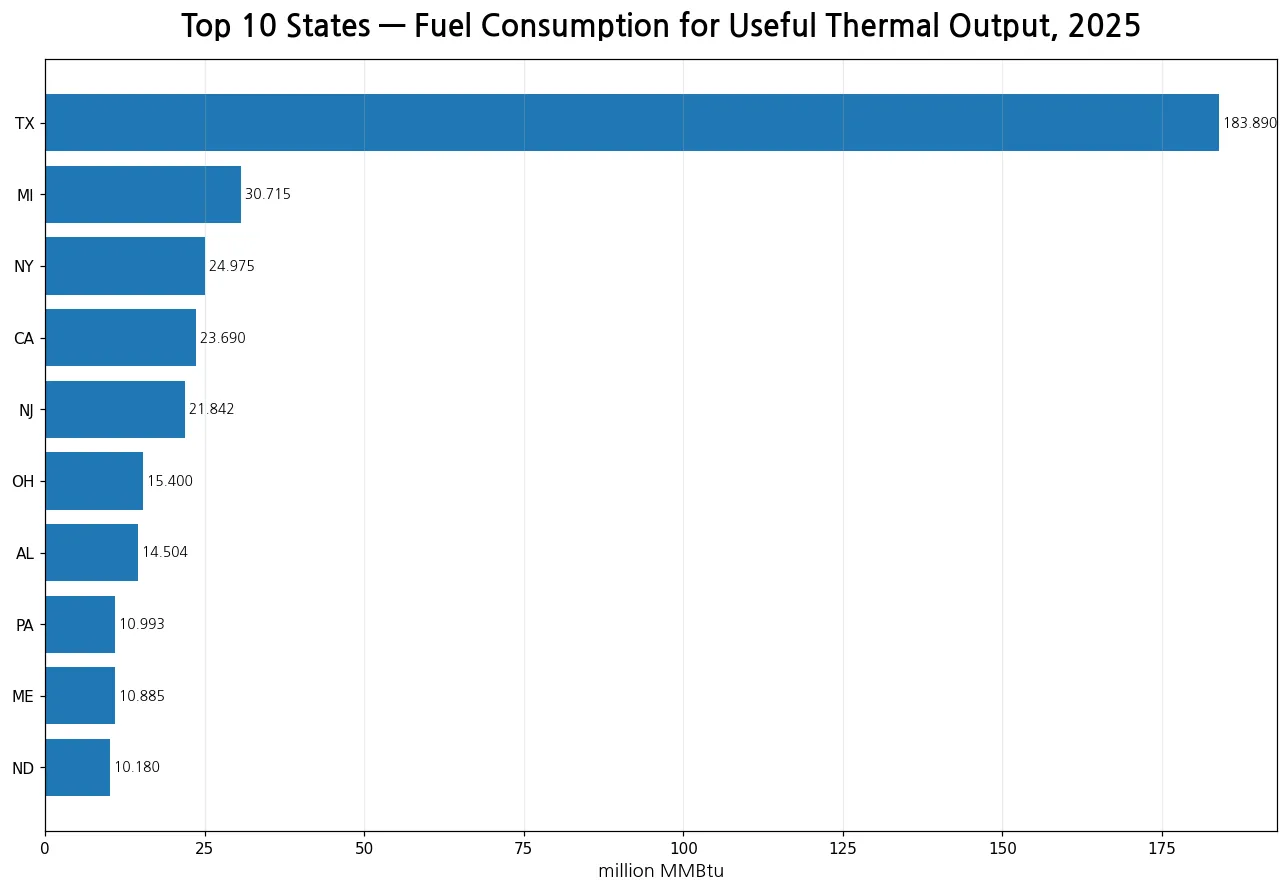
Texas stands out sharply in the 2025 U.S. Energy Information Administration series for fuel consumed to produce useful thermal output in the Electric Power sector. Its published value is 183.88975 million MMBtu, compared with 30.71528 million MMBtu in Michigan, the second-highest state. New York, California, and New Jersey follow. The file contains one annual observation for each of the 50 states plus the District of Columbia, and the sum of those 51 observations is 462.56136 million MMBtu. This is not a net-generation ranking and it is not a generic measure of all fuel used by every part of the economy. It is a specific EIA operational-data field tied to useful thermal output.
The exact series identity is fueltypeid=ALL, sectorid=98, field=consumption-uto-btu, annual frequency, and 2025. The ALL fuel facet combines the eligible fuels within this slice instead of isolating petroleum, natural gas, renewables, or another fuel category. Sector 98 is the EIA Electric Power sector. Those details matter because other EIA series can use nearly identical wording while changing the sector, the fuel facet, or the consumption field. A state value from an Electric Utility-only or Independent Power Producer-only slice should therefore not be substituted for the numbers shown here.
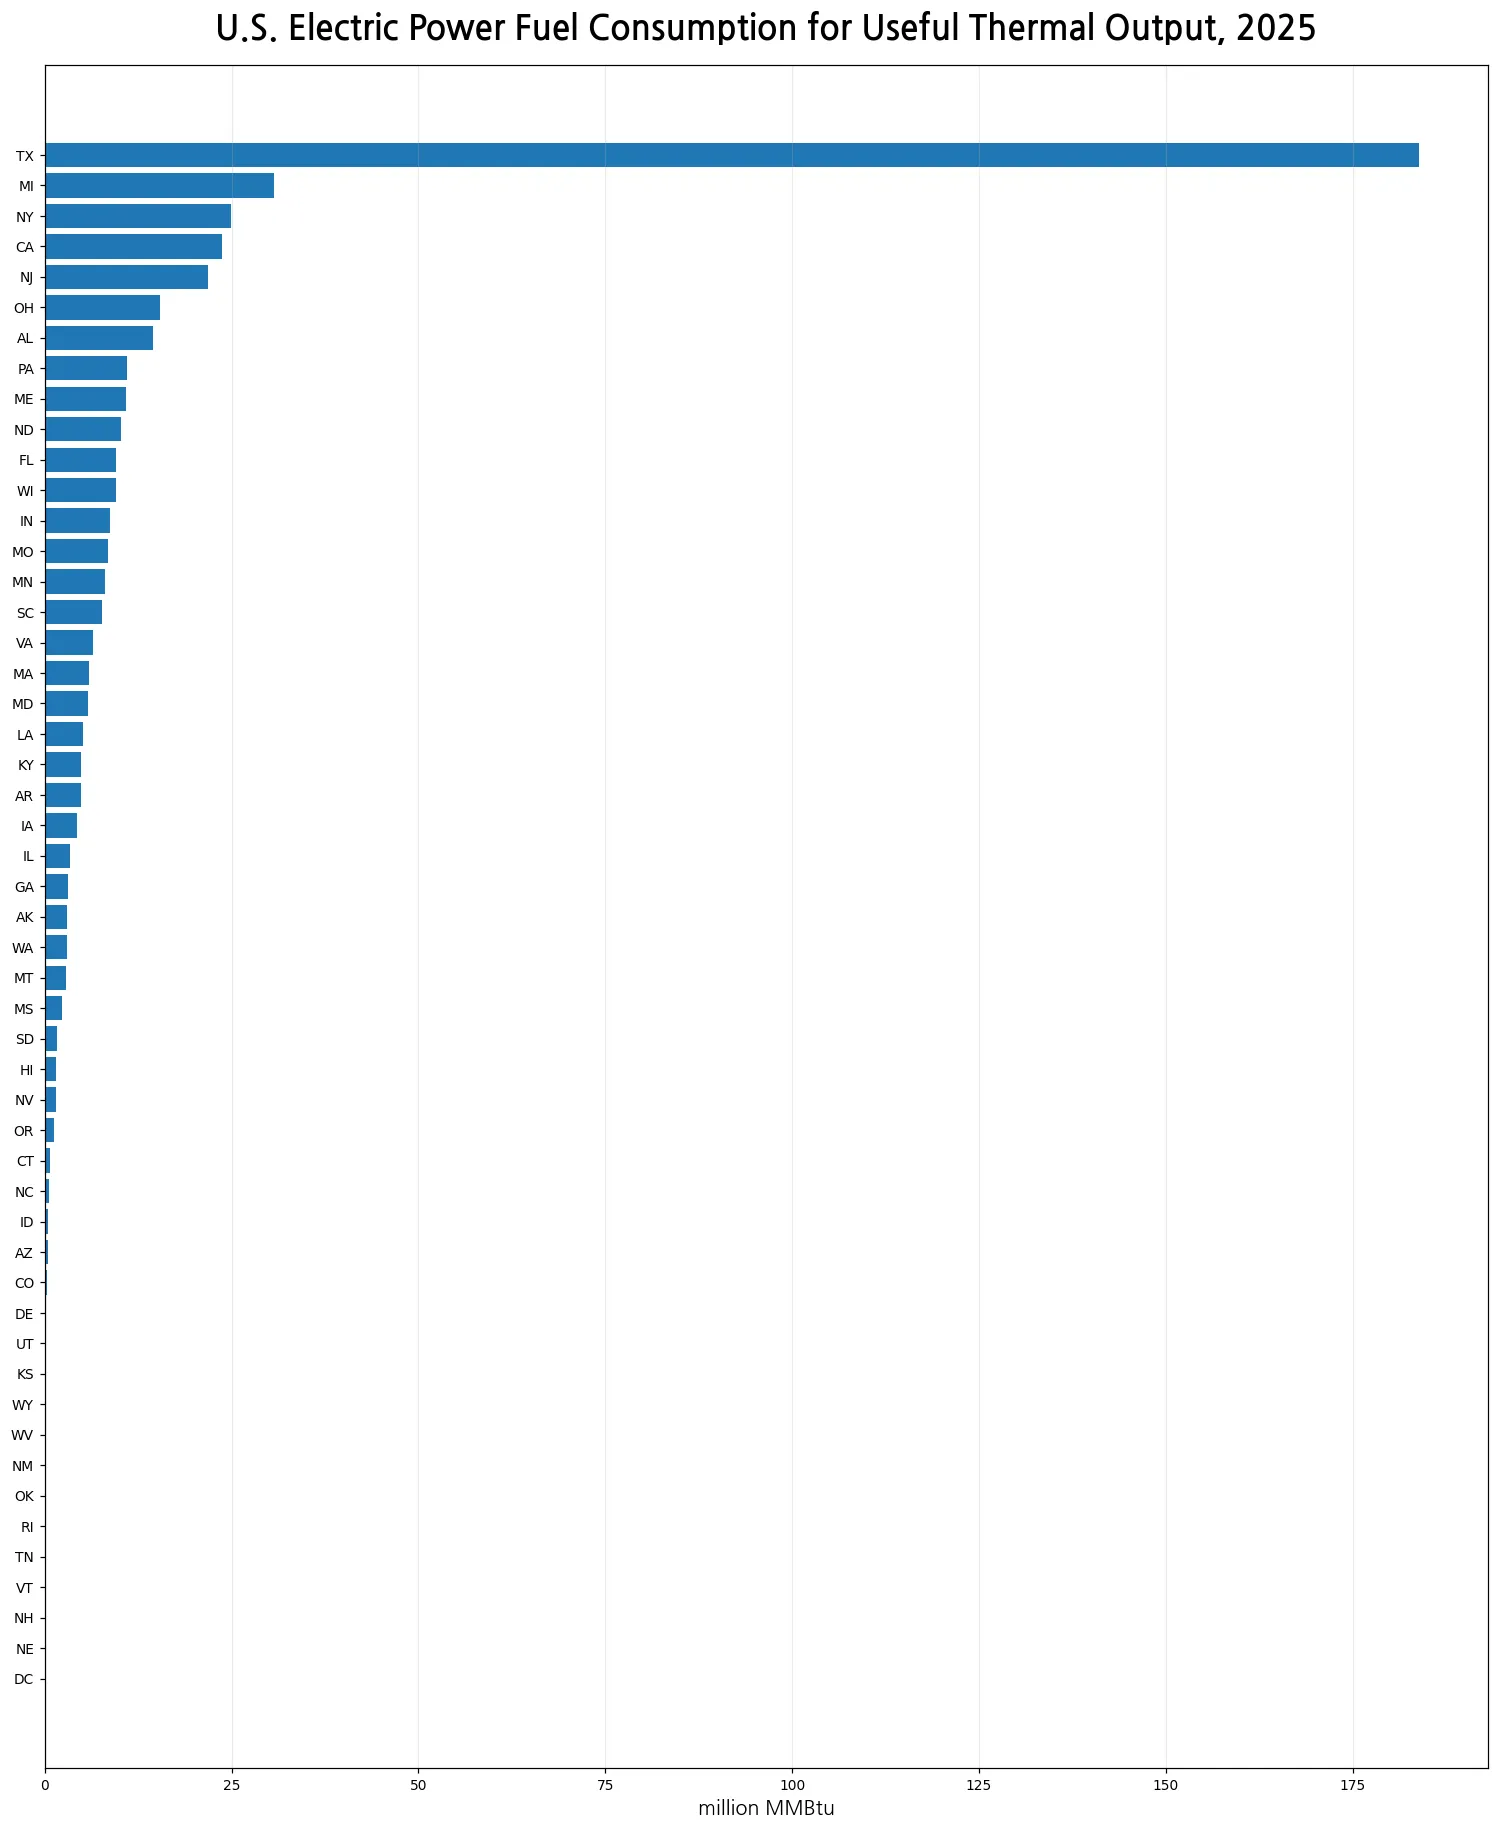
Table of Contents
Texas alone represents nearly 40% of the state-level sum
Texas accounts for 39.75% of the sum of all 51 state-level observations. Its value is about 5.99 times Michigan’s, creating a much larger gap between first and second place than between most neighboring ranks. The first five states together make up 61.64% of the total, while the first ten account for 75.03%. This concentration is the clearest pattern in the distribution. It does not by itself identify a cause. Plant configuration, combined heat and power activity, industrial demand served within the electric-power sector, fuel mix, operating hours, and other factors could all be relevant, but the annual state totals alone cannot separate them.
Michigan, New York, California, and New Jersey form the next tier
After Texas, Michigan contributes about 6.64% of the 51-observation sum. New York contributes roughly 5.40%, California 5.12%, and New Jersey 4.72%. Ohio and Alabama are in the next range, followed by Pennsylvania, Maine, and North Dakota. The distribution is strongly right-skewed: the average state-level value is about 9.06983 million MMBtu, but the median is only 3.01108 million MMBtu. That gap between the mean and the median is useful because it shows how a small group of high observations pulls the average upward. A reader who looked only at the mean would get a poor sense of what a middle-ranked jurisdiction actually looks like.
| State | million MMBtu | Share of 51-observation sum |
|---|---|---|
| Texas | 183.88975 | 39.75% |
| Michigan | 30.71528 | 6.64% |
| New York | 24.97484 | 5.40% |
| California | 23.69034 | 5.12% |
| New Jersey | 21.84180 | 4.72% |
| Ohio | 15.40017 | 3.33% |
| Alabama | 14.50385 | 3.14% |
| Pennsylvania | 10.99304 | 2.38% |
| Maine | 10.88539 | 2.35% |
| North Dakota | 10.18024 | 2.20% |
Ten published observations are exactly zero
The data contain 41 positive observations and 10 observations reported as exactly 0.0. The zero-value jurisdictions are the District of Columbia, Nebraska, New Hampshire, New Mexico, Oklahoma, Rhode Island, Tennessee, Vermont, West Virginia, and Wyoming. These are not missing records that were filled with zeros. They are rows present in the source data with a published value of 0.0. That distinction is important in energy statistics: a missing value can reflect nonreporting, suppression, or an unavailable observation, while a published zero is an actual value in the series. The charts therefore keep these observations at zero rather than labeling them as no data.
Useful thermal output fuel consumption is not the same as electricity generation
The field name consumption-uto-btu refers to fuel consumption associated with useful thermal output. The unit is million MMBtu, which is an energy-input measure. Net generation, by contrast, is normally reported in megawatthours. Because the fields and units differ, a state with a high value here should not automatically be expected to rank the same way in net generation. This series also differs from measures that combine fuel consumption for electricity production with fuel consumption for useful thermal output. The distinction is especially relevant around combined heat and power operations, where one energy system can produce both electricity and useful heat. The EIA field selection determines which part of that activity is being measured.
The sector 98 boundary should be preserved in comparisons
Sector 98 is the Electric Power sector in this EIA data route. It is broader than some owner- or operator-specific slices and should be treated as its own series identity. When comparing the 2025 values with another article or another API result, the safe approach is to match the fuel facet, sector facet, field, unit, frequency, and year. Changing only one of those parameters can create a legitimate but different dataset. This is why two articles can both discuss fuel used for useful thermal output yet produce different rankings: one may focus on all fuels versus a single fuel, or the whole Electric Power sector versus a narrower subsector.
What the 2025 state pattern can and cannot show
The state observations support several direct conclusions. Texas has the largest value, the distribution is highly concentrated, ten jurisdictions report zero, and the top ten states account for three-quarters of the state-level sum. They do not show the amount of useful heat actually delivered, the thermal efficiency of each plant, the cost of fuel, or the share attributable to each fuel type. The values also do not measure household or commercial heating demand across the whole state economy. Those questions require different fields or additional datasets. Keeping those limits explicit prevents the ranking from being turned into claims about efficiency, energy prices, or total state heat consumption that the source does not establish.
A closer look at the middle and lower parts of the distribution
The median observation is 3.01108 million MMBtu, which means half of the 51 jurisdictions are at or below that level and half are at or above it. Several positive values are well below one million MMBtu, while the upper tail rises quickly into double digits before Texas separates from the rest. This makes a full-state chart useful alongside the top-ten chart. The top-ten view makes the leading states readable, while the full chart shows how many jurisdictions cluster near the lower end and how the ten exact zeros fit into the overall pattern. Using both views avoids the common problem of presenting only the leaders and losing the shape of the complete distribution.
Source and calculation method
The source is the U.S. Energy Information Administration electricity/electric-power-operational-data annual series. The query is fixed to 2025, fueltypeid=ALL, sectorid=98, and consumption-uto-btu. No rows were imputed or aggregated from another year. The sum (462.56136), mean (9.06983), median (3.01108), and state shares were calculated directly from the 51 published observations. A state’s percentage is its value divided by the sum of those same 51 observations. The results should therefore be described as shares of this state-level series sum, not as a universal measure of every form of U.S. thermal-energy use. If EIA revises the underlying annual observations later, the same fixed query can be rerun to update the comparison.
Frequently Asked Questions
Which state had the most fuel consumption for useful thermal output in 2025?
Texas ranked first at 183.88975 million MMBtu, about 39.75% of the sum of the 51 state-level observations.
Is this the same as state net electricity generation?
No. The consumption-uto-btu field measures fuel consumption associated with useful thermal output, while net generation is a separate field reported in a different unit.
Do the ten zero values mean the data are missing?
No. Those jurisdictions are present in the EIA data with published values of 0.0; no missing values were converted to zero.
What does sectorid=98 mean?
It identifies the Electric Power sector in this EIA operational-data series and should be kept separate from narrower sector-specific slices.
Related Articles
Green Map creates custom-edited map images using open geographic data sources such as geoBoundaries, Natural Earth, OpenStreetMap, and government open data. These maps are edited visual materials, not raw data files, and are provided for education, documents, presentations, and graphic reference.