World Bank indicator TM.TAX.MRCH.SM.FN.ZS provides a latest non-empty simple-mean most-favored-nation tariff rate for all products in 189 countries and territories. Observation years range from 2002 to 2022, with 143 observations from 2022. The unweighted country mean is 9.07% and the median 7.96%. The Bahamas has the highest latest observation at 31.54%, while Macao SAR and Hong Kong SAR are both 0.00%.
Two words are central to the interpretation: most-favored-nation and simple mean. MFN rates are the non-preferential tariff schedule generally applied on a nondiscriminatory basis when no preferential agreement applies. A simple mean gives every tariff line equal weight, regardless of how much of that product is actually imported.
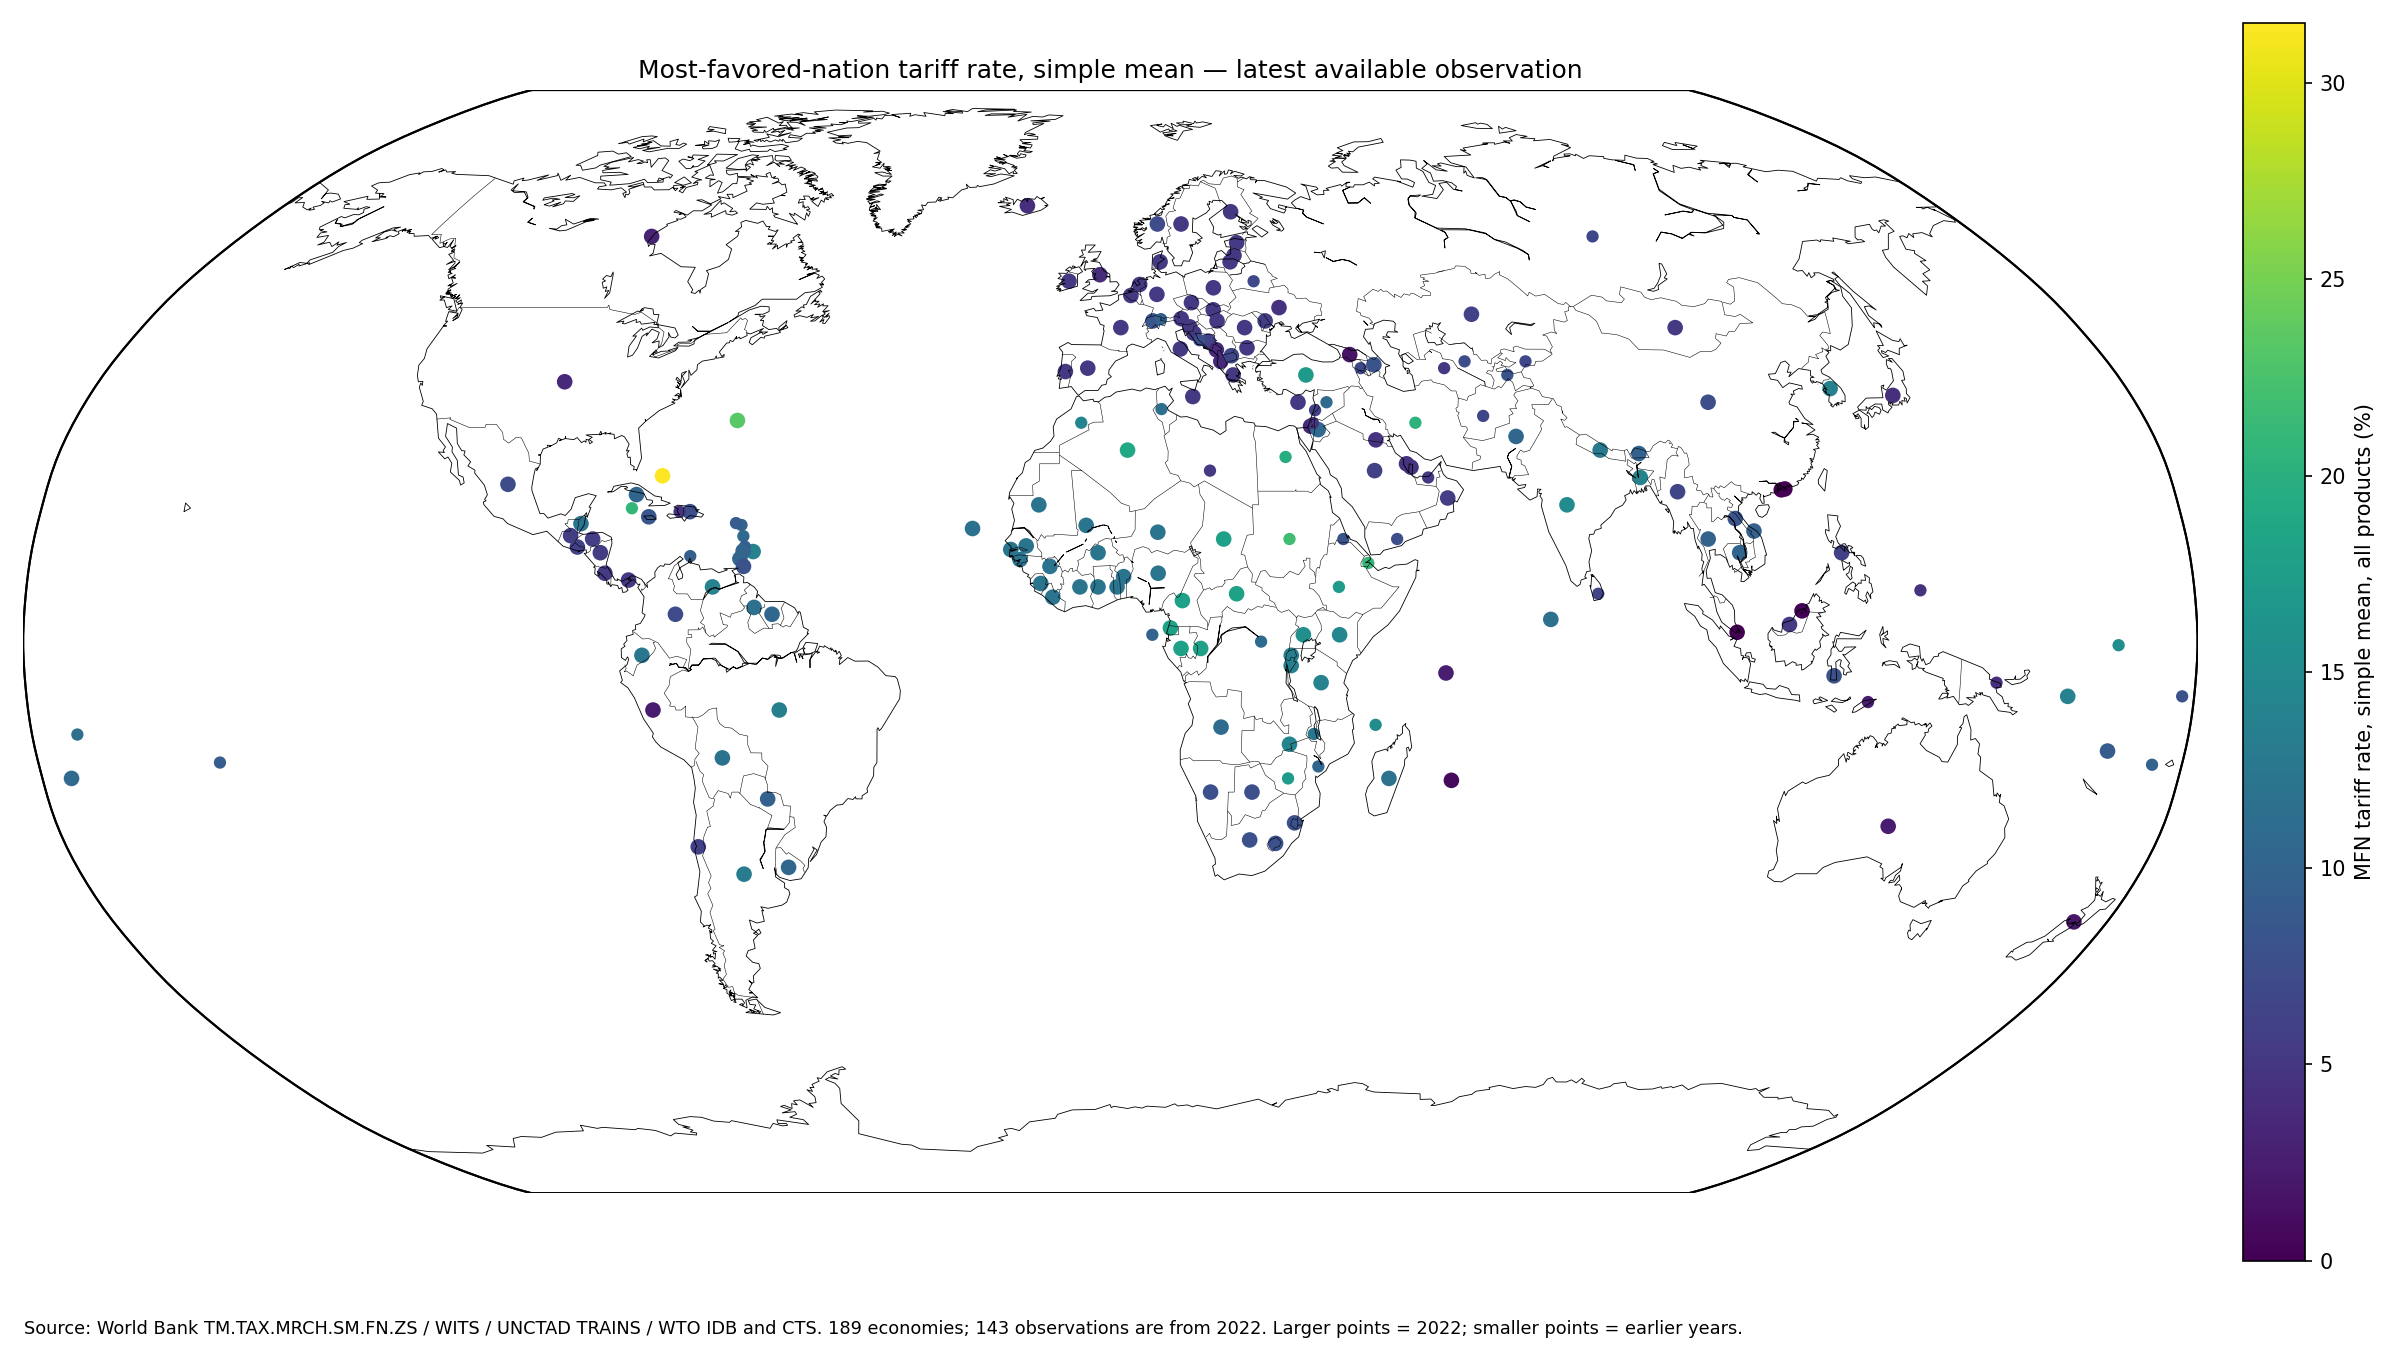
Table of Contents
What a simple-mean MFN tariff rate measures
World Bank metadata defines the indicator as the unweighted average of MFN rates for tariffed products across traded goods. Tariff-line information is classified at the six- or eight-digit Harmonized System level. Each tariff line enters the simple mean with the same weight rather than being weighted by its import value.
The World Bank metadata glossary identifies WITS, UNCTAD TRAINS, and WTO IDB and Consolidated Tariff Schedules as source systems. The World Bank API provides the latest country observations.
MFN rates are not the same as effectively applied tariffs
An MFN schedule describes a baseline non-preferential rate. Actual imports may qualify for lower tariffs under free-trade agreements, preference programs, origin rules, or other arrangements. For that reason, an MFN simple mean should not be described as the average tariff actually paid on imported goods.
Applied-tariff indicators are better suited to questions about the rates faced after preferential treatment is considered. A trade-weighted applied tariff goes one step further by giving greater weight to products with larger import values.
Simple mean and import-weighted mean answer different questions
A product that is barely imported counts just as much as a major import category in a simple mean. If many low-volume products carry high rates, the simple mean can be relatively high even when most imports enter under lower rates.
An import-weighted mean instead reflects the composition of trade. Neither measure is universally better; the simple mean describes the tariff schedule, while the weighted mean better describes tariff exposure under the observed import basket.
The highest latest observations exceed 20%
The Bahamas records 31.54%, Bermuda 23.35%, Sudan 21.82%, the Cayman Islands 20.89%, Djibouti 20.86%, and Iran 20.31%. Egypt at 19.70% and Algeria at 18.92% are also near the upper end.
The years differ: the Bahamas and Bermuda are 2022 observations, Sudan and the Cayman Islands are 2021, Djibouti is 2014, Iran is 2020, and Egypt is 2019. The full latest-value table should therefore not be called a 2022 world ranking.
| Rank | Country or territory | Observation year | Simple-mean MFN tariff |
|---|---|---|---|
| 1 | Bahamas, The | 2022 | 31.54% |
| 2 | Bermuda | 2022 | 23.35% |
| 3 | Sudan | 2021 | 21.82% |
| 4 | Cayman Islands | 2021 | 20.89% |
| 5 | Djibouti | 2014 | 20.86% |
| 6 | Iran, Islamic Rep. | 2020 | 20.31% |
| 7 | Egypt, Arab Rep. | 2019 | 19.70% |
| 8 | Algeria | 2022 | 18.92% |
| 9 | Cameroon | 2022 | 18.03% |
| 10 | Gabon | 2022 | 18.03% |
| 11 | Equatorial Guinea | 2022 | 18.03% |
| 12 | Central African Republic | 2022 | 18.03% |
| 13 | Congo, Rep. | 2022 | 18.03% |
| 14 | Chad | 2022 | 18.03% |
| 15 | Ethiopia | 2021 | 17.20% |
The 2022 same-year subset covers 143 economies
Restricting the data to 2022 leaves 143 economies. The Bahamas leads at 31.54%, Bermuda at 23.35%, and Algeria at 18.92%. Cameroon, Congo, the Central African Republic, Gabon, Chad, and Equatorial Guinea all record 18.03%.
| 2022 rank | Country or territory | Simple-mean MFN tariff |
|---|---|---|
| 1 | Bahamas, The | 31.54% |
| 2 | Bermuda | 23.35% |
| 3 | Algeria | 18.92% |
| 4 | Cameroon | 18.03% |
| 5 | Congo, Rep. | 18.03% |
| 6 | Central African Republic | 18.03% |
| 7 | Gabon | 18.03% |
| 8 | Chad | 18.03% |
| 9 | Equatorial Guinea | 18.03% |
| 10 | Turkiye | 16.97% |
| 11 | Uganda | 15.72% |
| 12 | India | 15.02% |
| 13 | Kenya | 14.45% |
| 14 | Zambia | 14.35% |
| 15 | Bangladesh | 14.06% |
The 2022 subset has an unweighted mean of 8.72% and a median of 7.64%. Its first quartile is 5.24% and third quartile 12.12%. 22 economies are below 5%, 64 are from 5% to under 10%, 45 from 10% to under 15%, 10 from 15% to under 20%, and 2 are at least 20%.
A visible Central African cluster shares the same 18.03% value
Cameroon, Congo, the Central African Republic, Gabon, Chad, and Equatorial Guinea form a geographically coherent group with exactly the same 18.03% value in 2022. That repeated value is one of the clearest spatial patterns in the map.
The dataset itself does not establish the institutional reason for the shared value. It is therefore appropriate to describe the cluster as an observed pattern and use additional official trade-policy sources before assigning a cause.
The low end includes zero and near-zero MFN averages
Macao SAR and Hong Kong SAR record 0.00% in 2022, Singapore 0.07%, Brunei Darussalam 0.21%, Mauritius 0.81%, Georgia 1.59%, and New Zealand 1.97%.
The zero values are reported observations, not missing data converted to zero. Even so, a zero simple-mean MFN tariff does not imply that every possible trade cost, tax, regulation, or border charge is zero.
| Low-end rank | Country or territory | Observation year | Simple-mean MFN tariff |
|---|---|---|---|
| 1 | Macao SAR, China | 2022 | 0.00% |
| 2 | Hong Kong SAR, China | 2022 | 0.00% |
| 3 | Singapore | 2022 | 0.07% |
| 4 | Brunei Darussalam | 2022 | 0.21% |
| 5 | Mauritius | 2022 | 0.81% |
| 6 | Georgia | 2022 | 1.59% |
| 7 | New Zealand | 2022 | 1.97% |
| 8 | Australia | 2022 | 2.43% |
| 9 | Peru | 2022 | 2.46% |
| 10 | Timor-Leste | 2021 | 2.53% |
| 11 | Seychelles | 2022 | 2.63% |
| 12 | Canada | 2022 | 3.04% |
| 13 | United States | 2022 | 3.53% |
| 14 | Israel | 2022 | 3.55% |
| 15 | Albania | 2022 | 3.63% |
The overall median is 7.96%
The median across 189 latest observations is 7.96%, with a first quartile of 5.24% and third quartile of 12.12%. 28 observations are below 5%, 87 are from 5% to under 10%, 53 from 10% to under 15%, 15 from 15% to under 20%, and 6 are at least 20%.
The mean of 9.07% is about 1.11 percentage points above the median because the upper tail contains several tariff averages near or above 20%. The median and bands provide a useful complement to the country mean.
Most observations are recent, but not all
170 observations are from 2021–2022 and 179 are from 2020 or later. 10 latest observations are from 2019 or earlier, and the oldest latest observation is from 2002.
Tariff schedules can change through legislation and trade agreements. Older latest observations should therefore not be presented as current policy rates. The 2022 subset is the cleanest choice for same-year comparison.
MFN treatment is different from preferential treatment
MFN is a baseline nondiscriminatory tariff concept. In actual trade, bilateral and regional free-trade agreements, preference schemes, and product-specific origin rules can reduce the tariff applied to imports from particular partners.
A country-level MFN average therefore cannot tell an importer what rate applies to a specific product from a specific origin. That requires tariff-line and preference information.
Bound tariffs are another distinct concept
WTO bound tariffs generally represent ceilings committed in tariff schedules, while applied MFN rates can be below those ceilings. Binding coverage also describes how much of the tariff schedule is subject to commitments.
MFN simple mean, applied simple mean, weighted mean, bound rate, and binding coverage each answer a different trade-policy question. None should be treated as a complete one-number measure of openness.
A high tariff average does not equal a high actual tax burden
Because this is an unweighted schedule average, it does not account for which goods dominate imports, which products enter under preferences, or how much revenue is actually collected. A country can have high statutory rates on rarely imported goods and still collect a lower effective tariff burden.
Assessing actual burden requires import values, applied rates, preference utilization, exemptions, and tariff revenue data.
The map cannot establish the economic effect of tariffs
Tariffs can interact with industrial policy, government revenue, consumer prices, supply chains, and trade negotiations. This five-column dataset contains no direct outcome variables for growth, employment, productivity, or consumer prices.
A high or low tariff average should therefore not be interpreted as proof of a particular economic outcome. Causal analysis requires additional data and a research design that separates tariff changes from other factors.
The country mean is not a world trade-weighted tariff
The 9.07% simple mean across countries gives each of the 189 economies equal weight. A major importer and a small importer each count once. It is not the average tariff faced by a dollar of world imports.
A world trade-weighted measure would require import values and product-level weights. The mean and median here summarize country-level simple MFN tariff averages only.
Source and calculation notes
The source is World Bank World Development Indicators series TM.TAX.MRCH.SM.FN.ZS, based on WITS, UNCTAD TRAINS, and WTO tariff databases. The analysis uses the latest non-empty observation for 189 economies and separately reviews the 143 observations from 2022. The official World Bank API provides the series.
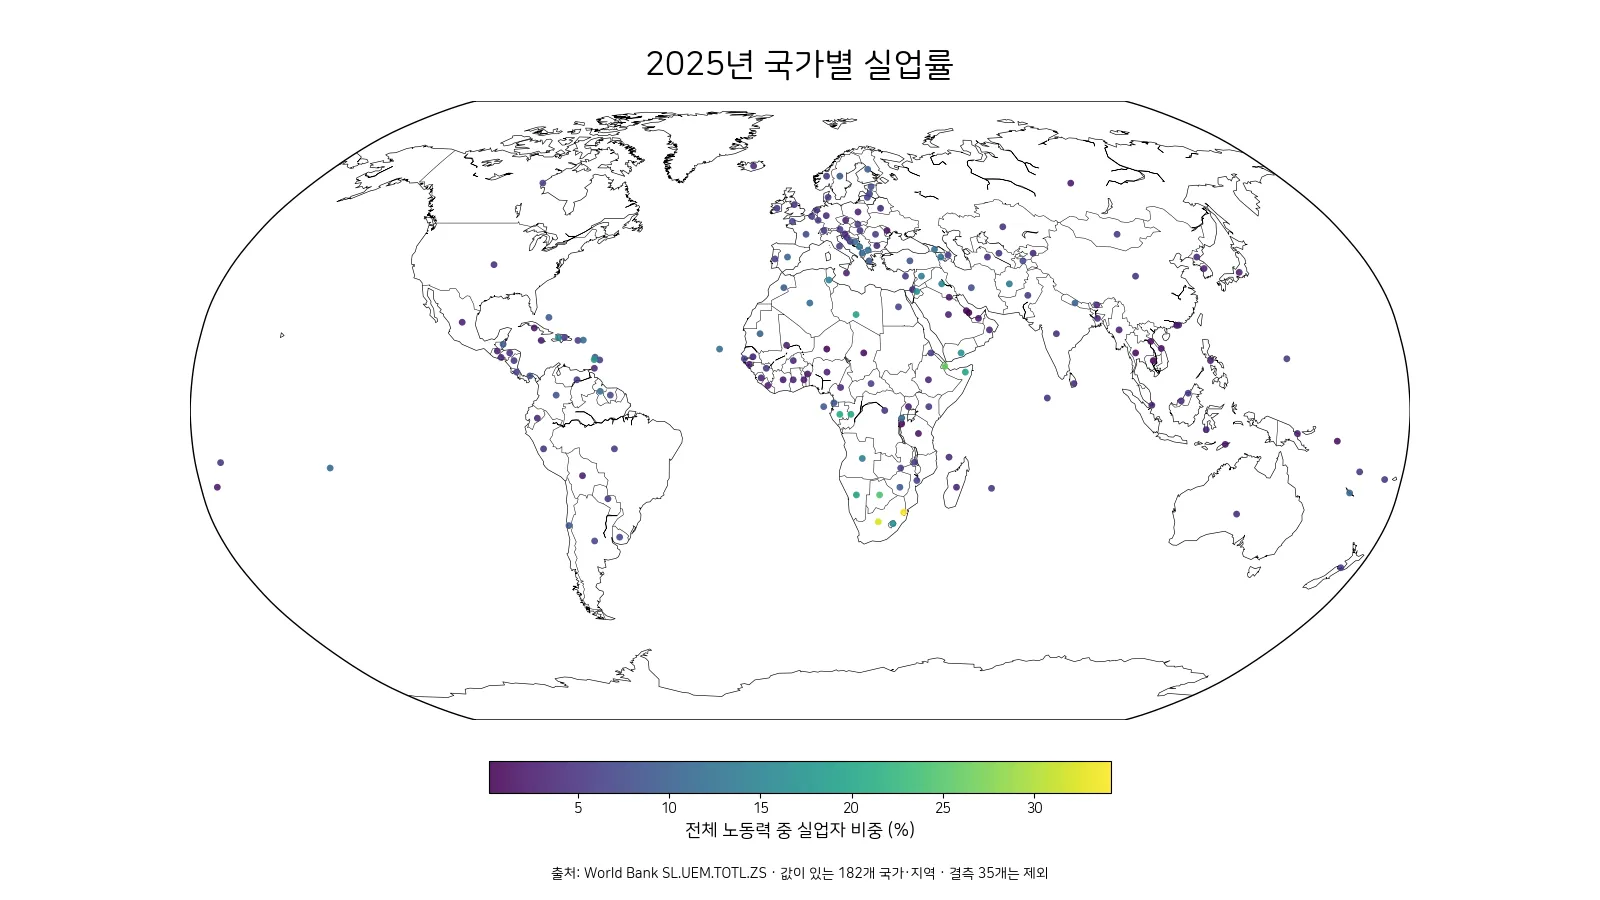
All 189 reported country codes are joined to geographic centroids for the map, producing a 100% match. Larger points mark 2022 observations and smaller points earlier years. Missing economies are not converted to zero.
Frequently Asked Questions
Is the simple-mean MFN tariff the average tariff actually paid on imports?
No. It gives each tariff line equal weight and does not fully reflect preferential rates or the actual composition of imports.
How does a simple mean differ from an import-weighted tariff?
A simple mean weights every tariff line equally, while an import-weighted mean gives more weight to products with larger import values.
Are all 189 observations from 2022?
No. 143 are from 2022 and the full latest-observation range is 2002–2022.
Related Articles
Green Map creates custom-edited map images using open geographic data sources such as geoBoundaries, Natural Earth, OpenStreetMap, and government open data. These maps are edited visual materials, not raw data files, and are provided for education, documents, presentations, and graphic reference.