Distillate fuel oil used for useful thermal output in the Electric Power sector was highly concentrated across the 50 U.S. states in 2024. The state observations published by the U.S. Energy Information Administration (EIA) sum to 384.143 thousand short tons. Maryland alone accounts for 319.315 thousand short tons, or 83.1% of that 50-state total. Alaska follows at 19.577 thousand short tons and Missouri at 18.097 thousand short tons. The central story is therefore not a broad, even pattern of fuel use, but an unusually concentrated distribution dominated by a small number of states.
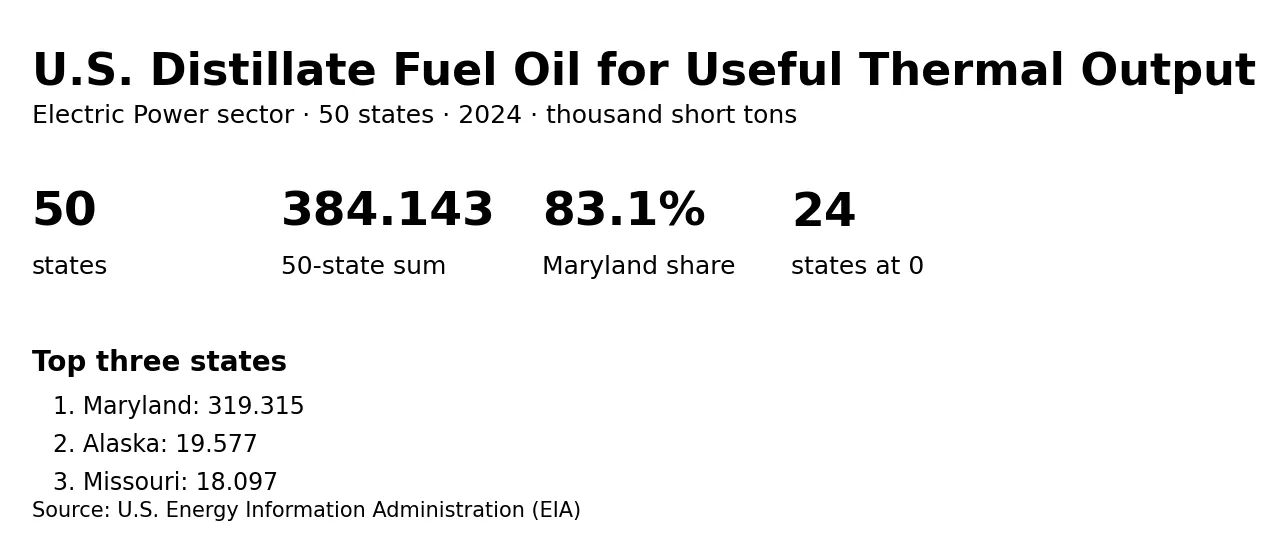
The metric is narrower than total distillate fuel oil used by power plants. EIA separates fuel consumed for electricity generation, fuel consumed for useful thermal output, and combined measures that cover both purposes. This article uses only the useful-thermal-output field for distillate fuel oil in the Electric Power sector. That distinction matters because similarly named EIA series can describe different physical uses even when the fuel, year, and geography are the same.
Table of Contents
What the EIA measure represents
The underlying EIA operational-data slice uses annual frequency, fueltypeid DFO, sectorid 98, and the field consumption-uto. DFO is distillate fuel oil, sector 98 is Electric Power, and consumption-uto is fuel consumption assigned to useful thermal output. For petroleum liquids such as distillate fuel oil, the physical unit is thousand short tons. A value of 319.315 therefore means 319.315 thousand short tons, or about 319,315 short tons.
Useful thermal output refers to usable heat produced in addition to, or in association with, power-sector operations. Combined-heat-and-power facilities are a common context in which fuel input can be allocated to both electricity and useful heat. The series does not by itself identify which facility, process, or operational decision caused a state total. It tells us how much distillate fuel oil was reported for this defined purpose at the state level.
All 50 observations refer to 2024, which makes the data suitable for a same-year cross-sectional comparison. It does not, however, show whether a state increased or decreased consumption from the previous year. A trend statement would require the same EIA series for 2023 and earlier years. The analysis here stays with the 2024 distribution and does not infer a time trend from a single annual snapshot.
Maryland dominates the 2024 distribution
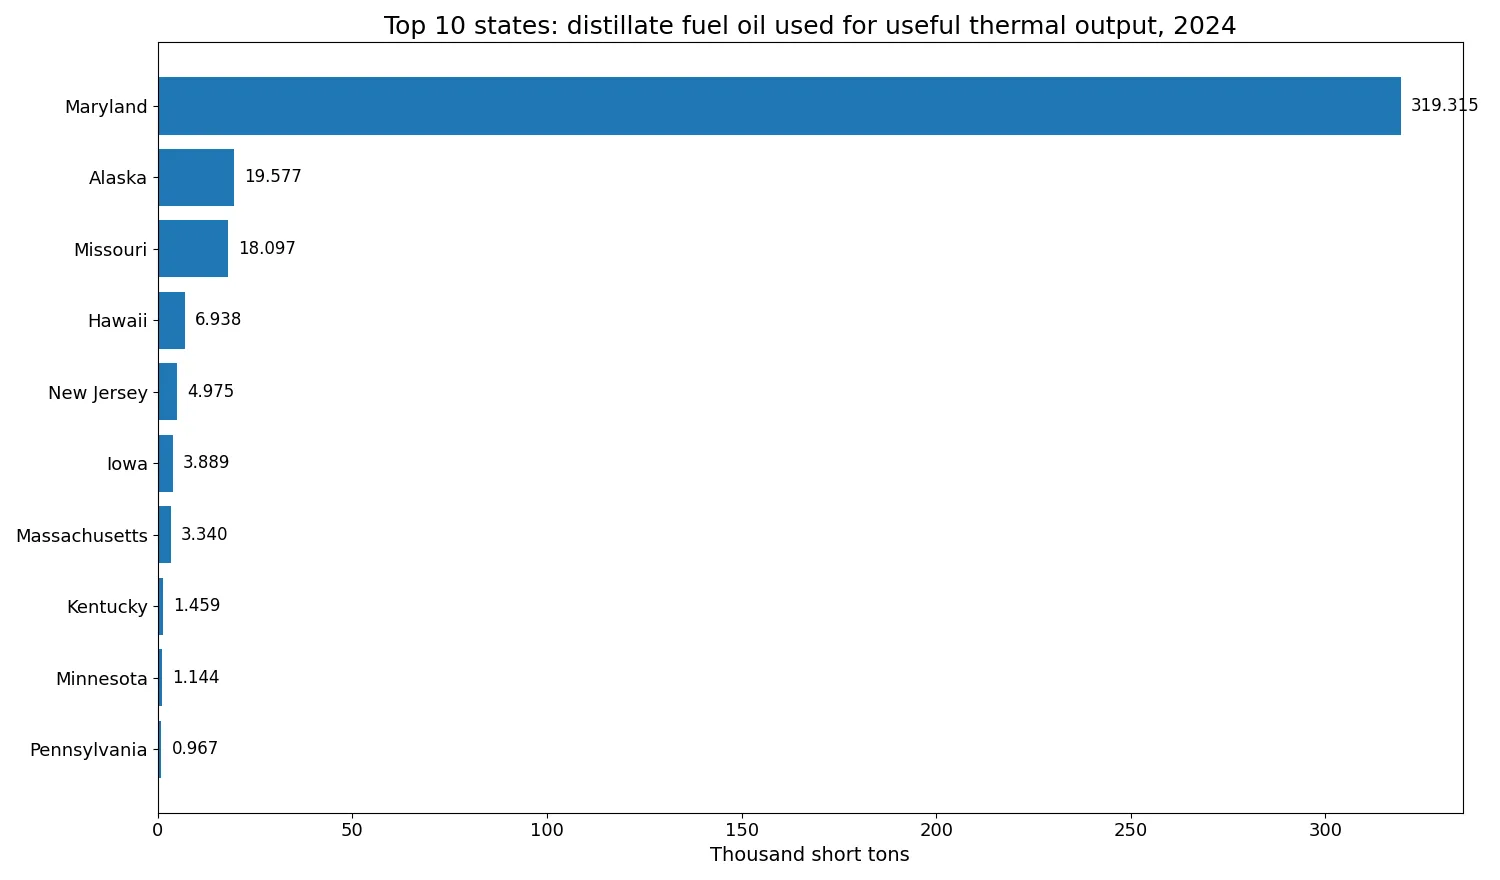
Maryland is the clear outlier. Its 319.315 thousand short tons represent 83.1% of the 384.143-thousand-short ton sum across the 50 states. That value is more than sixteen times Alaska’s 19.577 thousand short tons and more than seventeen times Missouri’s 18.097 thousand short tons. When one observation is this large relative to the rest, the arithmetic mean stops being a good description of a typical state.
The mean across all 50 states is 7.683 thousand short tons, while the median is only 0.001 thousand short tons. Those two statistics describe very different parts of the distribution. The mean is pulled sharply upward by Maryland and several other high observations. The median says that the middle of the state distribution is essentially near zero. A sentence that reports only “an average of 7.7 thousand short tons per state” would therefore hide the most important feature of the data.
Alaska contributes 5.1% of the 50-state total and Missouri 4.7%. Together with Maryland, the top three states account for 92.9%. Hawaii is next with 6.938 thousand short tons, followed by New Jersey with 4.975 and Iowa with 3.889. The top five states already reach 96.0% of the total. This means most of the national-state distribution is compressed into a small residual once the leading observations are removed.
How concentrated is the 50-state total?
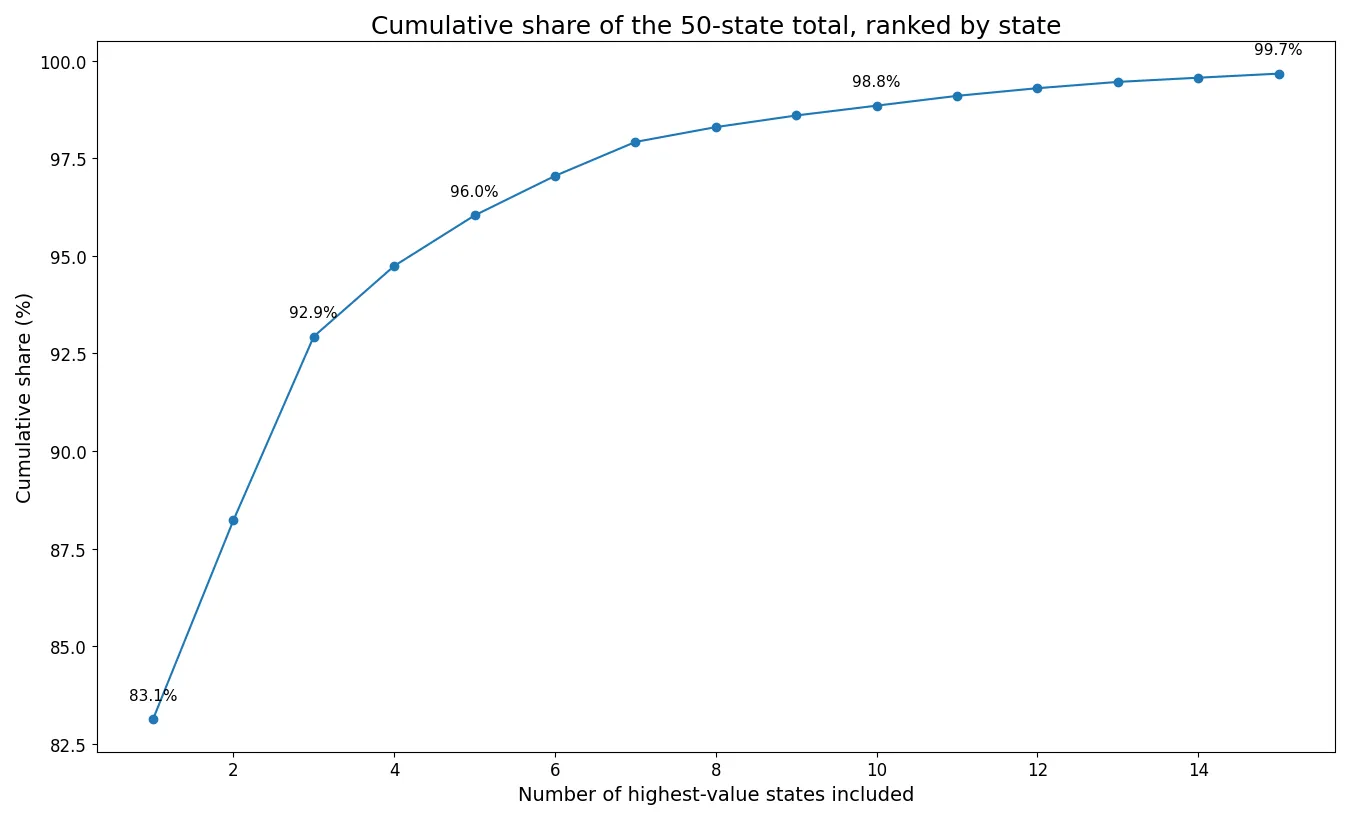
The concentration curve makes the skew easy to quantify. The highest state alone contributes 83.1%; the top three contribute 92.9%; the top five contribute 96.0%; and the top ten contribute 98.8%. All 40 states outside the top ten therefore combine for only about 1.2% of the 50-state sum. A ranked bar chart or cumulative-share chart is more informative for this series than a simple national average because it preserves that imbalance.
This concentration should not be interpreted as a statement that Maryland’s overall energy system depends on distillate fuel oil to the same degree. The denominator here is the sum of one narrowly defined EIA series: distillate fuel oil used for useful thermal output in the Electric Power sector. It is not total state energy consumption, total electricity generation, total CHP output, or total petroleum use. Maryland’s 83.1% figure is a share of this specific 50-state measure only.
State totals can also reflect differences in the number and size of facilities, operating hours, fuel-switching practices, and the mix of technologies that produce useful heat. The dataset is an absolute physical quantity and is not normalized by population, generation, installed capacity, or useful-heat output. A large value can therefore reflect scale, a concentrated facility base, or other operational factors. The state totals alone cannot separate those explanations.
Twenty-four states report zero and 26 report a positive value
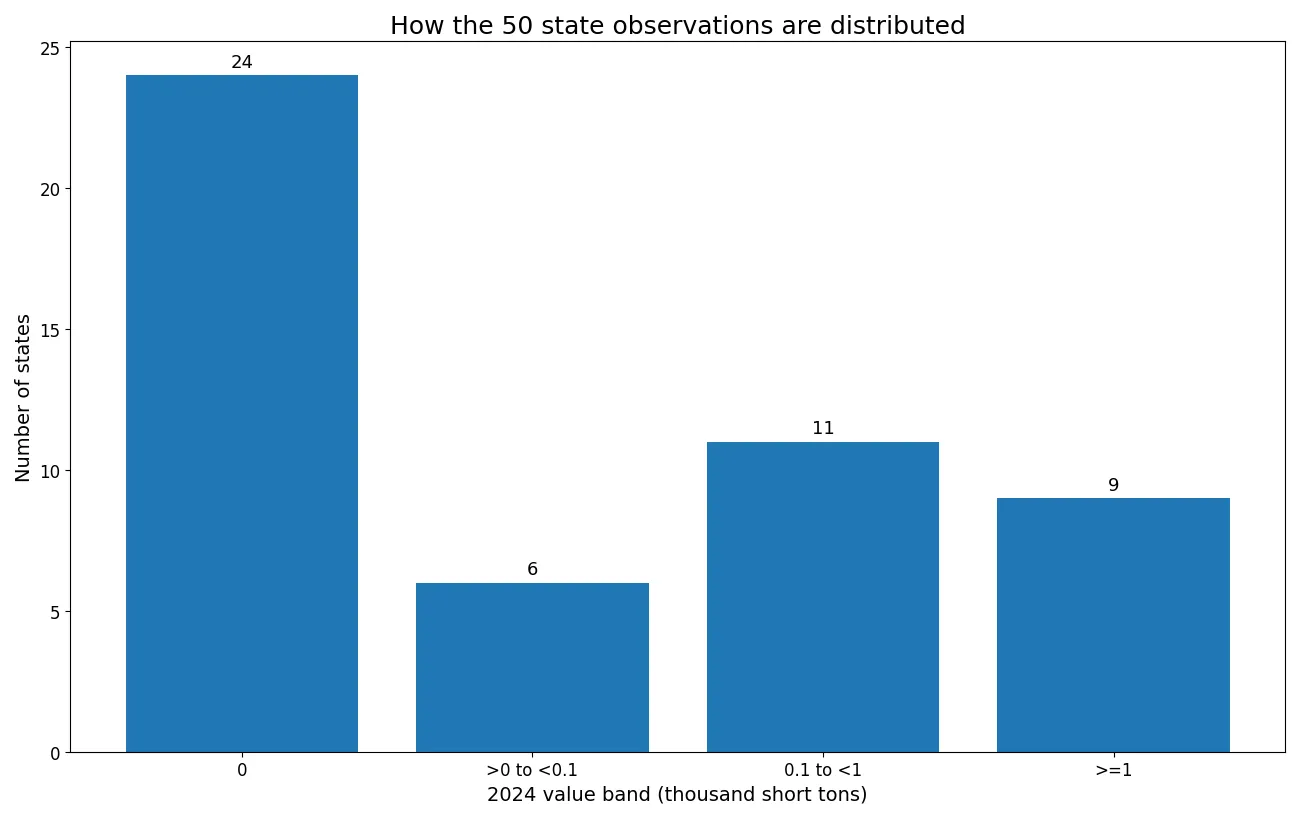
Of the 50 states, 24 have an official value of zero and 26 have a positive value. Zero is not the same as missing. Every state row in this 2024 comparison contains a reported numeric value, so the zeros should be preserved as observations rather than converted to “no data.” The reverse is equally important in other datasets: missing observations should not be filled with zero simply to make a complete-looking map or table.
Many of the positive values are also small. Six states are above zero but below 0.1 thousand short tons, 11 are at least 0.1 but below 1 thousand short ton, and only nine reach 1 thousand short tons or more. The median among positive observations is 0.516 thousand short tons. Even after the zero states are removed, the distribution remains strongly right-skewed.
Texas and Indiana each report 0.001 thousand short tons. Arizona is at 0.026, Georgia at 0.031, Wisconsin at 0.075, and Connecticut at 0.085. Pennsylvania and Montana sit just below the 1-thousand-short ton threshold at 0.967 and 0.965, respectively. These small values are easy to lose visually when Maryland is plotted on the same linear scale, but they are distinct reported observations and should not be rounded into a single zero category.
Top 10 states in 2024
| Rank | State | Consumption (thousand short tons) | Share of 50-state total |
|---|---|---|---|
| 1 | Maryland | 319.315 | 83.1% |
| 2 | Alaska | 19.577 | 5.1% |
| 3 | Missouri | 18.097 | 4.7% |
| 4 | Hawaii | 6.938 | 1.8% |
| 5 | New Jersey | 4.975 | 1.3% |
| 6 | Iowa | 3.889 | 1.0% |
| 7 | Massachusetts | 3.340 | 0.9% |
| 8 | Kentucky | 1.459 | 0.4% |
| 9 | Minnesota | 1.144 | 0.3% |
| 10 | Pennsylvania | 0.967 | 0.3% |
The ten states in the table sum to 379.701 thousand short tons, or 98.8% of the 50-state total. Outside the top ten, Montana is 0.965 thousand short tons and South Carolina is 0.753. The enormous gap between Maryland and the rest means a conventional bar chart compresses most smaller values near the axis. That is a visualization issue rather than evidence that the smaller states are identical.
What can be concluded directly from the data
The data support several direct statements. Maryland has the highest 2024 value; Alaska and Missouri rank second and third; 24 states have a reported zero; and the top three states account for 92.9% of the 50-state sum. These are descriptive results calculated from the official observations. They do not require assumptions about why a state used more or less fuel.
The data do not, on their own, answer why Maryland is so high. Possible influences in a power-sector fuel-use series could include facility configuration, CHP operations, temporary operating conditions, fuel availability, prices, or plant-level changes, but none of those variables are present in this state slice. A causal explanation would require facility-level EIA records, operational details, or additional fuel and generation series. Treating a plausible explanation as proven would go beyond the evidence.
The values also are not an efficiency ranking or an environmental-performance score. A low absolute consumption value could result from little useful-heat production, a different fuel mix, smaller facilities, or higher efficiency; the state-level fuel quantity alone cannot distinguish those cases. Similarly, a high value does not establish poor performance. For efficiency or emissions comparisons, useful heat output, fuel heat content, facility efficiency, and emissions factors would need to be considered.
Why the physical unit matters
The values in this article retain the unit attached to the server-verified EIA series used for this comparison. For this metric, the unit is thousand short tons, and all state observations, totals, averages, and medians are interpreted on that same basis. Other EIA fuel series can use different physical units, so their units should be checked separately before combining or comparing metrics.
Unit is part of the metric identity. In this series, 319.315 is read as 319.315 thousand short tons. Substituting a unit from another EIA fuel series would change the physical meaning of the observation. Automated workflows should therefore preserve the field, fueltypeid, sectorid, frequency, year, and unit together rather than treating the numeric value as a unit-free quantity.
The source is the U.S. Energy Information Administration’s Electric Power Operational Data. The comparison uses the 2024 annual observations for the 50 states without estimating or imputing state values; only totals, shares, and descriptive distribution statistics are calculated from them. EIA’s public data resources are available through EIA Open Data. For year-to-year comparisons, the same consumption-uto, DFO, and Electric Power filters should be retained.
Bottom line
Across the 50 U.S. states, reported 2024 distillate fuel oil consumption for useful thermal output in the Electric Power sector sums to 384.143 thousand short tons. Maryland accounts for 319.315 thousand short tons, or 83.1%, and the top three states together account for 92.9%. Twenty-four states report zero while 26 report a positive value. The distribution is therefore far too skewed to summarize with the mean alone. The most useful reading combines the median, zero count, top-state shares, and the narrow definition of the metric: this is fuel used for useful thermal output, not all distillate fuel oil consumed for power generation.
Frequently Asked Questions
How much distillate fuel oil did Maryland use for useful thermal output in 2024?
EIA reports 319.315 thousand short tons for Maryland, about 83.1% of the 384.143-thousand-short ton sum across the 50 states.
What unit is used for this distillate fuel oil series?
The server-verified series in this writing package uses thousand short tons as its physical unit.
Do the 24 zero values mean missing data?
No. All 50 state rows contain numeric observations. The 24 zeros are reported values and are distinct from missing observations.
Does this measure all distillate fuel oil burned for electricity generation?
No. It covers distillate fuel oil assigned to useful thermal output in the Electric Power sector, not all fuel used for electricity generation.
Related Articles
Green Map creates custom-edited map images using open geographic data sources such as geoBoundaries, Natural Earth, OpenStreetMap, and government open data. These maps are edited visual materials, not raw data files, and are provided for education, documents, presentations, and graphic reference.