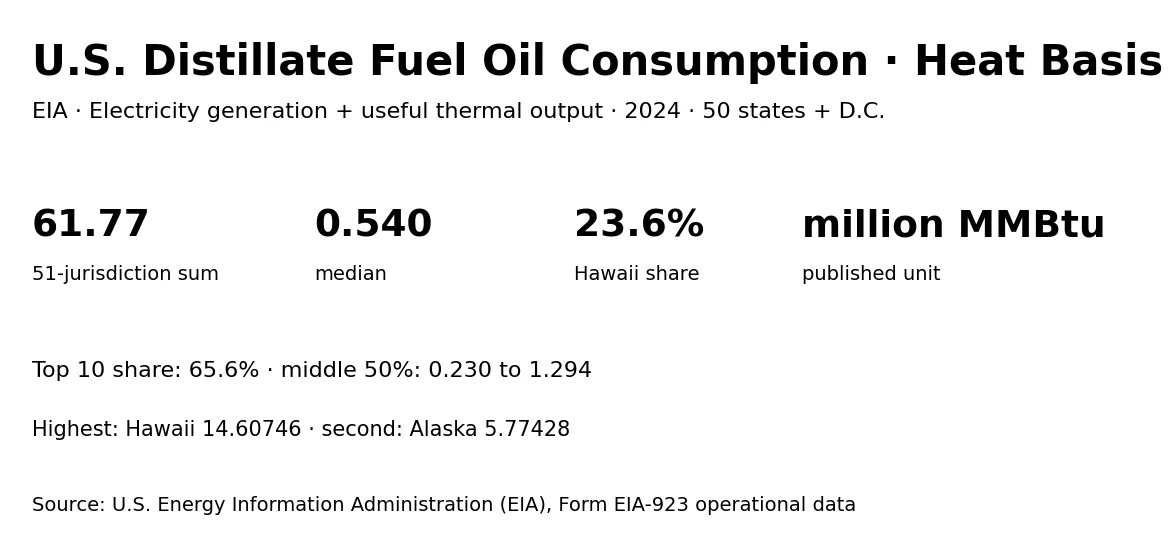
U.S. Energy Information Administration (EIA) data show a highly concentrated 2024 state distribution for distillate fuel oil consumed for electricity generation and useful thermal output on a heat-content basis. The series covers 51 jurisdictions—the 50 states and the District of Columbia—and is published in million MMBtu. The 51-jurisdiction sum is 61.77164 million MMBtu, the median is 0.53969, and the mean is 1.21121.
This series is different from a physical-unit fuel-consumption series. The selected EIA field is total-consumption-btu, so the values represent heat content rather than barrels, gallons, or short tons. The unit must therefore remain million MMBtu. Physical quantity and heat content can be related, but they answer different questions and should not be relabeled as one another.
Table of Contents
Hawaii accounts for 23.6% of the 51-jurisdiction total
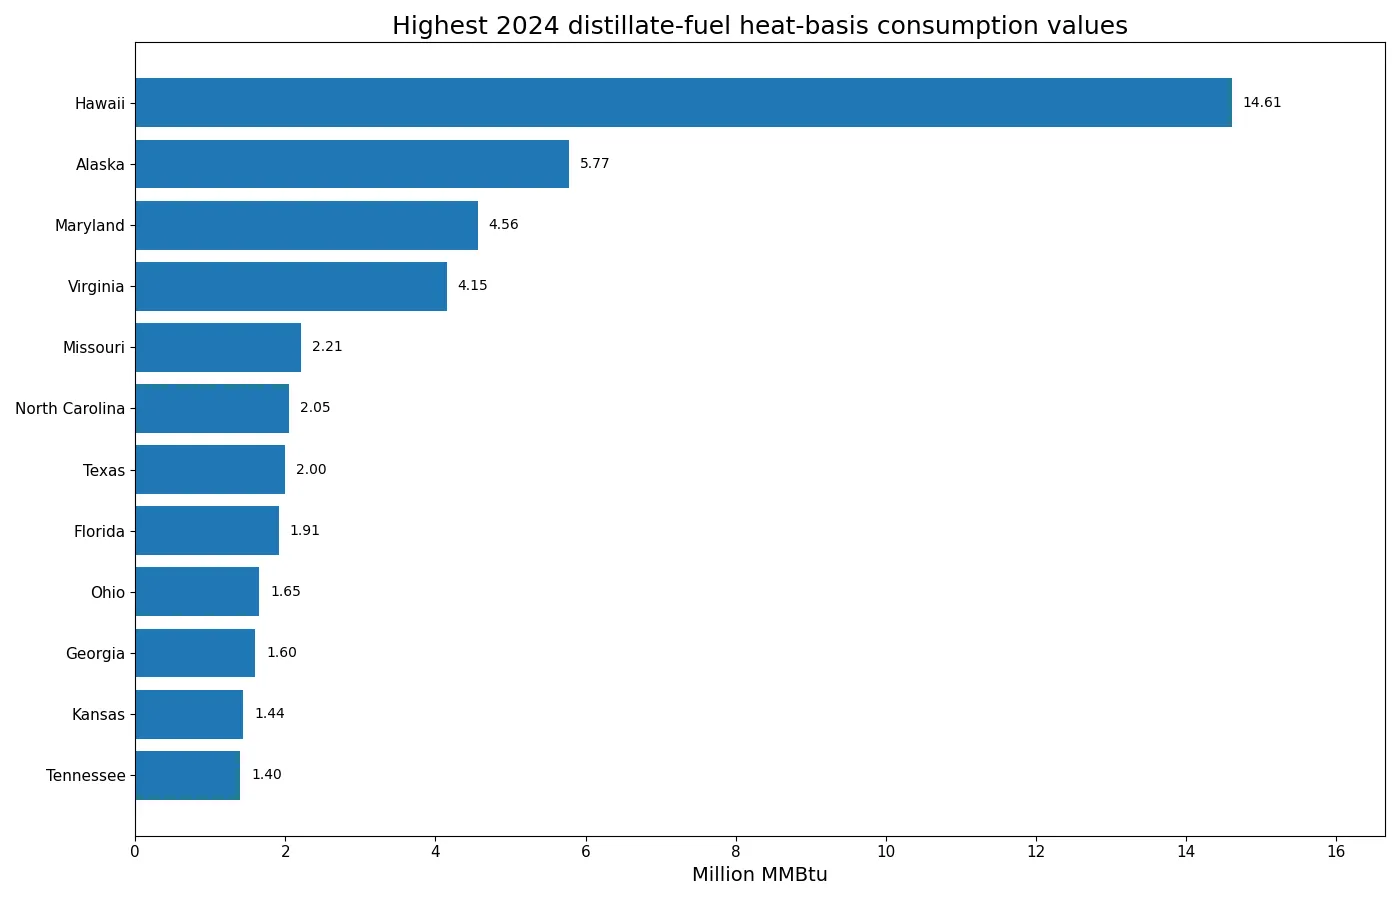
Hawaii has the largest 2024 value at 14.60746 million MMBtu. Alaska follows at 5.77428, Maryland at 4.56088, Virginia at 4.14913, and Missouri at 2.21187. Hawaii alone represents about 23.6% of the total. The top three account for 40.4%, the top five for 50.7%, and the top ten for 65.6%.
| State or jurisdiction | 2024 value (million MMBtu) |
|---|---|
| Hawaii | 14.60746 |
| Alaska | 5.77428 |
| Maryland | 4.56088 |
| Virginia | 4.14913 |
| Missouri | 2.21187 |
| North Carolina | 2.05074 |
| Texas | 1.99963 |
| Florida | 1.91189 |
| Ohio | 1.65240 |
| Georgia | 1.59583 |
The gap between Hawaii and Alaska is 8.83318 million MMBtu. Hawaii is therefore not simply first in a closely packed group: its value is more than twice Alaska’s. Hawaii and Alaska together account for 33.0% of the total, making the upper end unusually concentrated.
These values are not electricity-generation rankings. Fuel heat content is an input-side measure, while net generation records electricity output. Plant efficiency, combined heat and power operations, dispatch patterns, and the purpose for which the fuel is consumed can all produce different state rankings across EIA measures.
The median is 0.53969 million MMBtu
The median is 0.53969. The first quartile is 0.23022 and the third quartile is 1.29390, placing the middle half of the observations between roughly 0.23 and 1.29 million MMBtu. The maximum of 14.60746 is about 27.1 times the median, showing how far the largest observation sits above a typical state value.
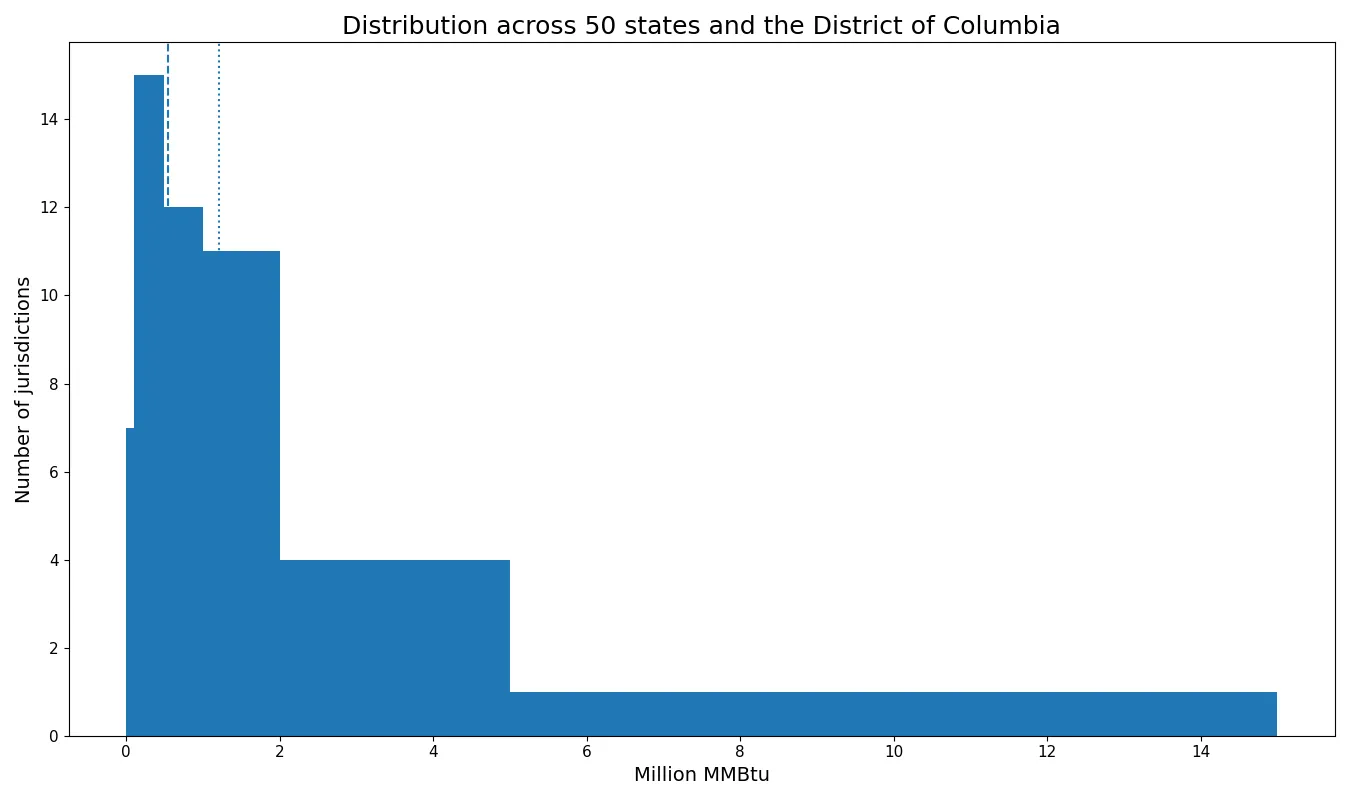
By value band, 7 jurisdictions are below 0.1 million MMBtu, 15 are from 0.1 to under 0.5, 12 from 0.5 to under 1, 11 from 1 to under 2, and 6 are at 2 or above. Most observations are therefore in the lower bands, while a relatively small group contributes a large share of the total.
The mean of 1.21121 is more than twice the median of 0.53969. In a right-skewed distribution, the mean can make the typical jurisdiction look larger than it is. Reporting the median, quartiles, and concentration shares alongside the average provides a more faithful description of the state pattern.
District of Columbia and Idaho are close to zero but still positive
The smallest value is District of Columbia at 0.00047 million MMBtu. Idaho follows at 0.00049, New Mexico at 0.01135, Maine at 0.02278, and Vermont at 0.05221. There are no official zero observations in the 51-row dataset.
| State or jurisdiction | 2024 value (million MMBtu) |
|---|---|
| District of Columbia | 0.00047 |
| Idaho | 0.00049 |
| New Mexico | 0.01135 |
| Maine | 0.02278 |
| Vermont | 0.05221 |
| Rhode Island | 0.05803 |
| Nevada | 0.07323 |
| Louisiana | 0.10803 |
| Oregon | 0.13833 |
| Mississippi | 0.16992 |
A very small positive value should not be rounded into missing data. District of Columbia and Idaho both have published positive observations, even though they are near zero relative to the largest states. All 51 rows contain numeric values, so the comparison does not require imputing or zero-filling any jurisdiction.
A low value also does not mean that a jurisdiction has no distillate fuel oil use anywhere in its economy. This EIA series is limited to a specific electricity operational measure covering fuel consumed for electricity generation and useful thermal output. Transportation, heating, industrial, or other uses of distillate fuel oil are outside this measure.
The top ten account for 65.6%
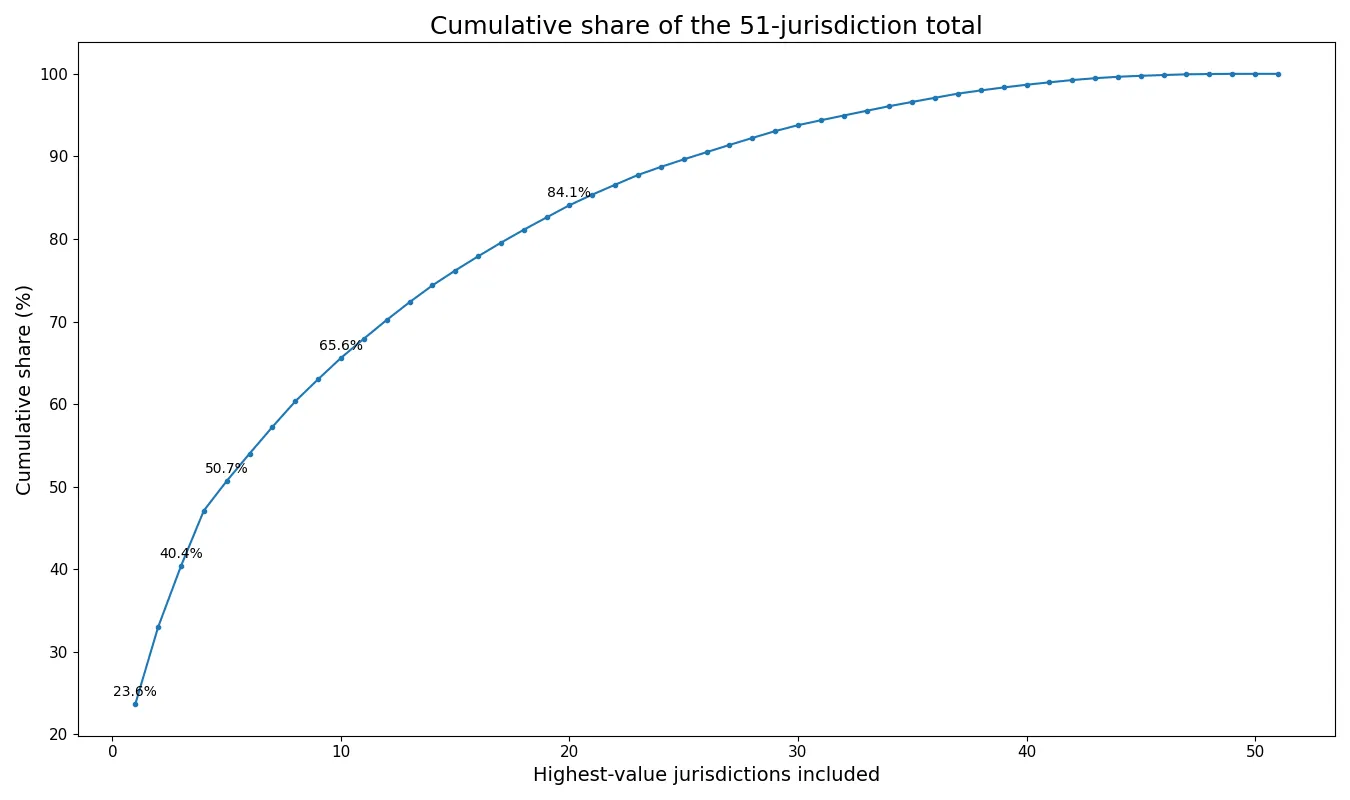
Hawaii alone accounts for 23.6% of the total, the top three for 40.4%, the top five for 50.7%, and the top ten for 65.6%. The rapid rise at the start of the cumulative curve confirms that heat-basis distillate-fuel consumption is not evenly distributed across states.
This concentration statistic is descriptive rather than a measure of market power or policy influence. It simply calculates the share of the 51-jurisdiction total represented by the largest published state values.
Texas ranks seventh in this heat-content series
Texas records 1.99963 million MMBtu, ranking 7th among the 51 jurisdictions. Florida records 1.91189, Ohio 1.65240, and Georgia 1.59583. Texas is in the upper group, but its value is only about 13.7% of Hawaii’s.
The cross-state differences may reflect generation fleets, fuel availability, dispatch patterns, peaking requirements, combined heat and power operations, and other factors, but this dataset alone does not identify the cause of any individual state value. Plant-level and fuel-specific operational data would be needed for a causal explanation.
Million MMBtu is a heat-content unit, not a physical fuel quantity
MMBtu means one million British thermal units. Because the series unit is million MMBtu, the published numbers measure fuel heat content on that scale. They are not direct counts of barrels or gallons. EIA publishes physical fuel-consumption measures separately, and those should be used when the analytical question concerns quantities of fuel rather than energy content.
Form EIA-923 includes electricity generation, fuel consumption, useful thermal output, stocks, and other power-plant operating information. Keeping field definitions and units separate is essential when comparing state data. Heat-content values are appropriate for energy-input comparisons; physical-unit values are appropriate for quantity comparisons.
A single year cannot establish a trend
The data provide a 2024 cross-section. They do not show whether any state is increasing or decreasing distillate-fuel consumption. A trend analysis would require multiple years of the same total-consumption-btu field, the same distillate fuel oil facet, the same sector definition, state geography, and million MMBtu unit.
Mixing a physical-unit series with a heat-content series would create an invalid growth comparison even if the fuel and year labels look similar. Consistency across field, fuel, sector, geography, frequency, and unit is the foundation of a valid time series.
Source and the main 2024 pattern
The data come from U.S. Energy Information Administration Form EIA-923 detailed data and the related electric-power operational data series. EIA describes Form EIA-923 as collecting generation, fuel consumption, stocks, and other power-plant operating information. The EIA Open Data documentation explains how API data fields and facets are requested.
The main 2024 result is strong concentration at the top. Hawaii accounts for 23.6% of the total and the top ten for 65.6%. The median is only 0.53969 compared with a mean of 1.21121, and all 51 jurisdictions have positive observations. The state distribution is therefore best understood as a small high-consumption group above a much larger set of low and moderate values.
Frequently Asked Questions
What is the unit of this series?
The unit is million MMBtu. It measures the heat content of distillate fuel oil consumed for electricity generation and useful thermal output.
Does Hawaii ranking first mean it generates the most electricity from distillate fuel oil?
No. This is a fuel heat-content consumption measure, while net electricity generation is a separate EIA metric.
Are District of Columbia and Idaho zero values?
No. Both are small positive values, and there are no official zero observations in the 51-row dataset.
Why is the mean so much higher than the median?
Hawaii, Alaska, and several other large observations pull the average upward. The mean is 1.21121, while the median is 0.53969.
Related Articles
Green Map creates custom-edited map images using open geographic data sources such as geoBoundaries, Natural Earth, OpenStreetMap, and government open data. These maps are edited visual materials, not raw data files, and are provided for education, documents, presentations, and graphic reference.