Fuel consumed for electricity generation in the U.S. Electric Power sector differs enormously by state. In the U.S. Energy Information Administration’s 2025 Electric Power Operations data, the 50 states and the District of Columbia total 33,184.76 million MMBtu when fueltypeid is ALL and the sector is Electric Power. Texas is the largest state at 3,795.93 million MMBtu, equal to 11.44% of the 51-jurisdiction total. Pennsylvania follows at 2,058.52 million MMBtu and Florida at 1,998.07.
The sector definition is essential. EIA provides closely related series for different sector facets, including broader all-sector totals and more specific plant categories. This article uses sectorid=98, Electric Power, together with the consumption-for-eg-btu field and the all-fuels category. A similarly titled article using another sector can therefore have different state values and shares even when the year and fuel category are the same.
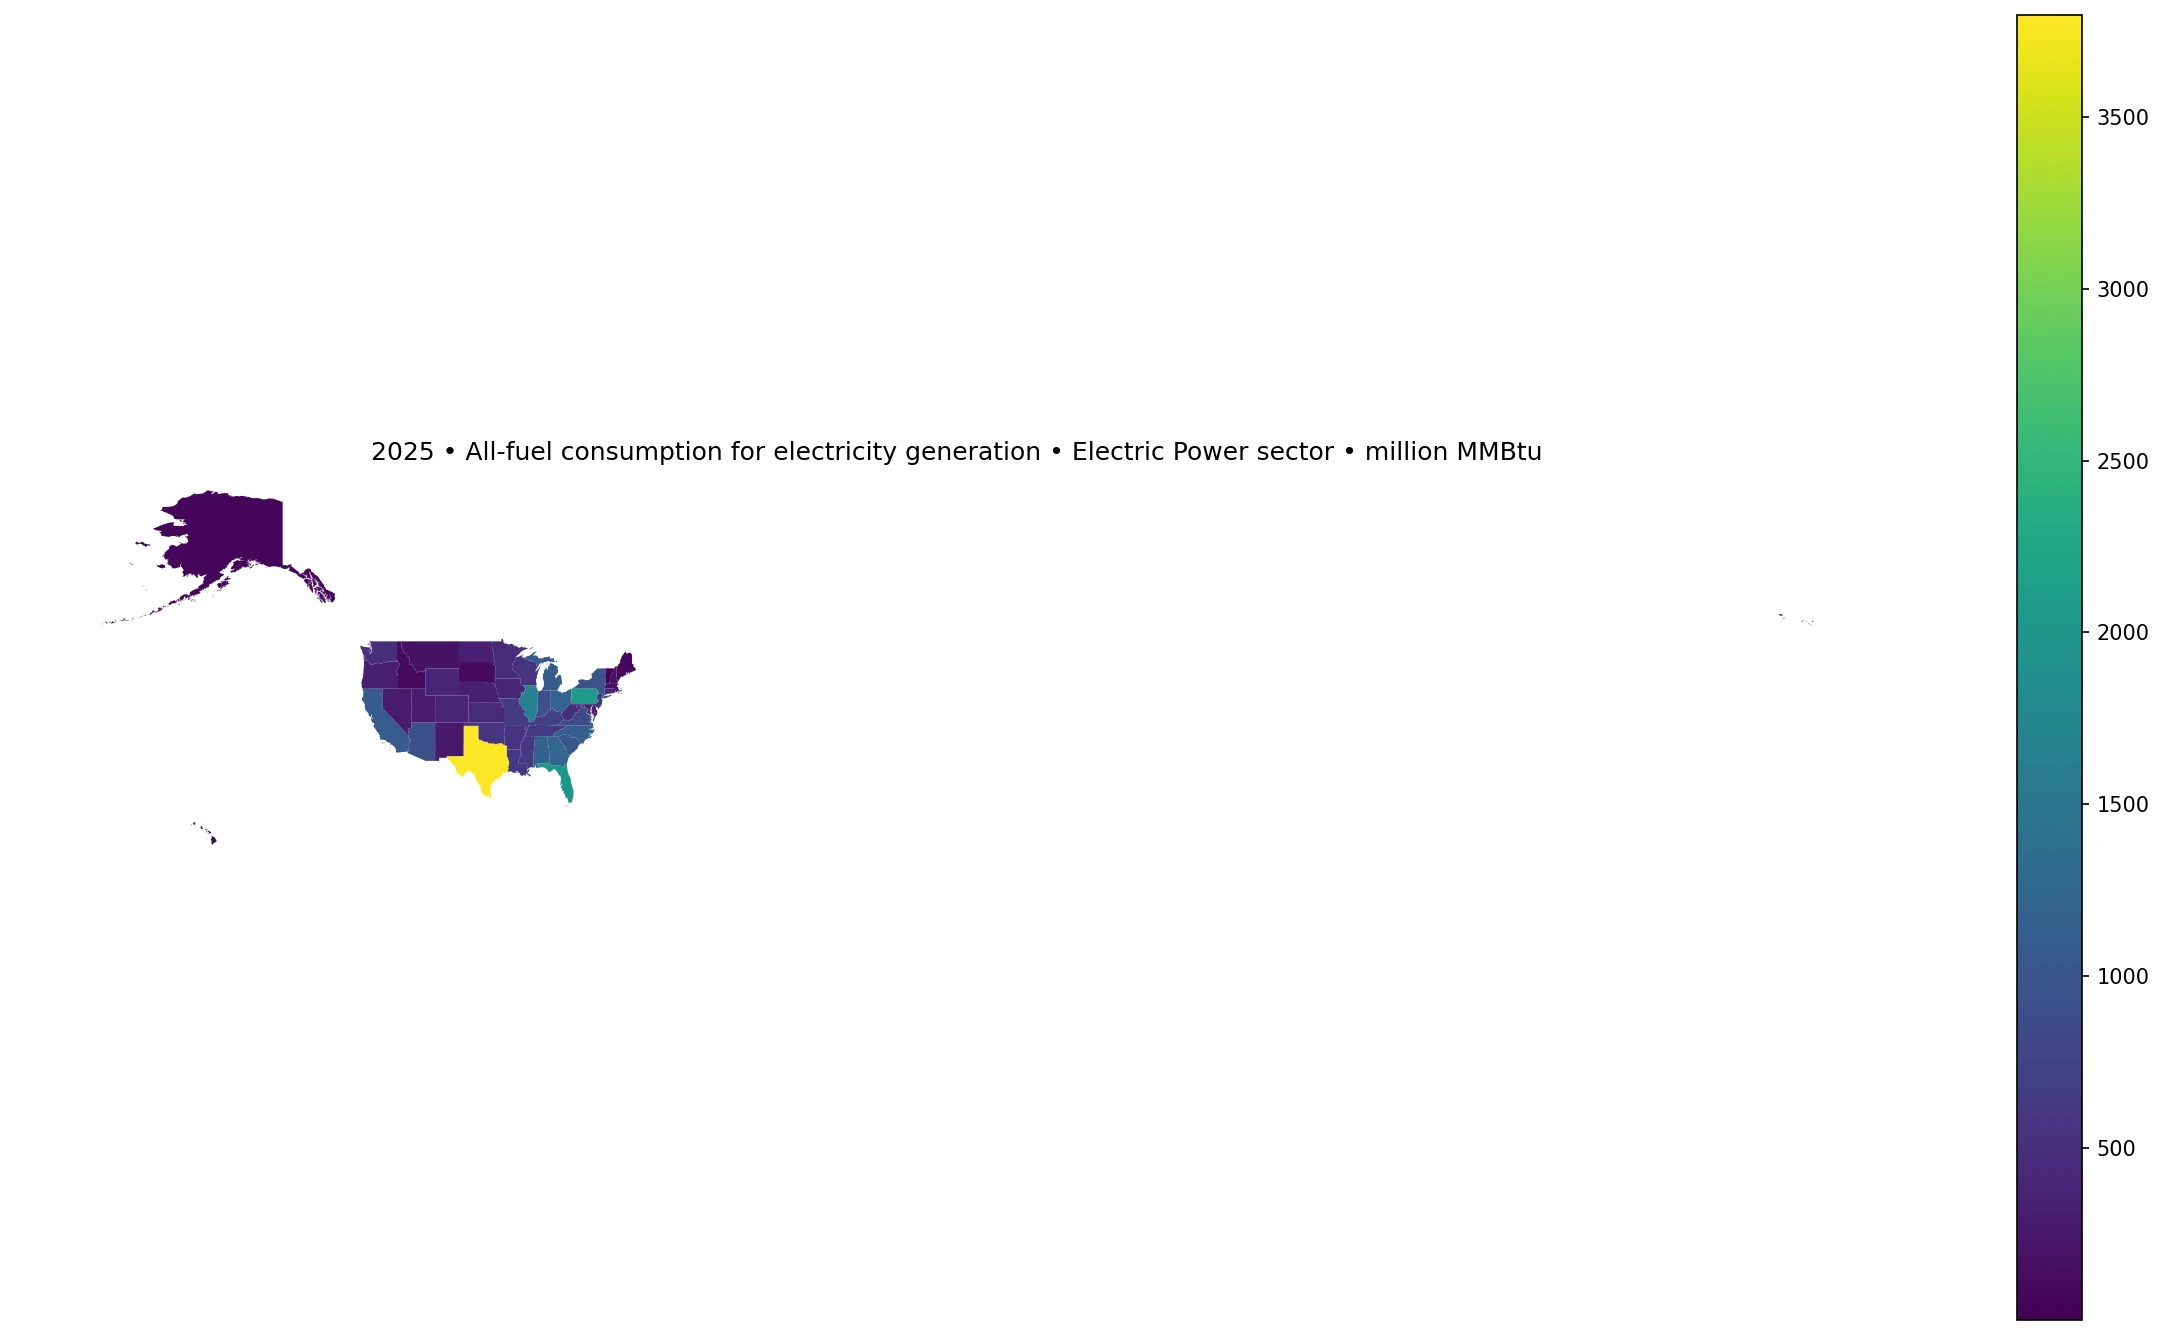
Table of Contents
The 51-jurisdiction total is 33,184.76 million MMBtu
The mean is 650.68 million MMBtu, while the median is 499.74 million MMBtu. That gap of roughly 151 million MMBtu shows how strongly the largest state systems pull the arithmetic average upward. The first quartile is 259.76 million MMBtu and the third quartile is 909.79, so the middle half of state observations lies in a much narrower band than the full range.
Ten states record at least 1,000 million MMBtu and 25 reach at least 500 million MMBtu. Seven jurisdictions are below 100 million MMBtu. The range extends from only 0.17 million MMBtu in the District of Columbia to 3,795.93 million MMBtu in Texas. The maximum is roughly 7.6 times the median, making the distribution clearly right-skewed.
The ten largest state observations
| State | million MMBtu | Share of 51-jurisdiction total |
|---|---|---|
| Texas | 3795.93 | 11.44% |
| Pennsylvania | 2058.52 | 6.20% |
| Florida | 1998.07 | 6.02% |
| Illinois | 1691.35 | 5.10% |
| Georgia | 1226.17 | 3.69% |
| Ohio | 1195.14 | 3.60% |
| Alabama | 1162.55 | 3.50% |
| North Carolina | 1139.60 | 3.43% |
| California | 1082.40 | 3.26% |
| Michigan | 1072.35 | 3.23% |
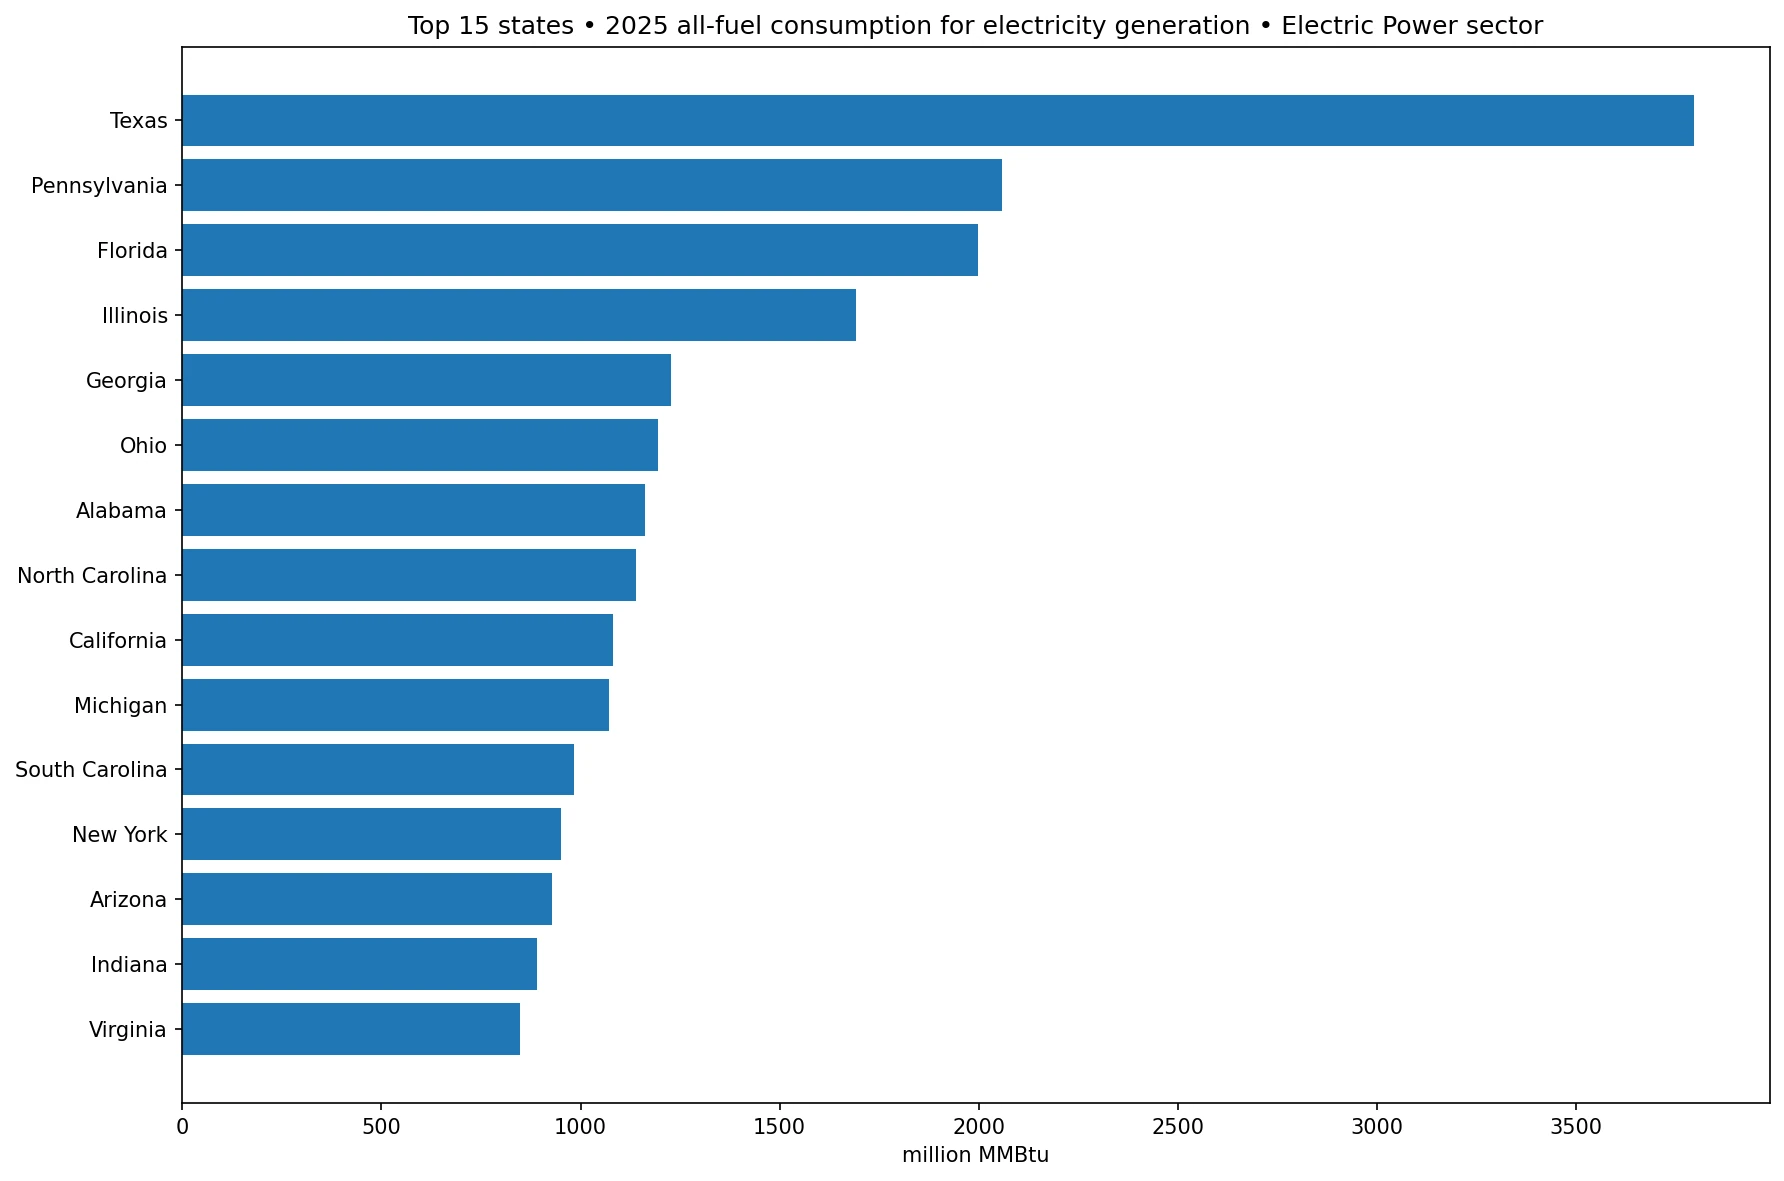
Texas exceeds Pennsylvania by about 1,737.41 million MMBtu. Pennsylvania records 2,058.52, Florida 1,998.07, Illinois 1,691.35, and Georgia 1,226.17 million MMBtu. Ohio, Alabama, North Carolina, California, and Michigan also exceed 1,000 million MMBtu, giving the top ten a geographically broad mix across the South, Midwest, Northeast, and West.
The ranking should not be interpreted as a ranking of electricity efficiency or policy performance. Absolute fuel consumption is influenced by the scale of electricity generation, the mix of generating technologies, thermal efficiency, dispatch patterns, demand, imports and exports, and the composition of generating fleets. The state total tells us how much energy input is recorded for electricity generation, but it does not isolate the reason.
The top ten states account for almost half of the total
Texas alone accounts for 11.44% of the 51-jurisdiction total. Texas and Pennsylvania together represent 17.64%. The top five states account for 32.45%, and the top ten reach 49.49%. In other words, ten states are responsible for almost half of the fuel energy input recorded in this Electric Power sector series.
Concentration does not automatically imply inefficiency. A state that generates far more electricity than another can consume more fuel even with relatively efficient plants. Different generation technologies also have different heat rates and accounting conventions. A comparison of efficiency would need output and input together, typically through heat-rate measures or a similar efficiency framework.
The smallest jurisdictions sit far below the national median
| State or jurisdiction | million MMBtu | Share of 51-jurisdiction total |
|---|---|---|
| District of Columbia | 0.17 | 0.00% |
| Vermont | 12.49 | 0.04% |
| Delaware | 35.25 | 0.11% |
| Alaska | 48.46 | 0.15% |
| Rhode Island | 76.21 | 0.23% |
| Hawaii | 79.14 | 0.24% |
| Maine | 86.18 | 0.26% |
| Idaho | 102.15 | 0.31% |
| South Dakota | 102.57 | 0.31% |
| Massachusetts | 161.57 | 0.49% |
The District of Columbia is the smallest observation at 0.17 million MMBtu. Vermont records 12.49, Delaware 35.25, Alaska 48.46, Rhode Island 76.21, and Hawaii 79.14 million MMBtu. Maine, Idaho, and South Dakota are also near or below roughly 100 million MMBtu. Seven of the 51 observations fall under 100 million MMBtu.
A small value is not the same as low electricity consumption by residents. This metric measures fuel consumed inside the Electric Power sector for electricity generation. A jurisdiction can use electricity generated elsewhere, import power, or have a small local generating fleet. It also does not include every form of energy consumption in residential, commercial, transportation, and industrial activity.
Electric Power and all-sector series are different scopes
EIA’s sector facet controls which set of establishments or generating activities contributes to the value. This article fixes sectorid=98. A broader all-sector series can include observations outside the Electric Power sector and will therefore produce a different total. The distinction is important when comparing closely related posts or API requests: identical year, state, fuel category, and field do not make two datasets identical if the sector facet differs.
This narrower scope is useful when the question is specifically about the electricity industry. It excludes the ambiguity that can arise when other sectors are included. Readers comparing this article with a broader all-fuels article should expect some states to shift in both absolute value and national share because the underlying sector universe is different.
Fuel input in Btu is not electricity output
The consumption-for-eg-btu field represents the energy content of fuels consumed for electricity generation. It is an input measure. Net generation, normally measured in megawatthours, is an output measure. The relationship between the two depends on the efficiency of the generating technologies and on the energy sources used.
For that reason, the state with the largest fuel input is not automatically the state with the largest net electricity output by the same margin. Some technologies require more thermal input per unit of electricity than others, and noncombustible renewable generation is represented differently from combustible fuels in energy statistics. To answer a generation question, net-generation data should be used directly.
The all-fuels total combines very different energy sources
The ALL fuel category aggregates the energy inputs that EIA assigns to the Electric Power sector. It does not tell us how much of a state’s total comes from natural gas, coal, nuclear, petroleum, renewable sources, or other categories. Two states with similar total fuel consumption can therefore have very different generation mixes and emissions profiles.
That distinction is especially important for Texas, Pennsylvania, Illinois, and other large systems. Their positions in the all-fuels ranking reflect the combined scale of their generating fleets rather than one particular fuel. Resource-level analysis requires separate EIA fuel facets and should not be inferred from the total alone.
The ranking is an absolute-scale comparison, not an energy-transition score
Texas ranking first means that its Electric Power sector has the largest recorded all-fuel energy input for electricity generation in this dataset. It does not mean the state has the highest fossil-fuel share, the lowest renewable share, the highest emissions rate, or the least efficient generating fleet. Each of those questions requires a different denominator or a different variable.
A more complete transition analysis would pair this series with renewable and fossil generation shares, emissions, installed capacity, electricity sales, heat rates, and possibly per-capita or per-output measures. This article intentionally stays with the narrower descriptive question of where the absolute fuel input is largest.
One year is a snapshot, not a trend
The reference year is 2025. A single annual observation cannot show whether a state is increasing or reducing its fuel input over time. Weather, electricity demand, fuel prices, maintenance schedules, plant retirements, new capacity, hydro conditions, and changes in interstate power flows can all affect year-to-year values.
A valid trend comparison needs the same EIA route, field, fuel facet, sector facet, geography, and unit across years. Changing from sectorid=98 to another sector or from ALL to an individual fuel would create a different series rather than a continuation of the same one.
How to read the map and tables together
The map is useful for locating broad geographic concentrations, while the table preserves exact state values and shares. The top-15 chart makes the scale gap between Texas and the next group easier to see. None of the visuals should be read as a policy ranking; they are three different views of the same absolute input measure.
The median and quartiles provide context that a choropleth alone cannot show. A state near 500 million MMBtu sits around the middle of the 51 observations, while a state above roughly 910 million MMBtu is in the upper quarter. These reference points make the large Texas value easier to interpret without treating every map shade as equally important.
Data source and calculation method
The source is the U.S. Energy Information Administration’s Electric Power Operations (Annual and Monthly) API. The query uses the 2025 annual frequency, the consumption-for-eg-btu field, fueltypeid=ALL, and sectorid=98 for Electric Power. The unit is million MMBtu. The verified dataset contains 51 numeric observations covering all 50 states and the District of Columbia.
All totals, averages, medians, quartiles, rankings, and shares are calculated directly from those 51 observations. No missing value was replaced with zero. State abbreviations were joined to U.S. state polygons derived from county boundaries, and all 51 observations matched successfully, producing a 100% geographic join rate.
Frequently Asked Questions
Does this series cover all economic sectors?
No. It uses sectorid=98 for the Electric Power sector. A broader all-sector query can produce different state values even with the same year and fuel category.
Is million MMBtu the amount of electricity generated?
No. It measures fuel-energy input used for generation. Electricity output is measured separately, typically in megawatthours.
Does Texas ranking first mean its power plants are less efficient?
No. Absolute fuel input depends heavily on generation scale and resource mix. Efficiency comparisons require output-to-input measures such as heat rate.
Related Articles
Green Map creates custom-edited map images using open geographic data sources such as geoBoundaries, Natural Earth, OpenStreetMap, and government open data. These maps are edited visual materials, not raw data files, and are provided for education, documents, presentations, and graphic reference.