The U.S. Energy Information Administration state series for 2025 shows a wide spread in the amount of fuel energy reported for electricity generation. This slice fixes fueltypeid=ALL, sectorid=99 (All Sectors), and the field consumption-for-eg-btu. It contains 51 observed values: every state plus the District of Columbia, with no missing entries. Adding those 51 observations gives 34,209.33 million MMBtu. Texas is the largest state value at 4,056.40 million MMBtu, followed by Pennsylvania at 2,095.07, Florida at 2,037.02, and Illinois at 1,708.07.
The unit and field are essential to the interpretation. consumption-for-eg-btu is a fuel-energy input measure for electricity generation expressed in Btu terms. It is not electricity generation in MWh, generating capacity in MW, or retail electricity demand. Sector 99 is labeled All Sectors inside EIA’s electric-power operational dataset; that label should not be expanded to mean every form of final energy use in the U.S. economy. The comparison is specifically about fuel used for electricity generation within this EIA series.
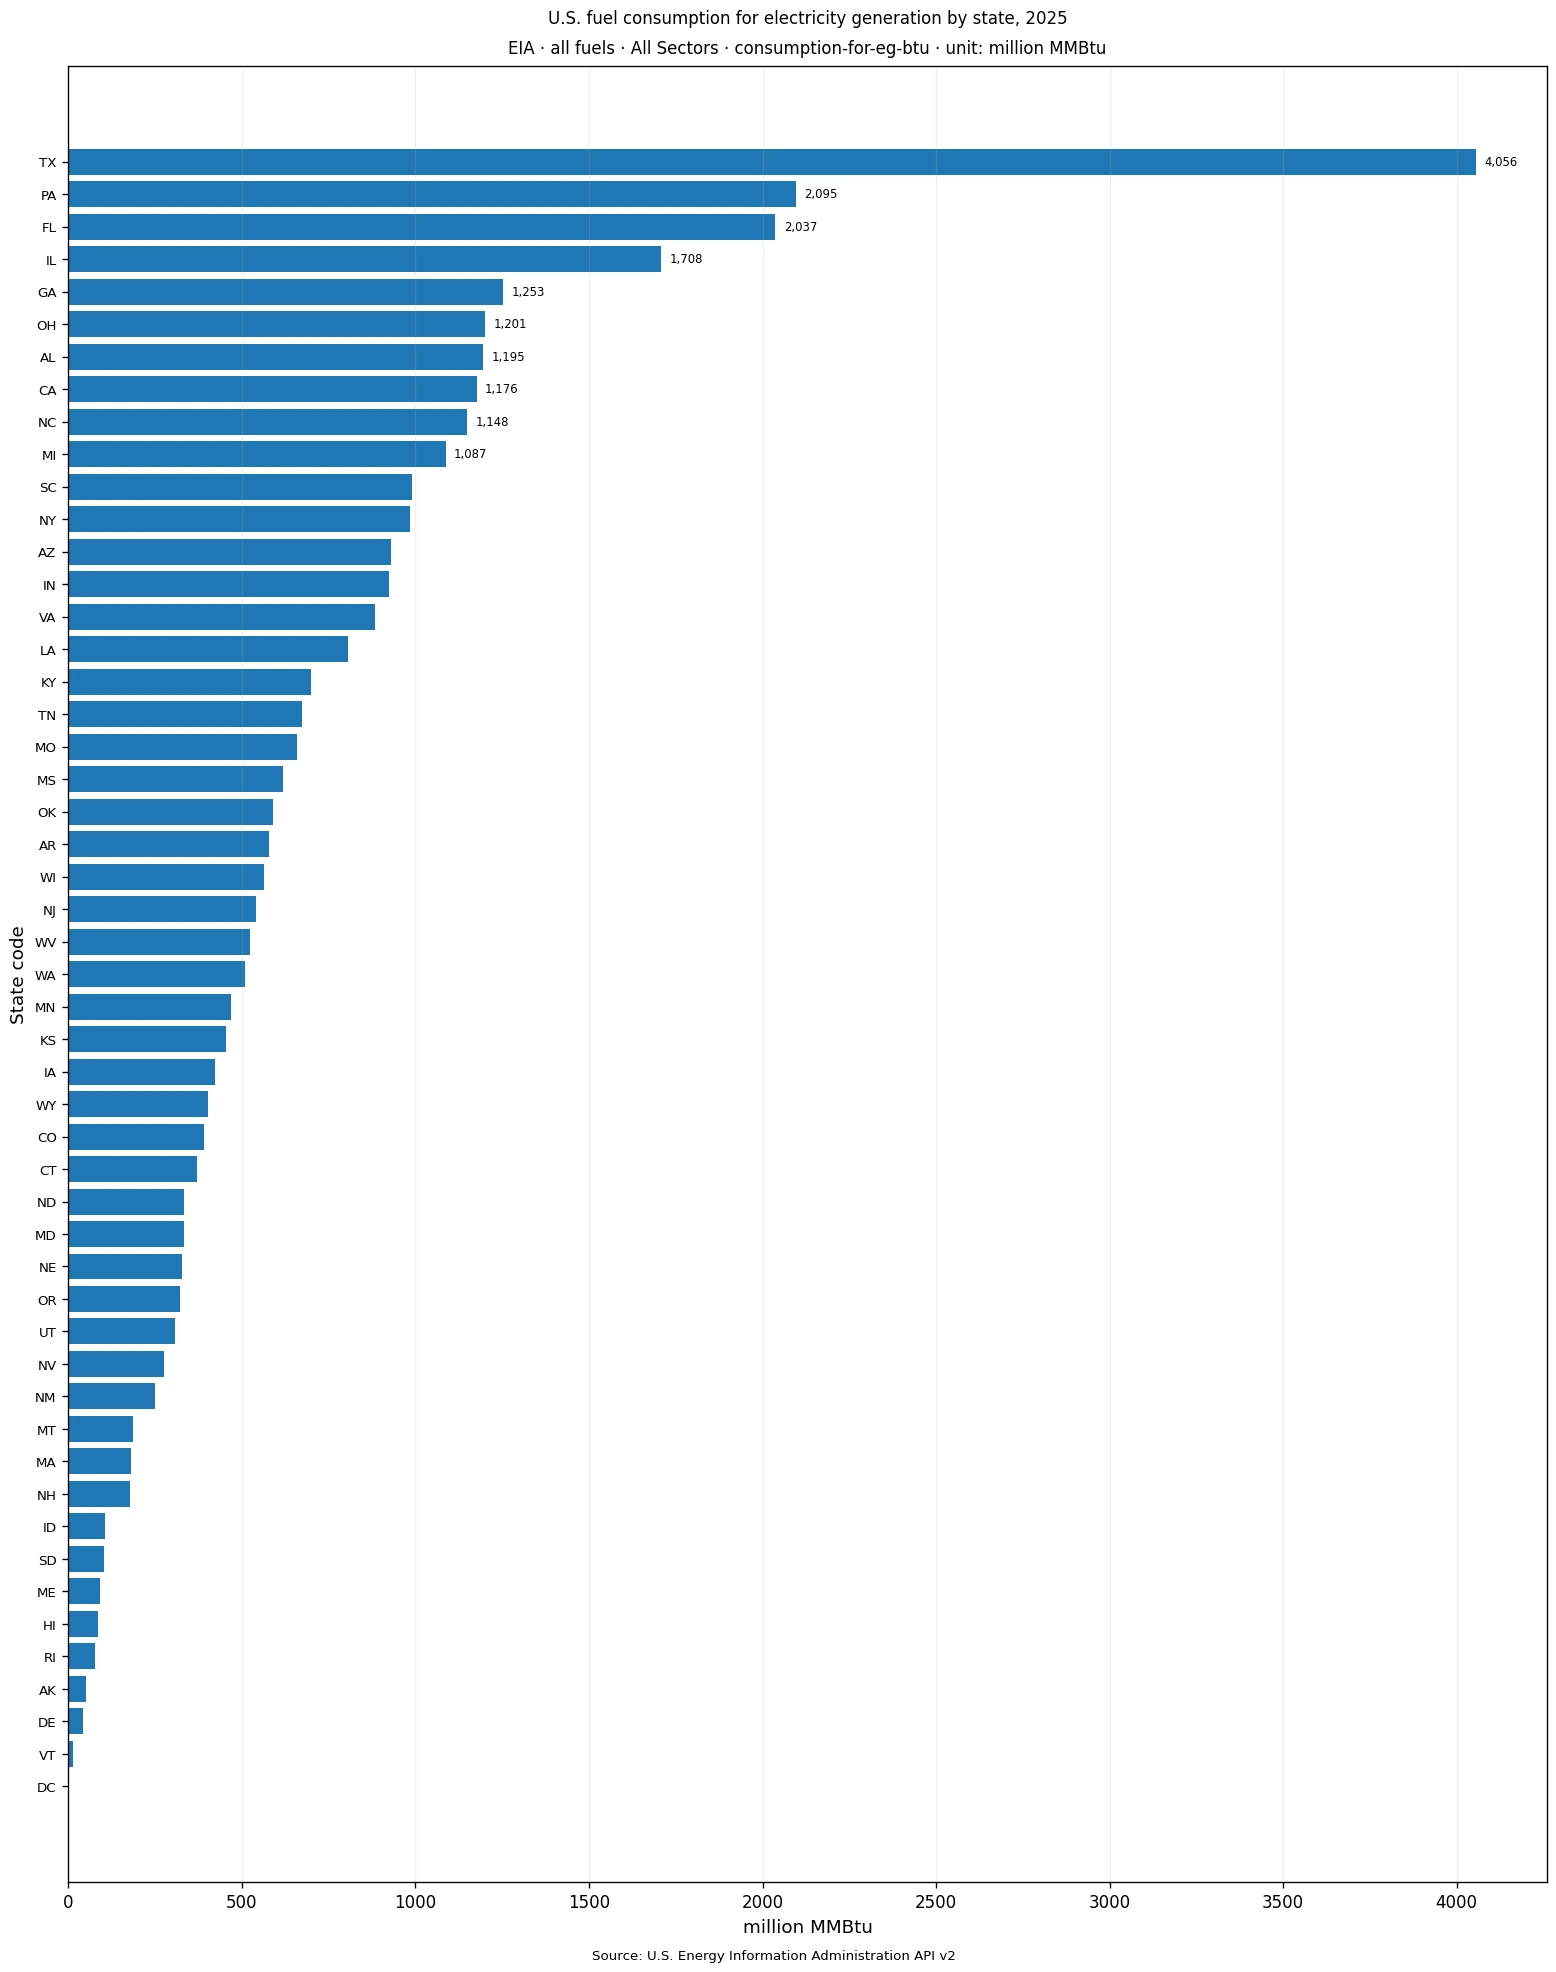
Table of Contents
Texas leads, but the state distribution is not dominated by a single observation
Texas accounts for 11.86% of the simple sum of the 51 state and District of Columbia observations. Pennsylvania contributes 6.12%, Florida 5.95%, and Illinois 4.99%. The top two reach 17.98%, the top three 23.94%, and the top five 32.59%. Texas is clearly separated from the rest, but its share is still far below a majority, which means the all-fuels input is distributed across many large state electricity systems.
The share calculation uses the 51-row analytical sum as its denominator. It is not a state electricity mix percentage. Saying that Texas represents 11.86% does not mean that 11.86% of Texas electricity comes from a particular fuel, nor does it automatically mean that Texas generated 11.86% of all U.S. electricity. It only describes Texas’s part of this like-for-like set of state consumption-for-eg-btu observations.
The top tier spans the South, Midwest, Northeast, and West
The ten largest observations are Texas, Pennsylvania, Florida, Illinois, Georgia, Ohio, Alabama, California, North Carolina, and Michigan. No single broad region controls the entire upper tier. Absolute fuel input for electricity generation can reflect the scale and operation of generating fleets, the mix of technologies, and the size of the state power system. It therefore does not simply reproduce population, land area, or gross state product rankings.
California, for example, ranks eighth at 1,176.20 million MMBtu, while Pennsylvania ranks second at 2,095.07. Alabama is seventh at 1,195.05. Those differences are descriptive outcomes of the fixed EIA series, not proof of a single causal factor. Explaining why one state is higher than another would require additional generation-by-fuel, capacity, plant-operation, and possibly interchange data.
| Rank | State / area | Code | 2025 value | Share of 51-value sum |
|---|---|---|---|---|
| 1 | Texas | TX | 4,056.40 | 11.86% |
| 2 | Pennsylvania | PA | 2,095.07 | 6.12% |
| 3 | Florida | FL | 2,037.02 | 5.95% |
| 4 | Illinois | IL | 1,708.07 | 4.99% |
| 5 | Georgia | GA | 1,253.47 | 3.66% |
| 6 | Ohio | OH | 1,200.99 | 3.51% |
| 7 | Alabama | AL | 1,195.05 | 3.49% |
| 8 | California | CA | 1,176.20 | 3.44% |
| 9 | North Carolina | NC | 1,148.47 | 3.36% |
| 10 | Michigan | MI | 1,086.78 | 3.18% |
The median is 510.46 million MMBtu, well below the mean of 670.77
The 26th observation in the ordered distribution is Washington at 510.46 million MMBtu, which is also the median. The arithmetic mean is 670.77, about 160.31 million MMBtu higher. The difference is caused by the upper tail, especially Texas and several states above 1,000 million MMBtu. For a description of a typical middle observation, the median is less sensitive to those high values than the mean.
The first quartile is 263.33 and the third quartile is 927.22 million MMBtu, so the middle half of the distribution lies roughly between those two values. Ten jurisdictions are at or above 1,000 million MMBtu, and 26 are at or above 500. Only seven fall below 100. The all-fuels series therefore has a broad center rather than a pattern in which most states cluster near zero.
Several southeastern states sit high in the distribution
Florida reports 2,037.02 million MMBtu, Georgia 1,253.47, Alabama 1,195.05, and North Carolina 1,148.47. South Carolina is close to 1,000 at 991.40, while Virginia records 882.98 and Louisiana 806.78. This cluster shows that large absolute fuel inputs are common across several southeastern electricity systems.
Because fueltypeid=ALL combines fuel categories, the state totals do not reveal which fuel is responsible for a high value. A large Florida observation cannot by itself identify natural gas, coal, nuclear, renewable energy, or another source as the main explanation. That question requires a separate comparison using detailed fuel facets while holding the year, sector, field, and geography constant.
Midwestern states also occupy much of the upper and middle range
Illinois is fourth nationwide at 1,708.07 million MMBtu. Ohio reports 1,200.99 and Michigan 1,086.78. Indiana is at 924.19, Missouri at 659.45, Wisconsin at 563.22, and Minnesota at 468.36. Iowa and Kansas, which can rank very high in some renewable-specific measures, are at 424.01 and 455.50 respectively in this all-fuels series.
That contrast is a useful reminder that fuel-specific rankings and all-fuels rankings answer different questions. A state can be prominent in wind or renewable energy without leading total fuel energy input for electricity generation. Conversely, a state with substantial fossil or nuclear generation may rise in an all-fuels comparison. Field and facet identity should be preserved whenever related EIA series are compared.
Western states cover a wide range rather than one regional pattern
California reports 1,176.20 million MMBtu. Arizona is at 930.24, Washington at 510.46, Wyoming at 403.58, and Colorado at 391.43. Oregon reports 321.28, Utah 306.87, Nevada 275.62, and New Mexico 251.03. Alaska is much lower at 50.96. Even within the West, the values range from the national upper tier to near the bottom.
These values should not be read as a ranking of resource potential. Resource potential can include undeveloped wind, solar, hydro, or fuel resources, while this series reflects reported operational fuel energy used for electricity generation. State electricity consumption is also a different concept because power can move across state boundaries. The metric belongs to the generating side of the electricity system.
Pennsylvania stands out in the Northeast while smaller systems sit near the bottom
Pennsylvania is the second-largest state observation at 2,095.07 million MMBtu. New York reports 985.37, New Jersey 541.04, and Connecticut 371.25. Massachusetts and New Hampshire are near 180, Maine is 91.50, Rhode Island 77.91, and Vermont 12.50. The regional spread is therefore very large even among geographically close states.
Small reported values are not missing data. The dataset has no missing entries, and the minimum—District of Columbia at 1.67936 million MMBtu—is a real positive observation. Treating small values as zero or “no data” would change rankings, totals, and visual interpretation. Missingness, an actual zero, and a small positive number are three different data states.
All ten lowest values are positive observations
The bottom of the ranking includes the District of Columbia at 1.68, Vermont at 12.50, Delaware at 41.45, Alaska at 50.96, Rhode Island at 77.91, Hawaii at 86.81, and Maine at 91.50 million MMBtu. There are no reported zeros in the 51-row slice. The lower tail is therefore composed of small but measured fuel inputs rather than imputed values.
A low absolute value is not a score for efficiency, environmental performance, or policy quality. Small electricity systems can naturally have small absolute fuel inputs, and the location of generation relative to load can differ widely. Performance comparisons would need a defined denominator such as generation output, population, electricity demand, or emissions. Adding such a denominator would create a new metric and should be labeled as a separate analysis.
| Low-order rank | State / area | Code | 2025 value | Share of 51-value sum |
|---|---|---|---|---|
| 1 | District of Columbia | DC | 1.68 | 0.00% |
| 2 | Vermont | VT | 12.50 | 0.04% |
| 3 | Delaware | DE | 41.45 | 0.12% |
| 4 | Alaska | AK | 50.96 | 0.15% |
| 5 | Rhode Island | RI | 77.91 | 0.23% |
| 6 | Hawaii | HI | 86.81 | 0.25% |
| 7 | Maine | ME | 91.50 | 0.27% |
| 8 | South Dakota | SD | 103.26 | 0.30% |
| 9 | Idaho | ID | 105.43 | 0.31% |
| 10 | New Hampshire | NH | 176.40 | 0.52% |
The 34,209.33 million MMBtu sum is an analytical sum of state rows
The total used for the state shares is obtained by adding the 51 observations in this dataset. It is useful for within-table concentration measures, but it should not automatically replace a separately published national EIA total. A national series can differ because of geographic coverage, revision timing, aggregation rules, or the exact population of reporting entities. A national comparison should verify the same field, fuel facet, sector facet, year, and frequency.
The distinction matters because the EIA route contains several fields with similar names. consumption-for-eg, consumption-for-eg-btu, total-consumption-btu, and consumption-uto do not represent the same quantity. A shared unit or a similar title is not enough to merge them. This analysis uses only consumption-for-eg-btu and does not combine values from adjacent metrics.
All Sectors refers to the sector dimension of the electricity dataset
Sectorid=99 is labeled All Sectors in EIA’s electric-power-operational-data route. The wording is broad, but its scope remains inside the electricity operations dataset. It should not be interpreted as all household, transportation, industrial, and commercial energy consumption across the entire economy. The field still concerns fuel consumption for electricity generation.
A precise technical description is “all fuels, sector 99 All Sectors, consumption-for-eg-btu, annual 2025, state geography.” That phrase is too cumbersome to repeat in every sentence, but it identifies the series unambiguously. Preserving those dimensions is especially important when a site contains many related EIA articles, because small facet changes can create genuinely different indicators.
Fuel input, electricity generation, and generating capacity are not interchangeable
Electricity generation is generally reported in MWh or kWh, while generating capacity is reported in MW. The current series uses million MMBtu, a heat-energy unit. The measures are connected but not interchangeable because plant efficiency, fuel heat content, technology, and operating conditions affect how much fuel energy is required to produce electricity.
A question such as “which state generated the most electricity?” should be answered with a generation series. A question about the largest installed fleet requires capacity data. This dataset answers a narrower question: how much fuel energy EIA reports as consumed for electricity generation in 2025 under the all-fuels, All Sectors state slice. Matching the metric to the question prevents a statistically correct number from being used in the wrong context.
One year is a cross-section, not a trend
The file contains only 2025 observations. It can establish the 2025 ranking and distribution, but it cannot show whether Texas increased from 2024, whether Pennsylvania declined, or whether state gaps are widening. A trend analysis would require multiple years from the same route with consumption-for-eg-btu, fueltypeid=ALL, sectorid=99, annual frequency, and the same state geography held constant.
EIA can also revise historical observations. If this series is updated in a later release, some 2025 values may change. A maintained time series should retain retrieval dates or vintages and rerun calculations after upstream revisions. The figures here correspond to the verified 2025 data included for this comparison.
The distribution has a broad middle as well as a visible upper tail
Twenty-six jurisdictions are at or above 500 million MMBtu and 25 are below that threshold, which closely matches the median of 510.46. Ten exceed 1,000 million MMBtu, while only seven are below 100. This is not a distribution where most states are near zero and a few dominate everything. Instead, many states occupy the middle hundreds, with Texas forming a pronounced high-end observation.
The top ten together account for 49.57% of the 51-value sum. That means more than half remains distributed across the other 41 jurisdictions. A headline about the largest state is useful, but the quartiles and cumulative shares provide a better picture of the full state structure. They show both concentration at the top and substantial contribution from the middle of the ranking.
Source and reproducibility
The source is the U.S. Energy Information Administration API v2 route electricity/electric-power-operational-data. The slice uses annual frequency, year 2025, fueltypeid=ALL, sectorid=99 (All Sectors), the consumption-for-eg-btu field, and million MMBtu units. The geography is the 50 states plus the District of Columbia. All 51 observations are present, with no imputation, zero-filling, or mixing of years.
Keeping those conditions fixed reproduces the descriptive results: Texas at 4,056.40 million MMBtu, Pennsylvania at 2,095.07, Florida at 2,037.02, and a 51-row sum of 34,209.33. The median is 510.46 and the mean 670.77. The most defensible conclusion is that 2025 all-fuels energy input for electricity generation was widely distributed across state power systems, with Texas recording the largest single state value.
Frequently Asked Questions
Which state had the largest all-fuel input for electricity generation in 2025?
Texas was the largest observation at 4,056.40 million MMBtu, equal to about 11.86% of the simple sum of the 51 state and District of Columbia values.
Does All Sectors mean all energy use in the U.S. economy?
No. Sector 99 All Sectors is the sector aggregation inside EIA electric-power-operational-data. The field still measures fuel consumed for electricity generation, not every form of final energy use.
Can this series be used as a state electricity-generation ranking?
Not directly. consumption-for-eg-btu is fuel-energy input measured in million MMBtu. Electricity generation in MWh and generating capacity in MW are different metrics.
Related Articles
Green Map creates custom-edited map images using open geographic data sources such as geoBoundaries, Natural Earth, OpenStreetMap, and government open data. These maps are edited visual materials, not raw data files, and are provided for education, documents, presentations, and graphic reference.