The sourcing mix of merchandise imports differed widely across reporting economies in 2023. World Bank indicator TM.VAL.MRCH.R3.ZS measures the percentage of each reporter’s total merchandise imports that came from economies classified by the World Bank as low- and middle-income partners in Latin America and the Caribbean. The source table contains 217 country and economy rows. 199 have a reported 2023 value, while 18 are source-missing.
This is a supplier-share indicator rather than a measure of the absolute size of imports. A 20% reading means that roughly one dollar in five of a reporter’s merchandise imports came from the defined partner group. Two economies can post the same 20% while buying radically different dollar amounts because their total import bills can be very different. The map is therefore best used to compare the role of this supplier group inside each reporter’s import portfolio.
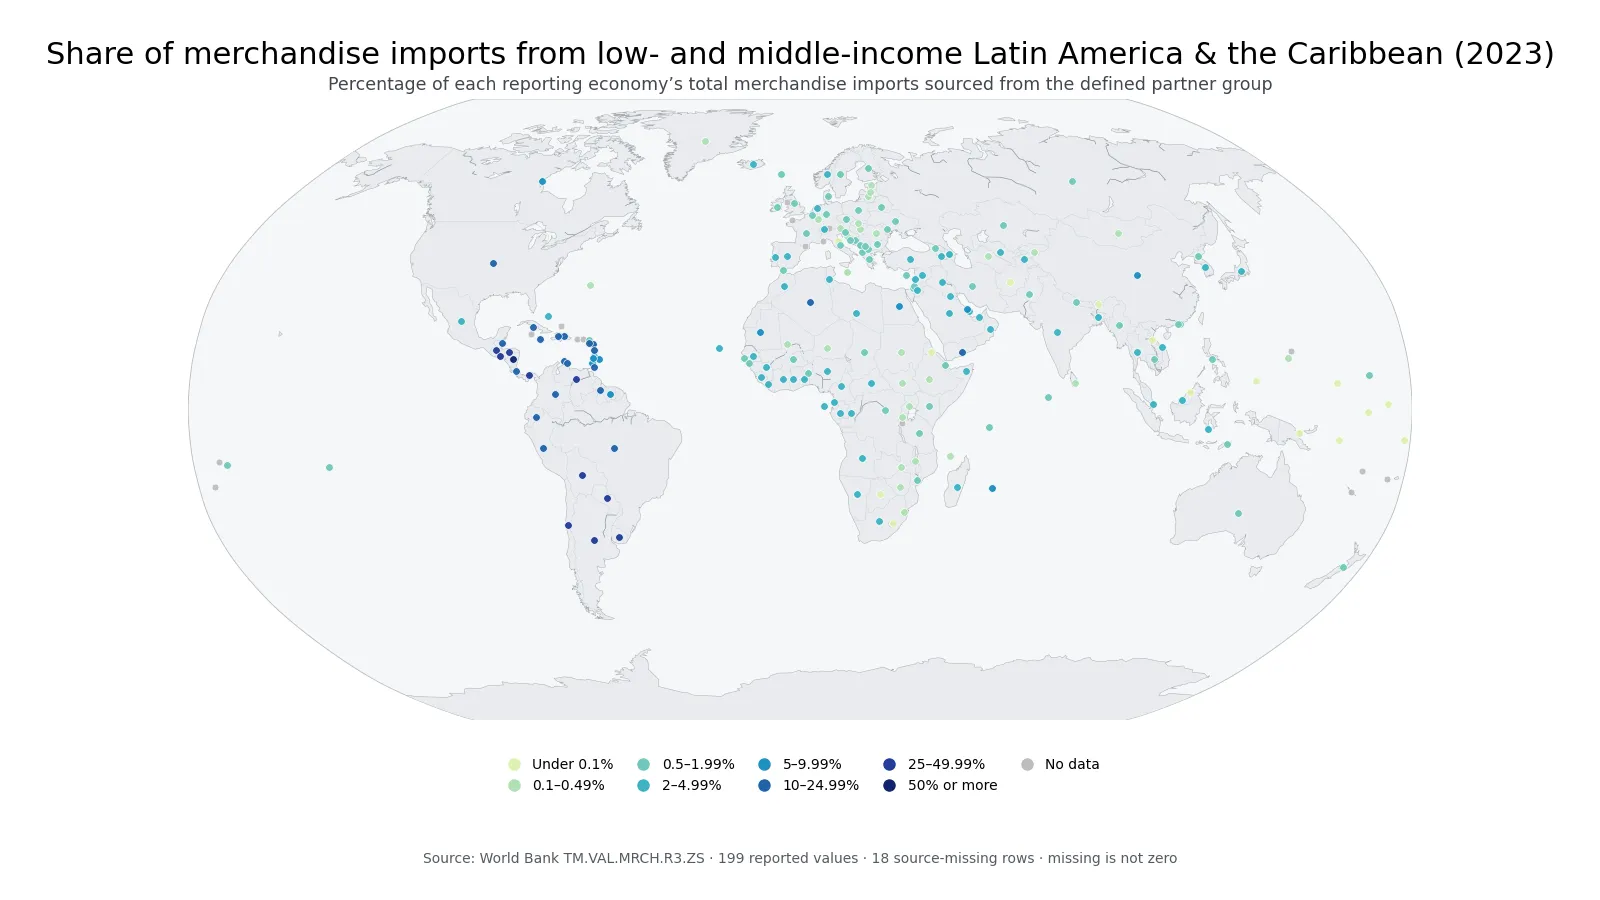
Table of Contents
Nicaragua sourced more than half of its merchandise imports from the defined partner group
Nicaragua records the largest share among the 199 reported observations at 50.79%. Bolivia follows at 39.57% and Uruguay at 39.26%. El Salvador, Argentina, Paraguay, Honduras, Guatemala, Venezuela and Chile complete the top ten. All ten are located in Latin America or the Caribbean, so the upper end of the distribution is dominated by reporters that are themselves inside the broader destination region.
That concentration is descriptive, not a proof of why the shares are high. The indicator does not identify the products being traded, the effect of trade agreements, re-export activity, customs treatment or logistics networks. A high observation tells us that the defined low- and middle-income Latin American and Caribbean suppliers occupied a large place in the reporter’s 2023 merchandise-import mix. Explaining the mechanism behind the share requires product-level and multi-year evidence.
| Top rank | Reporter | Import share | Bottom rank | Reporter | Import share |
|---|---|---|---|---|---|
| 1 | Nicaragua | 50.79% | 1 | Tuvalu | 0.0007% |
| 2 | Bolivia | 39.57% | 2 | Kiribati | 0.012% |
| 3 | Uruguay | 39.26% | 3 | San Marino | 0.015% |
| 4 | El Salvador | 34.98% | 4 | Solomon Islands | 0.021% |
| 5 | Argentina | 34.37% | 5 | Lesotho | 0.021% |
| 6 | Paraguay | 33.55% | 6 | Naoero | 0.028% |
| 7 | Honduras | 32.98% | 7 | Eritrea | 0.040% |
| 8 | Guatemala | 29.16% | 8 | Afghanistan | 0.050% |
| 9 | Venezuela, RB | 27.10% | 9 | Lao PDR | 0.053% |
| 10 | Chile | 26.92% | 10 | Brunei Darussalam | 0.057% |
Import sourcing differs sharply even among reporters in Latin America and the Caribbean
The regional pattern is far from uniform. Argentina reports 34.37%, Uruguay 39.26% and Paraguay 33.55%. Brazil is at 10.92%, Colombia at 17.68%, Costa Rica at 18.45%, and Mexico at 3.95%. Chile, meanwhile, is much higher at 26.92%. Being located in the same broad region does not imply the same degree of reliance on low- and middle-income suppliers within that region.
The denominator is central to the interpretation. A reporter can buy a substantial dollar value from Latin America and the Caribbean yet show a modest percentage if imports from North America, Europe, Asia or other sources are even larger. Another reporter with a smaller total import base can display a high share with fewer dollars in absolute terms. The metric captures the composition of sourcing, not the total scale of purchasing.
A 1.84% median versus a 5.08% mean reveals a long upper tail
The median among the 199 reported values is 1.84%, while the arithmetic mean is 5.08%. The first quartile is 0.74% and the third quartile is 3.89%, placing the middle half of observations between about 0.74% and 3.89%. The mean sits well above the median because a relatively small set of reporters has shares above 25%, including one observation above 50%.
| Share of total merchandise imports | Observations | Share of 199 |
|---|---|---|
| Under 0.1% | 15 | 7.5% |
| 0.1–0.49% | 29 | 14.6% |
| 0.5–1.99% | 59 | 29.6% |
| 2–4.99% | 55 | 27.6% |
| 5–9.99% | 10 | 5.0% |
| 10–24.99% | 20 | 10.1% |
| 25–49.99% | 10 | 5.0% |
| 50% or more | 1 | 0.5% |
The largest band is 0.5–1.99%, with 59 observations, closely followed by 2–4.99% with 55. In total, 103 reporters, or 51.8%, are below 2%. Only 11 observations reach 25% or more, and Nicaragua is the only one above 50%. The darkest map symbols therefore represent a narrow upper tail rather than the typical global reporter.
Economies outside the region can still source a meaningful share from these suppliers
The reporting universe is global; only the supplier group is restricted by region and income classification. That is why economies outside Latin America and the Caribbean can still record material shares. The United States is at 19.19%, Canada at 9.10%, China at 7.89%, Spain at 4.39%, and Portugal at 3.98%. These examples show that distance alone does not determine the indicator.
The percentage cannot tell us which commodities generated those links. Food, fuels, minerals, manufactured goods and intermediate inputs may play very different roles from one reporter to another. Nor does the series identify whether a particular firm, port or re-export hub explains an outlying share. Those are separate questions that require product codes, trade values and, ideally, a time series rather than a single aggregate ratio.
A high share is not the same thing as a large import bill
The distinction between share and scale can be illustrated with a simple example. If an economy imports $1 billion of merchandise in total and 40% comes from the partner group, the corresponding amount is about $400 million. If another economy imports $100 billion in total and the partner share is only 10%, its dollar purchases from the group would be about $10 billion. The second economy has the lower percentage but the much larger trade flow.
For the same reason, a high value is not inherently favorable or unfavorable. It can reflect strong regional supply links, but it may also indicate a more concentrated sourcing pattern. Questions about resilience, diversification or dependency require additional measures: absolute import values, product concentration, the number of major suppliers, and changes across several years. TM.VAL.MRCH.R3.ZS answers a narrower and more precise question about supplier composition.
Import shares and export shares describe opposite directions of the trade relationship
An import-share series asks where a reporter bought merchandise from. An export-share series asks where the reporter sold merchandise to. The same Latin American and Caribbean partner group can be important in one direction and much less important in the other. A reporter with a high sourcing share does not automatically have a high destination share for exports, because the two percentages use different trade flows and different denominators.
Looking at both directions can therefore prevent an overly simple interpretation of “trade dependence.” Strong purchasing links and strong sales links are separate dimensions. A fuller bilateral or regional picture would combine import shares, export shares, absolute values and product composition. The 2023 import map isolates only one of those dimensions, which makes it useful as long as the question is kept specific.
The 2023 snapshot should not be treated as a permanent supply-chain structure
These observations describe one year. A reporter may have maintained a similar sourcing mix for a decade, or its 2023 value may reflect a temporary change in commodity prices, a large one-off purchase, weaker imports from another region, freight costs or exchange-rate movements. The cross-section cannot distinguish persistent structure from a short-lived shift. A durable supply-chain assessment needs the same indicator across multiple years.
Long-run comparisons also need attention to classification. The partner group combines a World Bank region with World Bank income categories. If economies move between income groups over time, the set of partners represented by the label can change. Comparing 2023 reporters is straightforward because the same period definition is used across the cross-section, but a historical series should be read together with any classification changes rather than as a perfectly fixed basket.
The 18 source-missing rows remain missing rather than becoming zeros
Eighteen of the 217 source rows do not have a 2023 value. They are excluded from the rankings, mean, median, quartiles and distribution bands, and the map marks them as no data. Converting those rows to zero would falsely state that the reporting economy imported no merchandise from the partner group. It would also add artificial observations to the bottom of the distribution and distort the statistical summary.
World Bank metadata states that this indicator is computed only when at least half of the economies in the partner group have non-missing data. A reported percentage therefore reflects a minimum partner-data condition. A missing row should be interpreted as unavailable for this annual comparison, not as a measured 0% sourcing share.
Source and calculation method
The analysis uses the 2023 observations for World Bank indicator TM.VAL.MRCH.R3.ZS. World Bank metadata defines the numerator as merchandise imports by the reporting economy from low- and middle-income economies in Latin America and the Caribbean, and the denominator as the reporting economy’s total merchandise imports. The listed sources are World Bank staff estimates and the IMF Direction of Trade database. The World Bank metadata entry also states the partner-data coverage rule.
Maximums, minimums, rankings, the mean, median, quartiles and band counts above are calculated directly from the 199 non-missing 2023 observations. The World Bank reporting universe includes countries as well as separately reported economies and territories, so the 217 rows should not be interpreted as 217 sovereign states. The map assigns representative geographic positions to all 217 rows, colors the reported values by percentage band, and keeps the 18 missing rows visually separate.
Frequently Asked Questions
What does this merchandise-import share measure?
It is the percentage of each reporting economy’s total merchandise imports that came from partners classified by the World Bank as low- and middle-income economies in Latin America and the Caribbean.
Does Nicaragua’s 50.79% mean it had the largest import value?
No. The figure is a share of Nicaragua’s own total merchandise imports, not a ranking of dollar import values. Absolute trade values are needed to compare market size.
Are the 18 missing 2023 observations equal to zero?
No. They are source-missing observations, not measured zeros, and they are excluded from the rankings and summary statistics.
Related Articles
- Merchandise export shares sent to low- and middle-income Latin America and the Caribbean
- Merchandise export shares sent to low- and middle-income Sub-Saharan Africa
- Merchandise export shares sent to low- and middle-income South Asia
Green Map creates custom-edited map images using open geographic data sources such as geoBoundaries, Natural Earth, OpenStreetMap, and government open data.
These maps are edited visual materials, not raw data files, and are provided for education, documents, presentations, and graphic reference.