Countries differ sharply in how much of their merchandise exports are directed to low- and middle-income economies in Sub-Saharan Africa. This analysis uses the 2023 World Bank series TX.VAL.MRCH.R6.ZS. The source table contains 217 country and economy rows: 197 have a reported 2023 value and 20 are source-missing.
The numerator is merchandise exports from the reporting economy to low- and middle-income economies in Sub-Saharan Africa under the World Bank classification. The denominator is the reporting economy’s total merchandise exports. A high value therefore means that this destination group accounts for a large share of exports; it does not mean the reporting economy has the world’s largest export value. World Bank metadata says the indicator is computed only when at least half of the economies in the partner group have non-missing data.
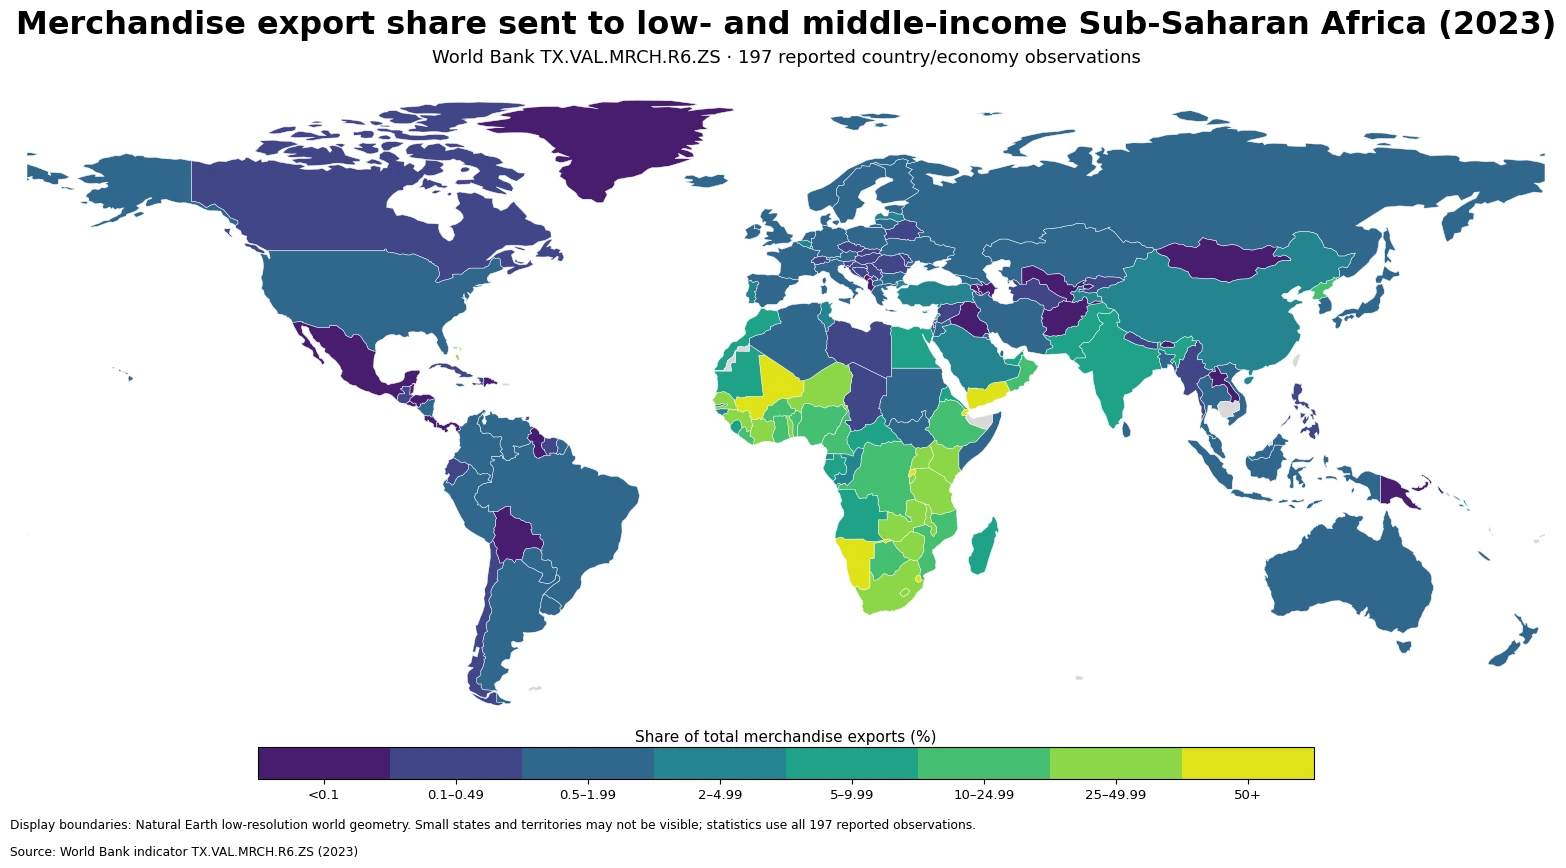
Table of Contents
The indicator measures destination share, not export value
A value of 40% means that roughly 40 dollars out of every 100 dollars of merchandise exports from the reporting economy went to the defined low- and middle-income Sub-Saharan African destination group. A value of 1% means roughly one dollar out of every 100. Two economies can both report 40% while having radically different total export values, so their actual dollar exports to the destination group can also be very different.
This makes the series useful for reading trade orientation and the composition of export destinations. It is not the right series for asking which economy exported the largest absolute amount to Sub-Saharan Africa. That question requires a value series, such as merchandise exports to the same partner group measured in current U.S. dollars.
Eswatini and Djibouti were above 80% in 2023
Among the 197 reported observations, Eswatini is highest at 90.44%, followed by Djibouti at 85.59%. Dominica is next at 70.61%, Rwanda at 60.05% and Mali at 57.10%. The upper end contains several economies in Southern, Eastern and Western Africa, but it also includes reporting economies outside Sub-Saharan Africa, including Yemen and Dominica.
| Top rank | Country/economy | Export share | Bottom rank | Country/economy | Export share |
|---|---|---|---|---|---|
| 1 | Eswatini | 90.44% | 1 | Aruba | 0.002% |
| 2 | Djibouti | 85.59% | 2 | Panama | 0.002% |
| 3 | Dominica | 70.61% | 3 | Armenia | 0.004% |
| 4 | Rwanda | 60.05% | 4 | Macao SAR, China | 0.006% |
| 5 | Mali | 57.10% | 5 | Azerbaijan | 0.006% |
| 6 | Namibia | 55.35% | 6 | Papua New Guinea | 0.006% |
| 7 | Yemen, Rep. | 52.53% | 7 | Bhutan | 0.008% |
| 8 | Togo | 48.86% | 8 | Mongolia | 0.009% |
| 9 | Senegal | 45.19% | 9 | Lao PDR | 0.014% |
| 10 | Burundi | 42.58% | 10 | Greenland | 0.020% |
At the bottom, every value in the table is below 0.03%. Aruba and Panama are both close to 0.002%, while Armenia is around 0.004%. The distance between the bottom and top of the distribution is so large that the arithmetic mean is not a good description of a typical reporting economy by itself.
The median is 1.21%, far below the 8.21% mean
The median across the 197 reported values is 1.21%, while the mean is 8.21%. The first quartile is 0.36% and the third quartile is 6.89%, placing the middle half of observations between roughly 0.36% and 6.89%. The large gap between the mean and median reflects a long upper tail formed by a relatively small number of economies with shares above 25%, 50% and even 80%.
| Share of total merchandise exports | Number of observations | Share of 197 |
|---|---|---|
| Below 0.1% | 25 | 12.7% |
| 0.1–0.49% | 34 | 17.3% |
| 0.5–1.99% | 65 | 33.0% |
| 2–4.99% | 16 | 8.1% |
| 5–9.99% | 16 | 8.1% |
| 10–24.99% | 17 | 8.6% |
| 25–49.99% | 17 | 8.6% |
| 50% or more | 7 | 3.6% |
The largest band is 0.5–1.99%, containing 65 economies, or 33.0% of the reported sample. Another 59 observations, 29.9%, are below 0.5%. At the other end, 24 economies are at 25% or more and only seven exceed 50%. The map therefore highlights a small set of very high shares against a much larger group clustered below 2%.
High shares cluster across parts of Africa, but the outliers matter
The 25%-and-above bands form visible clusters across parts of Southern, Eastern and Western Africa. Economies such as Eswatini, Namibia, Rwanda, Mali, Togo, Senegal and Burundi all appear near the upper end. Descriptively, this shows that the defined destination group occupies a relatively large place in the export portfolios of many reporting economies within Africa.
Geographic proximity does not fully explain the pattern. Dominica is above 70% and Yemen is above 50%, while some African reporting economies remain in single digits. The indicator does not identify the commodity mix, the role of individual firms, re-exports or the effect of particular contracts. Those mechanisms should not be inferred from this percentage alone.
A 90% share does not mean the largest export market in dollars
The denominator is the key interpretive constraint. An economy with a relatively small total merchandise-export base can record a high share even if its dollar exports to the destination group are modest. Conversely, a very large exporter can ship a substantial dollar amount to low- and middle-income Sub-Saharan Africa while the destination still accounts for only a small percentage of its total exports.
For that reason, TX.VAL.MRCH.R6.ZS is a trade-orientation indicator rather than a direct measure of export scale or competitiveness. A high share is not automatically good or bad. It may indicate strong commercial links with the destination group, but judging diversification, concentration risk or market performance requires commodity detail, absolute values and a longer time series.
One year cannot establish a long-run trade structure
The 2023 map is a cross-section of destination shares. It cannot tell whether a high share has persisted for many years or appeared temporarily in 2023. Assessing durable market concentration or export diversification requires comparing the same indicator across multiple years and checking whether the ranking and shares remain stable.
Because the ratio is based on export values, changes in commodity prices and the composition of exports can also move the percentage. Physical shipment volumes do not have to change in the same proportion. The 2023 figure is therefore a precise measure of value-based destination share for that year, not a direct measure of trade volume or a diagnosis of the forces behind the pattern.
Twenty missing observations are not zeros
Twenty of the 217 source rows have no 2023 value. They are excluded from rankings, the mean, median, quartiles and distribution counts, and they are shown as no data on the map. Replacing them with zero would falsely imply that the reporting economy sent no merchandise exports to the destination group and would distort both the geography and the statistical distribution.
Using the low-resolution Natural Earth world layer, 165 of the 197 reported observations can be displayed as country polygons after ISO3 matching. Small island states, territories and places absent from the low-resolution geometry can remain in the statistical analysis even when they are not visible on the world map. Cartographic coverage therefore should not be confused with the number of observations used in the calculations.
Data source and calculation
The analysis uses 2023 observations from the World Bank API for TX.VAL.MRCH.R6.ZS. The World Bank metadata glossary describes the annual series as World Bank staff estimates using IMF Direction of Trade data.
All maxima, minima, rankings, averages, quartiles and band counts are calculated directly from the 197 non-missing 2023 observations. The destination group follows the World Bank classification of low- and middle-income economies in Sub-Saharan Africa, and the indicator is computed only when at least half of the partner economies have non-missing data. The 20 source-missing rows are never imputed.
Frequently Asked Questions
What does this merchandise-export share measure?
It is the percentage of a reporting economy's total merchandise exports that go to low- and middle-income economies in Sub-Saharan Africa under the World Bank classification.
Does a high share mean the economy exports the largest dollar amount?
No. The metric is a percentage of the reporting economy's own total merchandise exports. A smaller exporter can have a high share, while a much larger exporter can have a low share despite shipping more dollars in absolute terms.
Should missing 2023 observations be treated as zero?
No. Twenty source rows have no 2023 value. They remain missing and are excluded from rankings and distribution calculations rather than being converted to zero.
Related Maps
Green Map creates custom-edited map images using open geographic data sources such as geoBoundaries, Natural Earth, OpenStreetMap, and government open data.
These maps are edited visual materials, not raw data files, and are provided for education, documents, presentations, and graphic reference.