Domestic private health spending per person varies by orders of magnitude across countries. The World Bank latest-observation table contains 193 countries and areas, but the rows do not all refer to the same year. To avoid presenting a mixed-year table as a 2024 world ranking, the main map and rankings here use the 184 observations dated 2023. Across that synchronized subset, the unweighted median is $136.77 per person, the simple mean is $399.22, and values run from $1.06 to $7,885.33.
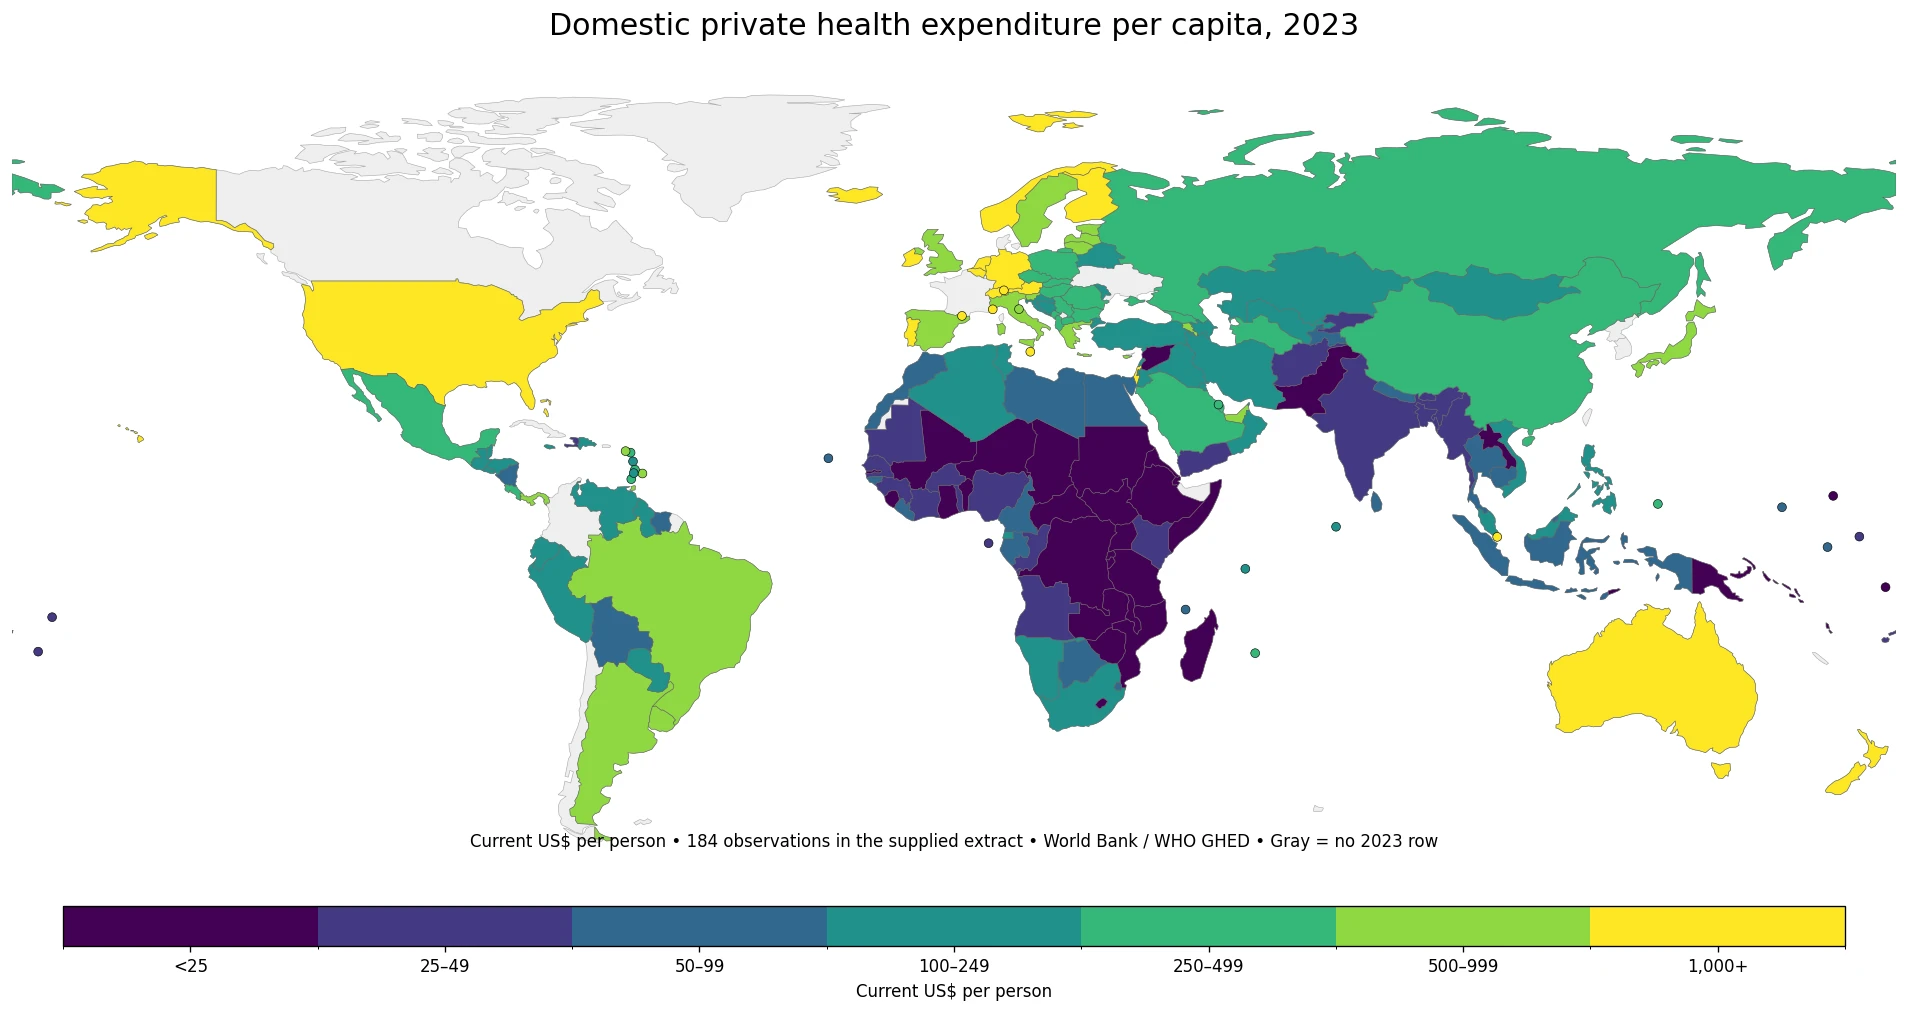
Table of Contents
What counts as domestic private health expenditure?
The World Bank indicator SH.XPD.PVTD.PC.CD is titled “Domestic private health expenditure per capita (current US$).” The underlying source is the WHO Global Health Expenditure Database. In the WHO indicator metadata, domestic private sources include revenues from households, corporations and nonprofit organizations. They can be prepaid through private financing arrangements or paid directly to health-care providers. The indicator divides domestic private current health expenditure by population and expresses the result in US dollars.
That definition is broader than out-of-pocket spending. A patient’s direct payment at the point of care is one component of private domestic financing, but voluntary private insurance and other private prepayment can also contribute. The per-capita figure is also an aggregate divided by total population. It does not mean that every resident personally paid the published amount, and it should not be read as a typical medical bill for an individual household.
The 2023 median is $136.77, but the mean is $399.22
Giving each of the 184 geographic observations equal weight produces a 2023 median of $136.77 and a simple mean of $399.22. The first quartile is $40.86 and the third quartile is $394.66. The mean is about 2.9 times the median because a small set of very large observations stretches the upper tail. These are descriptive statistics across country and area rows, not a population-weighted global estimate of what the average person spent.
| Domestic private health spending per person, 2023 | Countries/areas |
|---|---|
| Below $25 | 34 |
| $25 to under $50 | 23 |
| $50 to under $100 | 23 |
| $100 to under $250 | 39 |
| $250 to under $500 | 24 |
| $500 to under $1,000 | 21 |
| $1,000 or more | 20 |
Eighty of the 184 observations are below $100, while 20 are at least $1,000. That wide spread is why a map and broad value bands are more informative than a single average. Current-US-dollar values also combine differences in the amount of health care financed privately with differences in health-service prices and currency conversion, so small rank gaps should not be treated as precise measures of underlying health-system performance.
Switzerland and the United States stand far above the rest in 2023
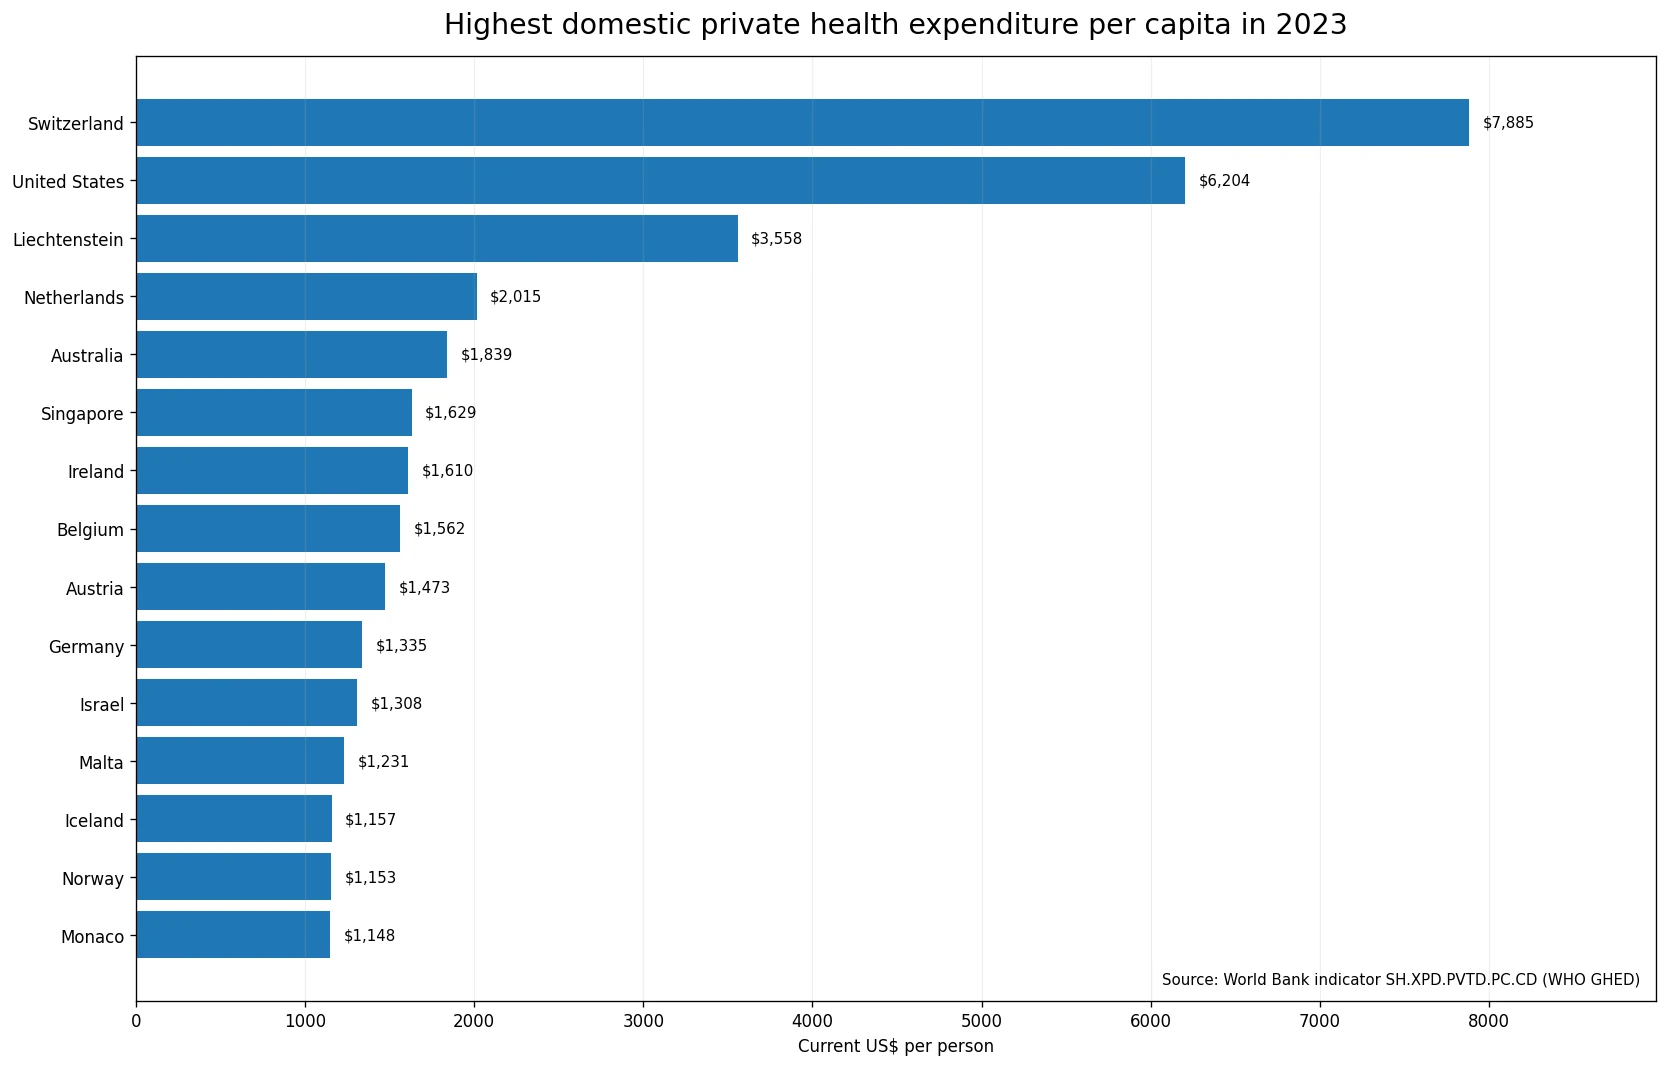
Switzerland has the highest 2023 observation at $7,885.33 per person, followed by the United States at $6,203.90. Liechtenstein is next at $3,558.30, while the Netherlands is $2,014.86 and Australia $1,838.57. Singapore is $1,629.01, Ireland $1,609.89, Belgium $1,561.78, Austria $1,472.87 and Germany $1,335.36. Israel, Malta, Iceland, Norway and Monaco also exceed $1,100 per person.
At the other end, Tuvalu records $1.06, Solomon Islands $3.58, Madagascar $5.76, Somalia $7.03 and Papua New Guinea $7.28 in the 2023 subset. A low dollar figure should not be simplified into a claim that households face little financial pressure. The measure describes the nominal dollar scale of all domestic private health financing per person, not the affordability of care, the share paid directly by households, service availability or financial protection.
The map shows large regional contrasts, but also sharp differences within regions
Several Western European observations sit in the upper bands, but Europe is not uniform. Portugal is $1,063.28, the United Kingdom $985.21, Greece $963.63, Italy $884.02 and Spain $833.08. Farther east, Bulgaria is $461.29, Czechia $418.28, Hungary $378.16, Poland $360.25 and Romania $253.67. The range inside Europe is therefore substantial even before the extreme values in Switzerland and Liechtenstein are considered.
East and South Asia also span a broad range. Japan is $552.08 and China $327.47, while Malaysia is $225.03 and Mongolia $184.28. The Philippines is $111.62, Viet Nam $107.57, Thailand $71.90, Indonesia $60.39, India $49.59, Bangladesh $43.85 and Pakistan $16.65. In Sub-Saharan Africa, South Africa is $194.94 and Namibia $119.55, but Kenya is $29.70, Ghana $19.84, Ethiopia $17.82, Uganda $15.43, Tanzania $10.50, Rwanda $8.41 and Madagascar $5.76.
These geographic patterns are descriptive rather than causal. Income, health-care prices, insurance arrangements, the balance between prepayment and direct payment, exchange rates and service use may all matter, but none of those mechanisms can be isolated from this one series alone. The map is best used to identify where the per-person dollar scale of domestic private health financing is high or low, then paired with other indicators when the question shifts to explanation or policy evaluation.
Seven countries have 2024 latest values and are kept out of the 2023 ranking
The newest year in the supplied metadata is 2024, but that does not make all 193 observations 2024 data. The table contains 184 rows dated 2023, seven dated 2024, one 2021 observation for Ukraine and one 2020 observation for Cuba. Treating all 193 as a single 2024 cross-section would therefore misstate the evidence. The synchronized map and rankings use only the 184 rows actually dated 2023.
| Country with a 2024 latest observation | Domestic private health spending per person |
|---|---|
| Canada | $1,901.11 |
| France | $1,682.00 |
| Republic of Korea | $1,361.18 |
| Denmark | $1,117.38 |
| Luxembourg | $967.30 |
| Chile | $905.91 |
| Colombia | $194.79 |
The latest Korean observation, for example, is $1,361.18 in 2024, so it is not inserted into the 2023 ranking. The same treatment is applied to Canada, France, Denmark, Luxembourg, Chile and Colombia. Having a newer latest value and being eligible for a same-year comparison are different questions; keeping them separate prevents a one-year update from silently changing the reference period of the entire map.
Current US dollars require an exchange-rate and price caveat
The unit is current US dollars, not purchasing-power-parity dollars and not a constant-price series. Nominal health spending is converted into US dollars for the observation year, so cross-country differences can reflect exchange rates and price levels in addition to the amount of health care financed through private domestic sources. Over time, a change in the dollar value can also reflect currency movements or price inflation rather than only a change in service use or financing arrangements.
A companion percentage indicator answers a different question: what share of current health expenditure comes from domestic private sources? That measure describes the financing mix rather than the absolute per-person scale. Out-of-pocket indicators are narrower again because they isolate direct household payments. Reading the per-capita amount, the private share of current health expenditure and out-of-pocket measures together gives a more complete picture than treating any one of them as a health-system score.
Source and calculation method
The statistical series is World Bank World Development Indicators SH.XPD.PVTD.PC.CD, sourced from the WHO Global Health Expenditure Database. The World Bank latest-observation extract contains 193 rows. All 2023 summary statistics, band counts and rankings on this page are calculated directly from the 184 rows whose observation year is 2023. Missing values are not replaced with zero.
For the map, ISO-3 country codes are joined to a low-resolution world boundary layer. Of the 184 synchronized observations, 156 match country polygons directly and 28 small countries or areas are plotted as point markers so that every 2023 statistical row is represented visually. The map should be read as a geographic view of the dollar scale of domestic private health financing, not as a measure of quality, access, equity, efficiency or household financial hardship. Those questions require additional indicators.
Frequently Asked Questions
What is included in domestic private health expenditure?
It includes current health expenditure financed from domestic private sources such as households, corporations and nonprofit organizations, including relevant prepaid private financing and direct payments to providers.
Is domestic private health expenditure the same as out-of-pocket spending?
No. Out-of-pocket payments are one component. Domestic private financing can also include voluntary private insurance and other private prepayment.
Why are all 193 latest observations not treated as 2024 data?
Because 184 rows are dated 2023, seven are from 2024, Ukraine is from 2021 and Cuba is from 2020. Same-year rankings therefore use only the observations actually dated 2023.
Does a higher value mean a worse health system?
No. The indicator measures the current-US-dollar amount of domestic private health expenditure per person. It does not directly measure quality, access, financial protection or health outcomes.
Related Articles
- Domestic private health expenditure as a share of current health expenditure
- Out-of-pocket health spending and relative poverty
- Domestic government health expenditure as a share of current health expenditure
Green Map creates custom-edited map images using open geographic data sources such as geoBoundaries, Natural Earth, OpenStreetMap, and government open data.
These maps are edited visual materials, not raw data files, and are provided for education, documents, presentations, and graphic reference.