Youth unemployment varies enormously across the countries and economies that report a 2025 value in the World Bank series SL.UEM.1524.ZS. Among the 182 non-missing observations, Djibouti records the highest rate at 76.77%, while Niger has the lowest at 0.46%. The median is 12.83%, meaning half of the reporting economies are above that level and half are below it.
The denominator matters. A youth unemployment rate of 20% does not mean that one in five people aged 15–24 is unemployed. It means that unemployed people make up 20% of the youth labor force, which consists of employed and unemployed people aged 15–24. Young people who are outside the labor force, such as many full-time students or people who are not seeking work, are not included in that denominator.
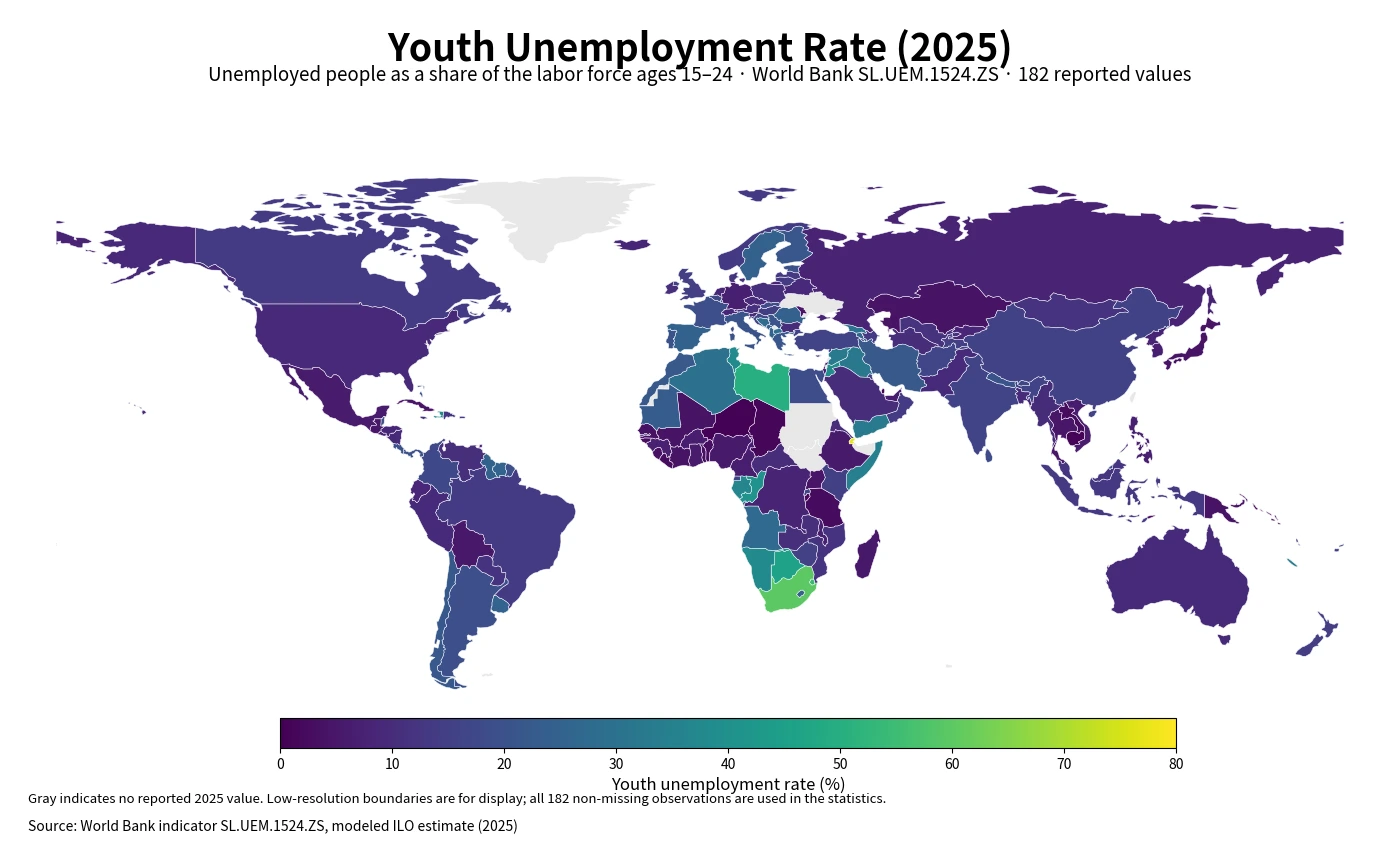
Table of Contents
The gap between the highest and lowest rates is exceptionally wide
The difference between the maximum and minimum 2025 observations is about 76.31 percentage points. Djibouti, South Africa, Eswatini, Libya, and Botswana occupy the top five positions. Several economies in Southern Africa, North Africa, and the Middle East also report high values, while a few Caribbean and Pacific economies appear near the upper end of the distribution. The pattern is not uniform within any one region, so geography alone does not explain the differences.
Niger, Qatar, and Cambodia are all below 1%, followed by Chad and Burundi at under 2%. Very low unemployment should not automatically be interpreted as exceptionally strong youth labor-market outcomes. Low labor-force participation, widespread informal work, subsistence activities, or differences in how young people move between education and work can all affect how many people are counted as unemployed rather than outside the labor force.
Top and bottom 10 reported rates in 2025
| High rank | Country/economy | Rate | Low rank | Country/economy | Rate |
|---|---|---|---|---|---|
| 1 | Djibouti | 76.77% | 1 | Niger | 0.46% |
| 2 | South Africa | 59.93% | 2 | Qatar | 0.56% |
| 3 | Eswatini | 54.33% | 3 | Cambodia | 0.71% |
| 4 | Libya | 50.06% | 4 | Chad | 1.46% |
| 5 | Botswana | 46.00% | 5 | Burundi | 1.68% |
| 6 | St. Vincent and the Grenadines | 41.95% | 6 | Liberia | 2.30% |
| 7 | Congo, Rep. | 40.50% | 7 | Tanzania | 2.38% |
| 8 | Jordan | 38.88% | 8 | Lao PDR | 2.38% |
| 9 | Tunisia | 38.08% | 9 | Solomon Islands | 2.76% |
| 10 | Namibia | 38.05% | 10 | Guinea-Bissau | 2.84% |
Djibouti’s 76.77% is the most extreme value in the dataset, followed by South Africa at 59.93%, Eswatini at 54.33%, and Libya at 50.06%. At the other end, Niger is at 0.46%, Qatar at 0.56%, and Cambodia at 0.71%. Because the tails are so far apart, a single average cannot describe what a typical reporting economy looks like.
The median is 12.83%, below the 15.51% average
Across the 182 reported values, the mean is 15.51% and the median is 12.83%. The first quartile is 7.66% and the third quartile is 20.24%, so the middle half of observations lies between roughly 7.66% and 20.24%. The mean is about 2.68 percentage points above the median because a relatively small set of rates above 30%, 40%, and 50% stretches the upper tail.
| Youth unemployment band | Countries/economies | Share of 182 |
|---|---|---|
| Below 5% | 25 | 13.7% |
| 5% to under 10% | 45 | 24.7% |
| 10% to under 15% | 37 | 20.3% |
| 15% to under 20% | 28 | 15.4% |
| 20% to under 25% | 19 | 10.4% |
| 25% to under 30% | 9 | 4.9% |
| 30% to under 40% | 12 | 6.6% |
| 40% or more | 7 | 3.8% |
The largest band is 5% to under 10%, with 45 observations, or 24.7% of the reported total. Another 37 economies fall between 10% and 15%. At the high end, 19 observations are at least 30%, including 7 at 40% or more. The global distribution therefore combines a large middle group with a much smaller but pronounced high-unemployment tail.
Youth unemployment is not the share of all young people without jobs
This distinction is essential when comparing countries. The unemployment-rate denominator excludes young people who are neither employed nor actively participating in the labor market. A country can therefore have a low youth unemployment rate while also having many young people outside the labor force. Conversely, a country with high participation may have more young people actively searching for work and therefore a higher measured unemployment rate.
For a broader picture, youth unemployment can be read alongside the employment-to-population ratio, labor-force participation rate, and the share of young people not in employment, education, or training. Those measures answer different questions. Combining them helps separate the problem of unsuccessful job search from the separate issue of young people not entering the labor market at all.
What the modeled ILO estimate is designed to do
The World Bank label identifies this series as a modeled ILO estimate. National labor-market statistics can differ in survey timing, coverage, labor-force definitions, and data availability. The modeled series is intended to provide a more comparable cross-country measure by harmonizing information within the ILO statistical framework. That makes it useful for a world comparison such as this one.
The same feature also means the number may not exactly match a national statistical office’s latest monthly or quarterly youth unemployment release. A national publication may use a different reference period, seasonal adjustment, survey design, or revision schedule. When comparing a World Bank modeled estimate with a domestic headline figure, the definition and reference date should be checked before interpreting the difference.
A high rate does not identify a single cause
Youth unemployment can be associated with many conditions, including weak job creation, economic slowdowns, the speed of school-to-work transitions, sectoral structure, hiring practices, and geographic mismatches between workers and jobs. This dataset provides a 2025 rate for each reporting economy; it does not identify which factor caused a particular country to be high or low. Countries with similar rates may have very different underlying labor markets.
Young workers can be especially exposed to changes in hiring because they often have shorter job tenure and less work experience. In other settings, informal or family-based work may absorb young people who would otherwise appear as unemployed. These differences are one reason unemployment should not be treated as a complete measure of job quality or economic security. Wage levels, working hours, formality, and stability require additional data.
Thirty-five economies have no 2025 value in the source table
The source file contains 217 country and economy rows, but only 182 have a reported 2025 value; the remaining 35 are missing. Missing observations are not converted to zero. A zero unemployment rate and the absence of data are completely different conditions, so the map uses gray for no data and all descriptive statistics exclude those 35 rows.
The map geometry has another limitation. The low-resolution world boundary layer contains 163 polygons that can be matched directly to a non-missing 2025 value by ISO3 code. Small islands and territories may be absent or too small to see at this scale. The rankings, mean, median, quartiles, and distribution bands nevertheless use all 182 reported observations, not only the places visible as colored polygons.
A single year does not show whether unemployment is improving
This analysis is a cross-section of 2025. A country at 20% could have improved sharply from a much higher rate, or it could have deteriorated from a lower rate. The current ranking cannot distinguish those paths. A trend analysis needs multiple years of the same indicator, preferably with attention to breaks in methods or unusual shocks that may affect comparability over time.
The rate can also change because the labor-force denominator changes. If discouraged job seekers stop looking for work and leave the labor force, unemployment may fall even without a comparable increase in employment. If more young people begin looking for work, unemployment can temporarily rise even while labor-market participation strengthens. Understanding change therefore requires looking at unemployed, employed, and labor-force counts together.
Data source and calculation
The analysis uses 2025 values from the World Bank API series SL.UEM.1524.ZS. The World Bank indicator page provides the country series and indicator information. The unit is unemployed people as a percentage of the total labor force ages 15–24, and the series is labeled as a modeled ILO estimate.
Of the 217 rows in the source table, 182 contain a 2025 value and 35 are missing. No missing value is replaced with zero or with a value from another year. Rankings, mean, median, quartiles, minimum, maximum, and distribution bands are calculated directly from the 182 reported values. A separate low-resolution boundary layer is used only to draw the map, so map visibility does not determine whether an observation is included in the statistics.
Frequently Asked Questions
Does a 20% youth unemployment rate mean one in five young people is unemployed?
No. The denominator is the labor force ages 15–24, not the entire youth population. Young people outside the labor force are not included.
Does a low youth unemployment rate always mean strong youth employment conditions?
No. Labor-force participation, informal work, employment quality, and the employment-to-population ratio can change the interpretation.
Were countries with no 2025 value treated as 0%?
No. The 35 missing observations remain missing, and all statistics are calculated from the 182 economies with an actual 2025 value.
Related Maps
Green Map creates custom-edited map images using open geographic data sources such as geoBoundaries, Natural Earth, OpenStreetMap, and government open data.
These maps are edited visual materials, not raw data files, and are provided for education, documents, presentations, and graphic reference.