Municipality populations in Norway vary enormously even though every row represents the same administrative level. Using Statistics Norway (SSB) Statbank observations for 1 January 2026, the 357 named municipalities range from 728,714 residents in Oslo – Oslove to 219 in Utsira. Looking at the full distribution rather than only the largest places makes the scale difference much easier to understand.
The SSB table contains 358 entries for the 2026 reference date, but one entry is labelled `Unknown municipality` and has a value of zero. Because it does not identify a specific municipality, it is excluded from the public ranking, concentration calculations and the 357-municipality total. All 357 named municipalities have a 2026 value and none is missing.
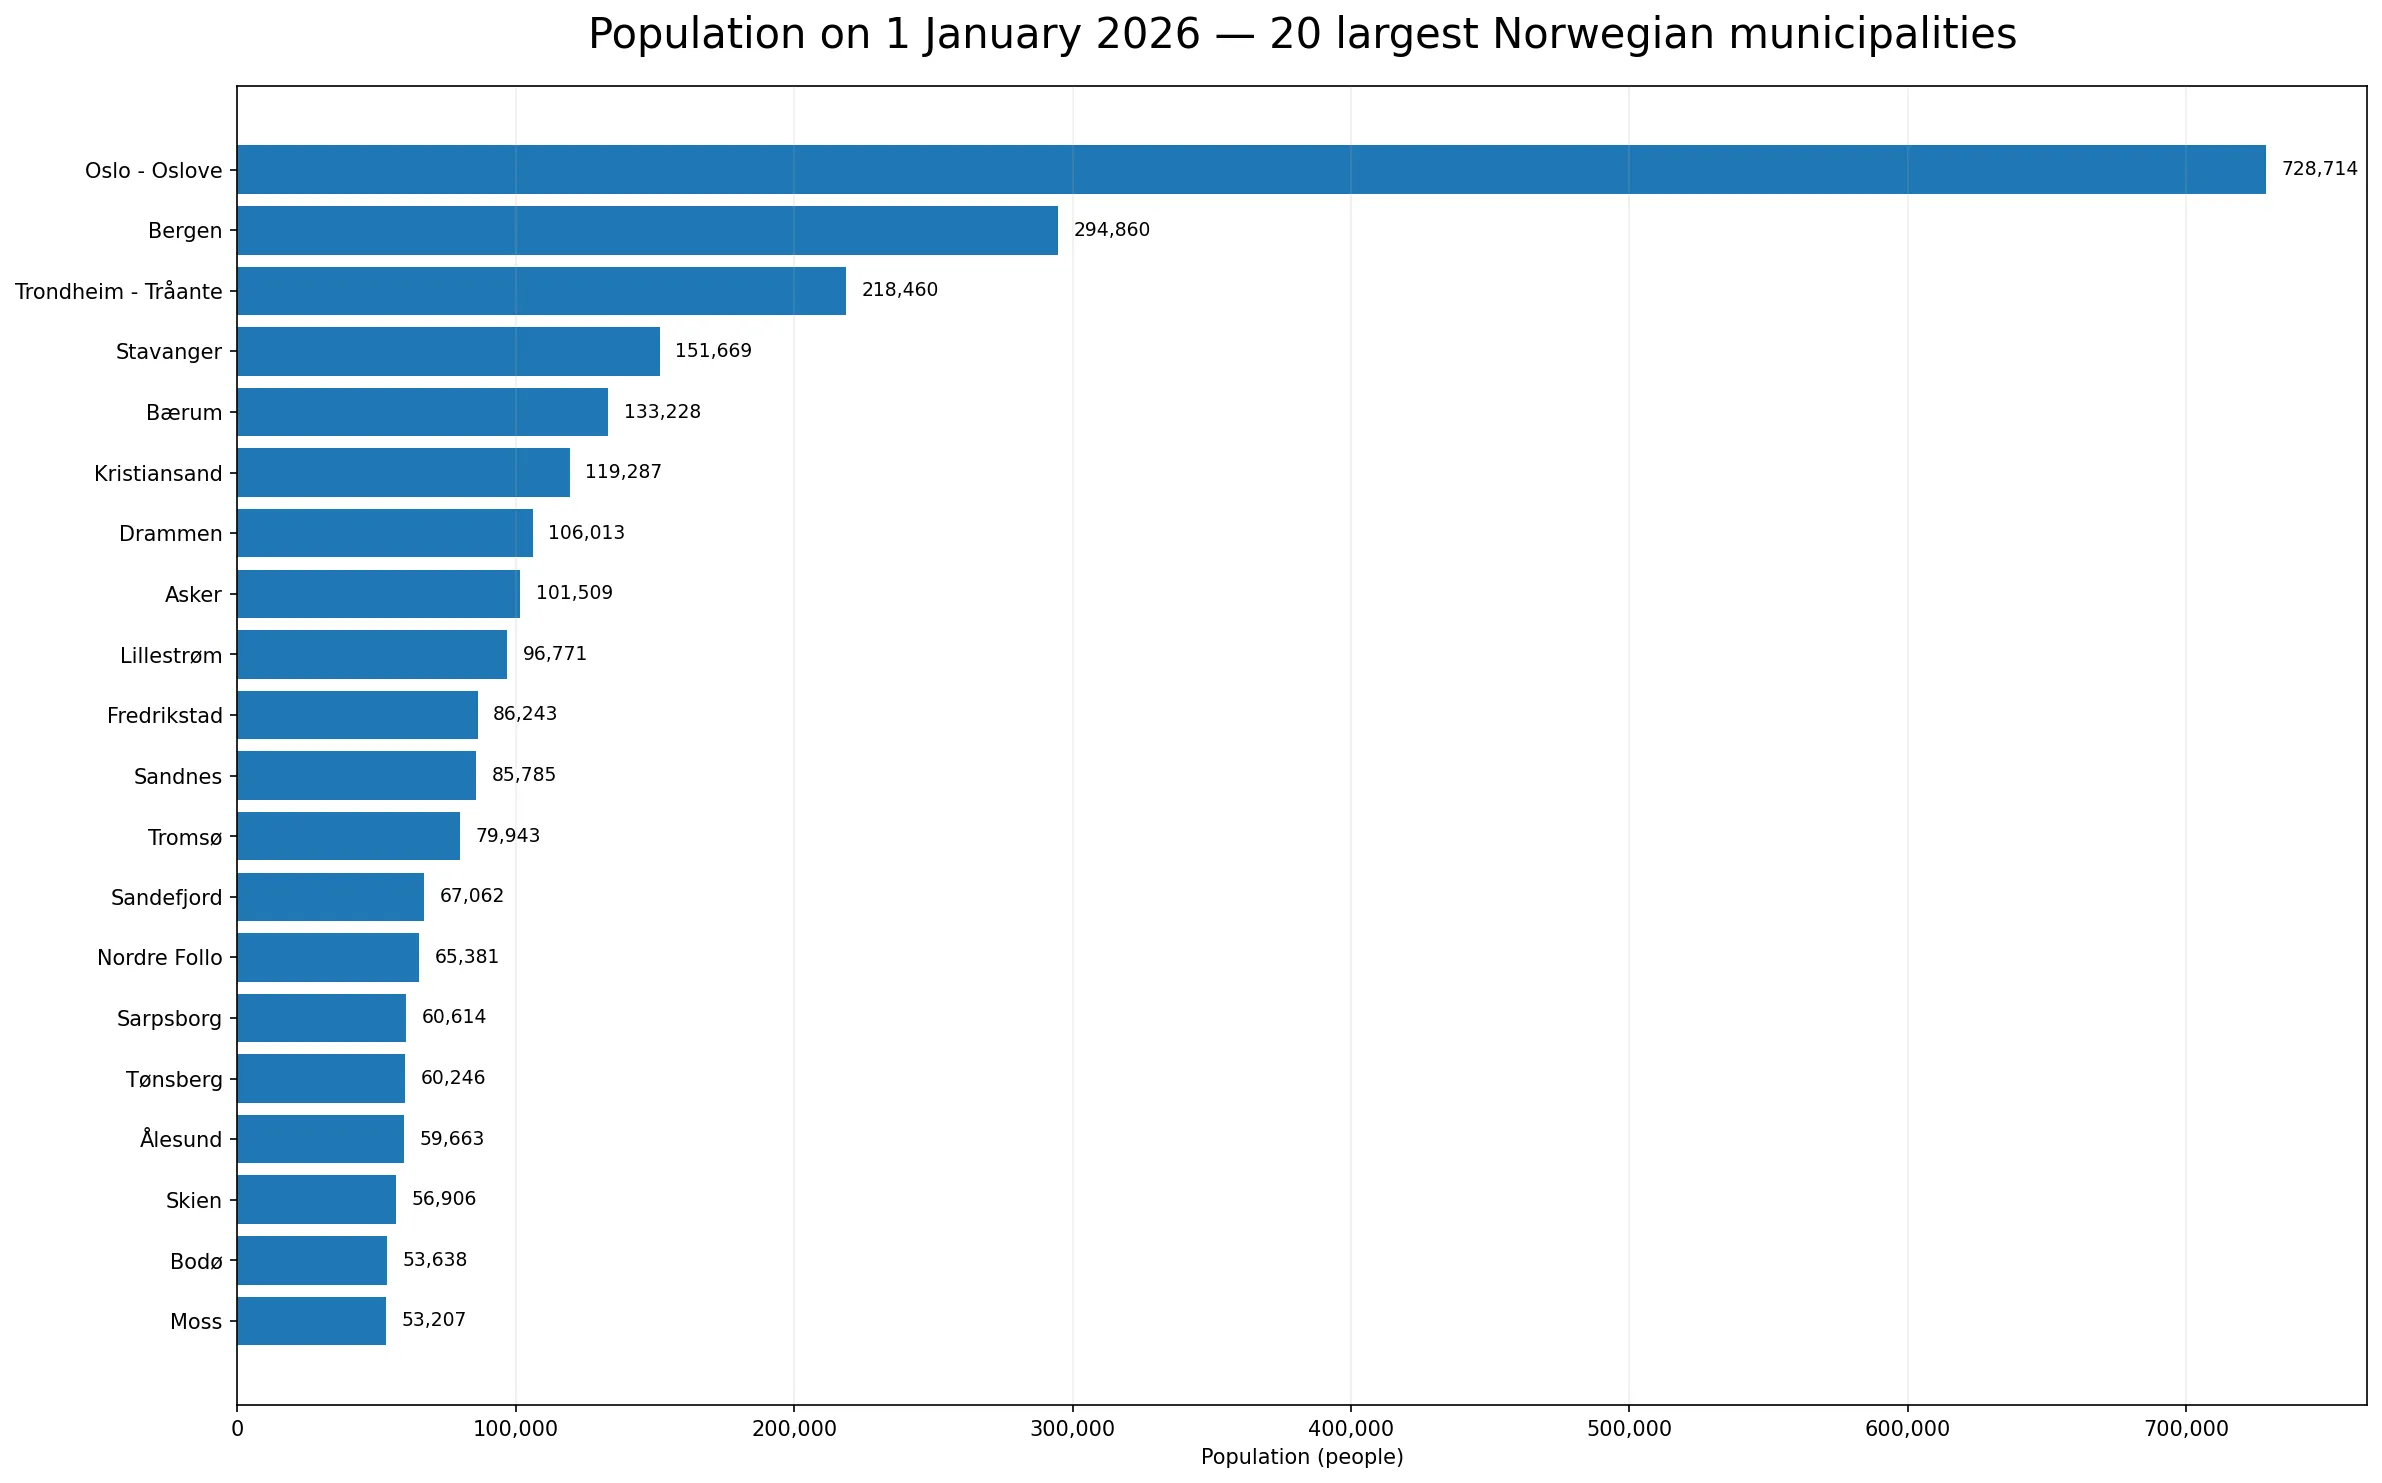
Table of Contents
What the 2026 municipality distribution shows
The 357 named municipality observations sum to 5,627,400 people. The simple mean is 15,763, but the median is only 5,447. That large gap is a sign of a strongly right-skewed distribution: a relatively small number of large urban municipalities pull the arithmetic average far above the value that divides the municipalities into two equal groups.
The first quartile is 2,242 and the third quartile is 13,612, so the middle half of municipalities sits between roughly 2,242 and 13,612 residents. Only 8 municipalities have at least 100,000 residents and 21 have at least 50,000. At the other end, 174 have fewer than 5,000 residents and 76 have fewer than 2,000.
| Municipality | Population | Share of 357-municipality total |
|---|---|---|
| Oslo – Oslove | 728,714 | 12.95% |
| Bergen | 294,860 | 5.24% |
| Trondheim – Tråante | 218,460 | 3.88% |
| Stavanger | 151,669 | 2.70% |
| Bærum | 133,228 | 2.37% |
| Kristiansand | 119,287 | 2.12% |
| Drammen | 106,013 | 1.88% |
| Asker | 101,509 | 1.80% |
| Lillestrøm | 96,771 | 1.72% |
| Fredrikstad | 86,243 | 1.53% |
| Sandnes | 85,785 | 1.52% |
| Tromsø | 79,943 | 1.42% |
| Sandefjord | 67,062 | 1.19% |
| Nordre Follo | 65,381 | 1.16% |
| Sarpsborg | 60,614 | 1.08% |
The largest municipalities
Oslo – Oslove is by far the largest municipality in the extract at 728,714 residents. Bergen follows at 294,860 and Trondheim – Tråante at 218,460. Stavanger has 151,669 residents and Bærum 133,228. Kristiansand, Drammen and Asker also exceed 100,000, while Lillestrøm and Fredrikstad sit just below that threshold.
The three largest municipalities contain 22.07% of the 357-municipality total. The top five account for 27.13%, the top ten for 36.19%, and the top twenty for 47.61%. Those twenty places represent only about 5.6% of the municipality count but contain almost half of the population represented by the named municipality rows.
Why the median is much lower than the mean
A mean of about 15,763 can give a misleading impression if it is read without the median. Half of the municipalities have 5,447 residents or fewer, while Oslo – Oslove alone has well over one hundred times the median municipality population. A few very large observations therefore have a substantial effect on the average.
For a skewed administrative distribution like this, the median and quartiles help describe a more typical scale, while the mean is still useful for arithmetic comparisons. Concentration shares add another perspective because they show how much of the total is held by the largest units. None of these measures should be treated as a complete description of settlement, because municipality land areas and internal urban patterns can differ greatly.
Many municipalities have very small populations
At the lower end, Utsira has 219 residents, Modalen 397, Raarvihke – Røyrvik 439, Træna 443 and Røst 471. Vevelstad has 477, Fedje 529, Kvitsøy 579 and Leka 596. These are not data gaps: they are reported population values for named municipalities in the extract.
| Municipality | Population |
|---|---|
| Utsira | 219 |
| Modalen | 397 |
| Raarvihke – Røyrvik | 439 |
| Træna | 443 |
| Røst | 471 |
| Vevelstad | 477 |
| Fedje | 529 |
| Kvitsøy | 579 |
| Leka | 596 |
| Værøy | 656 |
| Solund | 742 |
| Tydal | 773 |
A low population count is not a judgment about the importance, prosperity or viability of a municipality. Population is simply the number of residents within the administrative boundary. Geographic area, remoteness, island location, travel time, economic activity, seasonal visitors and the cost of providing services are separate dimensions that require separate evidence.
Population size is not population density
This dataset measures an absolute number of people. Population density needs an additional denominator, usually land area. A municipality can have a large population and still have moderate density if it covers a large area, while a compact municipality with fewer residents can be densely settled. Mixing the two measures would blur two distinct questions: how many people live in an administrative unit, and how tightly those people are spatially concentrated.
The same principle applies to comparisons involving housing, employment or public services. An absolute count is often affected by population size. A per-capita rate can reveal a different pattern, but it answers a different question. The 2026 population figures are therefore best understood as a baseline denominator that can support later analysis rather than as a standalone measure of economic or social performance.
What a single-date population snapshot can and cannot answer
The 1 January 2026 observations answer questions about relative municipality scale at one point in time. They show which municipalities contain the most residents, how unequal the distribution is, how many municipalities fall below particular population thresholds, and how concentrated the represented population is among the largest units.
They do not show which municipality is growing fastest. Growth requires at least one comparable earlier observation using the same geographic definitions. The snapshot also cannot identify whether births, deaths, domestic moves or international migration were responsible for any prior change. Those explanations need demographic-flow or time-series data rather than inference from a single stock measure.
How to interpret the concentration figures
The fact that the top ten municipalities contain 36.19% of the total shows that municipality population is not evenly distributed across administrative units. It does not mean the same share of jobs, output, housing construction or public spending is located there. Functional urban areas and commuting patterns often extend across municipal boundaries, so other geographic frameworks may be more suitable for some economic questions.
The ranking is most useful as a scale reference. When another dataset reports absolute numbers of facilities, incidents, businesses or housing units, the population baseline helps distinguish the effect of sheer size from unusually high or low per-capita intensity. A municipality that ranks high in an absolute count may move much lower after dividing by population, and the reverse can also occur.
How to read the ranking chart
The ranking chart compares municipality population counts on a common reference date. It makes the difference in population scale easy to see, from Norway’s largest municipalities to the many municipalities with much smaller resident counts.
The chart should not be read as a measure of land area, population density or growth. Those questions require additional variables or observations from another date. Here, the purpose is narrower: to compare how many residents were recorded in each named municipality on 1 January 2026.
Source, coverage and calculation method
The source is Statistics Norway (SSB) Statbank, table family 11342. The series reports population on 1 January for the 2026 reference period, in people. The 2026 table contains 358 entries with no missing values. One entry is labelled `Unknown municipality` with a value of zero; it is not treated as a named municipality in the ranking or aggregate calculations.
The remaining 357 named municipalities sum to 5,627,400. Shares in the table are calculated by dividing each municipality value by that 357-municipality total. The top-twenty chart sorts the same population values in descending order. It is intended to compare population scale rather than land area, population density or growth.
Frequently Asked Questions
Which Norwegian municipality has the largest population on 1 January 2026?
Oslo – Oslove is largest at 728,714, followed by Bergen at 294,860 and Trondheim – Tråante at 218,460.
Why does the source contain 358 rows when the comparison uses 357 municipalities?
One row is labelled `Unknown municipality` and has a value of zero. It does not identify a named municipality, so it is excluded from the ranking and 357-municipality total.
Does this dataset show which municipality is growing fastest?
No. It is a population snapshot for 1 January 2026. Growth requires at least one earlier comparable observation using the same geographic definitions.
Related Articles
Green Map creates custom-edited map images using open geographic data sources such as geoBoundaries, Natural Earth, OpenStreetMap, and government open data.
These maps are edited visual materials, not raw data files, and are provided for education, documents, presentations, and graphic reference.