Population size varies sharply across Denmark’s municipalities. Statistics Denmark’s StatBank FOLK1A table reports 2026 Q3 population on the first day of the quarter for all 98 municipalities. Adding those municipal observations gives 6,031,608 people. The figures combine all ages, sexes and marital statuses, while regional aggregates, the national total and Christiansø are excluded from the 98-row municipal comparison.
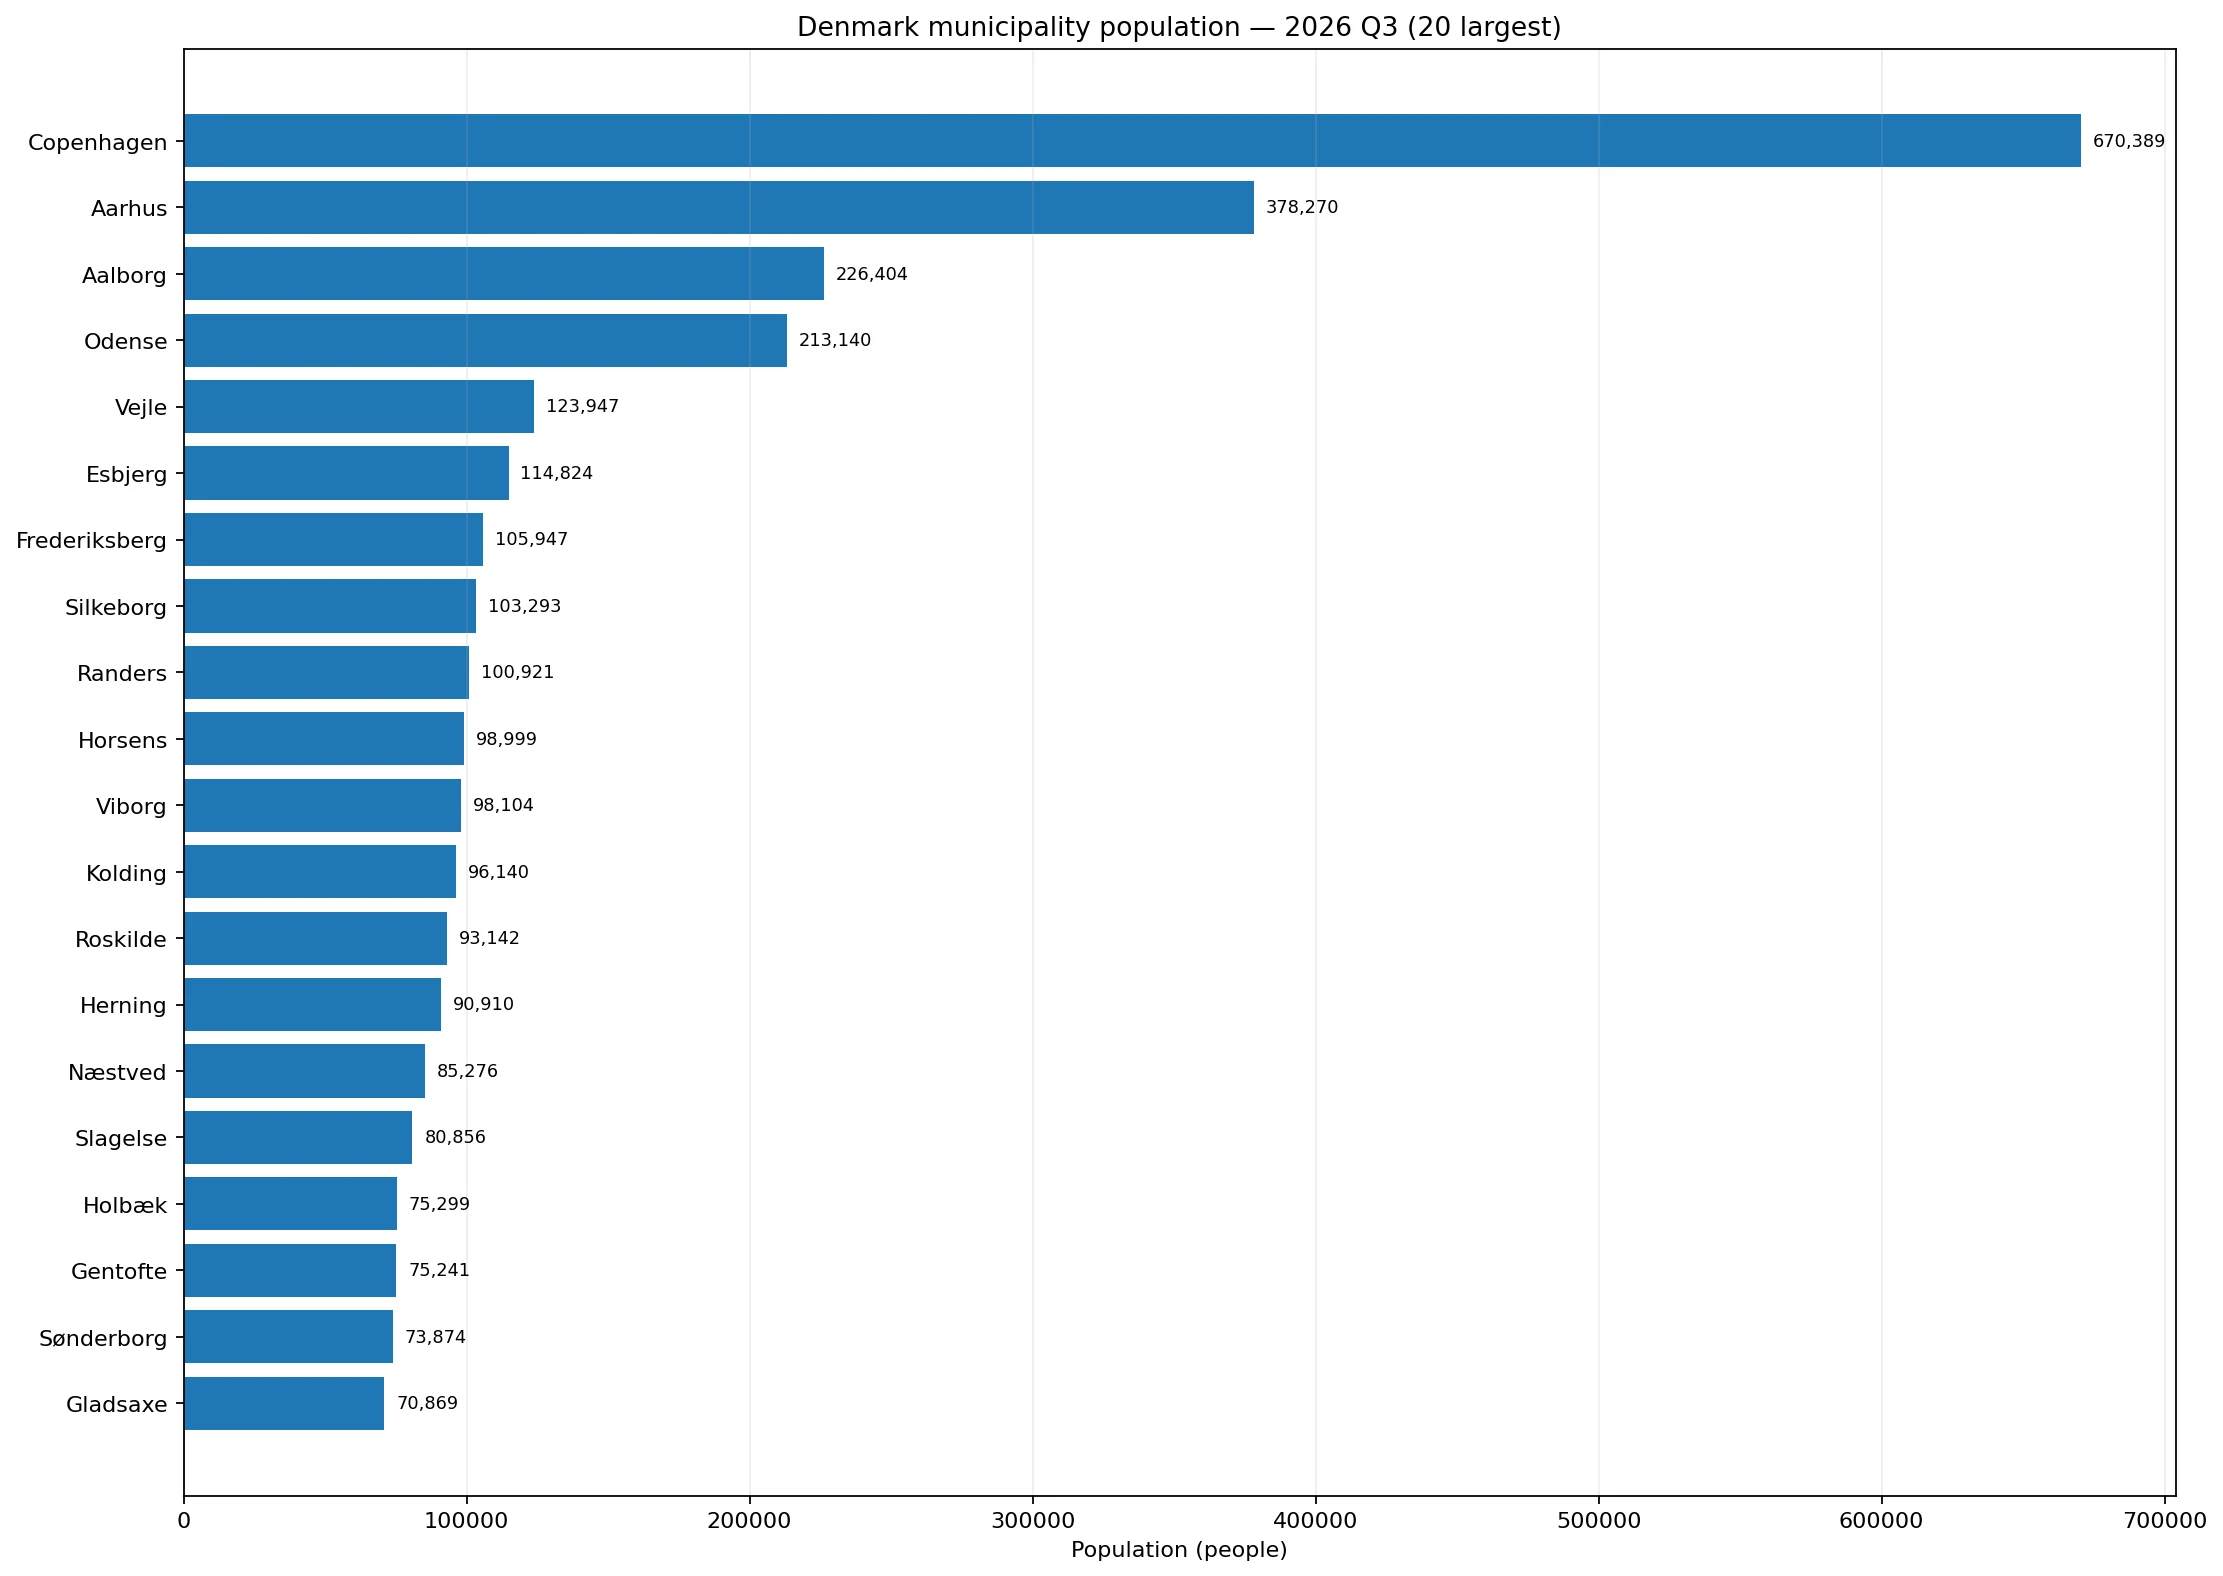
Table of Contents
How large is the municipal population distribution?
The 98 municipalities sum to 6,031,608 people. The simple mean is 61,547, while the median is 44,405.5. Because the mean is roughly 17,000 people above the median, a relatively small group of large municipalities pulls the average upward. The first quartile is 31,857 and the third quartile is 60,651, so the middle half of municipalities lies roughly between 32,000 and 61,000 residents.
There are 9 municipalities with at least 100,000 residents and 9 with fewer than 20,000. This produces a distribution in which many municipalities occupy the middle range, while a notable share of the total population is concentrated in the largest municipalities.
Which municipalities have the largest populations?
Copenhagen is the largest municipality at 670,389 people, equal to 11.11% of the 98-municipality total. It is followed by Aarhus at 378,270, Aalborg at 226,404, Odense at 213,140, and Vejle at 123,947. Together, the five largest municipalities account for 26.73% of the total. The top 10 account for 35.42%, and the top 20 reach 49.34%, just under half.
| Municipality | Population | Share of 98-municipality total |
|---|---|---|
| Copenhagen | 670,389 | 11.11% |
| Aarhus | 378,270 | 6.27% |
| Aalborg | 226,404 | 3.75% |
| Odense | 213,140 | 3.53% |
| Vejle | 123,947 | 2.05% |
| Esbjerg | 114,824 | 1.90% |
| Frederiksberg | 105,947 | 1.76% |
| Silkeborg | 103,293 | 1.71% |
| Randers | 100,921 | 1.67% |
| Horsens | 98,999 | 1.64% |
These figures compare absolute population, not area or density. A municipality with a large population is not necessarily more densely populated, and a high population level does not by itself show faster recent growth. Those questions require additional variables such as land area or earlier population observations.
How wide is the gap between the largest and smallest municipalities?
Læsø has the smallest population in the dataset at 1,655. Fanø follows at 3,322, Samsø at 3,633 and Ærø at 5,730. Copenhagen’s population is about 405.1 times Læsø’s. This wide range is why the median and the full distribution are more informative than the mean alone.
| Municipality | Population |
|---|---|
| Læsø | 1,655 |
| Fanø | 3,322 |
| Samsø | 3,633 |
| Ærø | 5,730 |
| Langeland | 11,804 |
| Dragør | 14,482 |
Small municipalities can also show large percentage changes from modest absolute gains or losses, while large municipalities can add thousands of residents without an equally dramatic percentage movement. This dataset is a single-quarter snapshot, so it should not be used to infer population growth or decline without comparing it with an earlier quarter or the same quarter in a previous year.
What exactly does the 2026 Q3 snapshot measure?
The reference period is the first day of 2026 Q3. It is therefore a point-in-time population count rather than an annual average or year-end estimate. The selected dimensions cover all ages, both sexes combined and all marital-status categories. The values describe municipalities as whole administrative units; they do not reveal variation within each municipality.
All 98 municipal rows have observed values. There are no missing values and no suppressed observations in the supplied extract, so no municipality is treated as zero and no values are imputed. When comparing the 6,031,608 municipal sum with a separate national figure, the coverage definition should be checked because this extract intentionally excludes national and regional aggregate rows and Christiansø.
How can the figures be used?
Municipal population is a useful baseline for comparing potential service demand, infrastructure scale and local market size. It becomes more informative when paired with housing, employment, commuting, education or health-service measures for the same administrative boundaries and reference period. Population size alone should not be interpreted as a score of economic performance or living conditions.
The same FOLK1A series can also support a quarterly time series. Linking successive quarters would make it possible to separate current population level from change over time. This article deliberately keeps those questions separate: the figures here describe where municipality populations stood at the start of 2026 Q3, not how quickly they were rising or falling.
Source and indicator definition
The source is Statistics Denmark, StatBank Denmark table FOLK1A. The measure is population on the first day of the quarter. This comparison uses the total categories for age, sex and marital status, with people as the unit and 2026 Q3 as the reference period.
Frequently Asked Questions
What is the combined population of the 98 Danish municipalities in 2026 Q3?
The 98 municipal observations sum to 6,031,608 people. Regional and national aggregate rows and Christiansø are excluded from this 98-row municipal dataset.
Which municipality has the largest population?
Copenhagen is largest at 670,389, followed by Aarhus at 378,270, Aalborg at 226,404, and Odense at 213,140.
Does this dataset show population growth?
No. It is a point-in-time 2026 Q3 population snapshot. Growth requires comparison with an earlier quarter or the same quarter in a previous year.
Related Articles
Green Map creates custom-edited map images using open geographic data sources such as geoBoundaries, Natural Earth, OpenStreetMap, and government open data.
These maps are edited visual materials, not raw data files, and are provided for education, documents, presentations, and graphic reference.