The share of merchandise imports sourced from low- and middle-income economies outside the reporting economy’s region varies widely across the world. In the World Bank TM.VAL.MRCH.OR.ZS dataset, the 205-economy median is 20.4% and the mean is 22.3%. The highest observation is Somalia at 75.3%, and 11 economies are at or above 50%.
This indicator does not mean “imports from low-income countries” alone. It combines low- and middle-income partner economies and then applies a geographic condition: only partners in World Bank regions outside the reporting economy’s region count toward the numerator. A high value therefore means that this specific partner group supplies a large share of total merchandise imports.
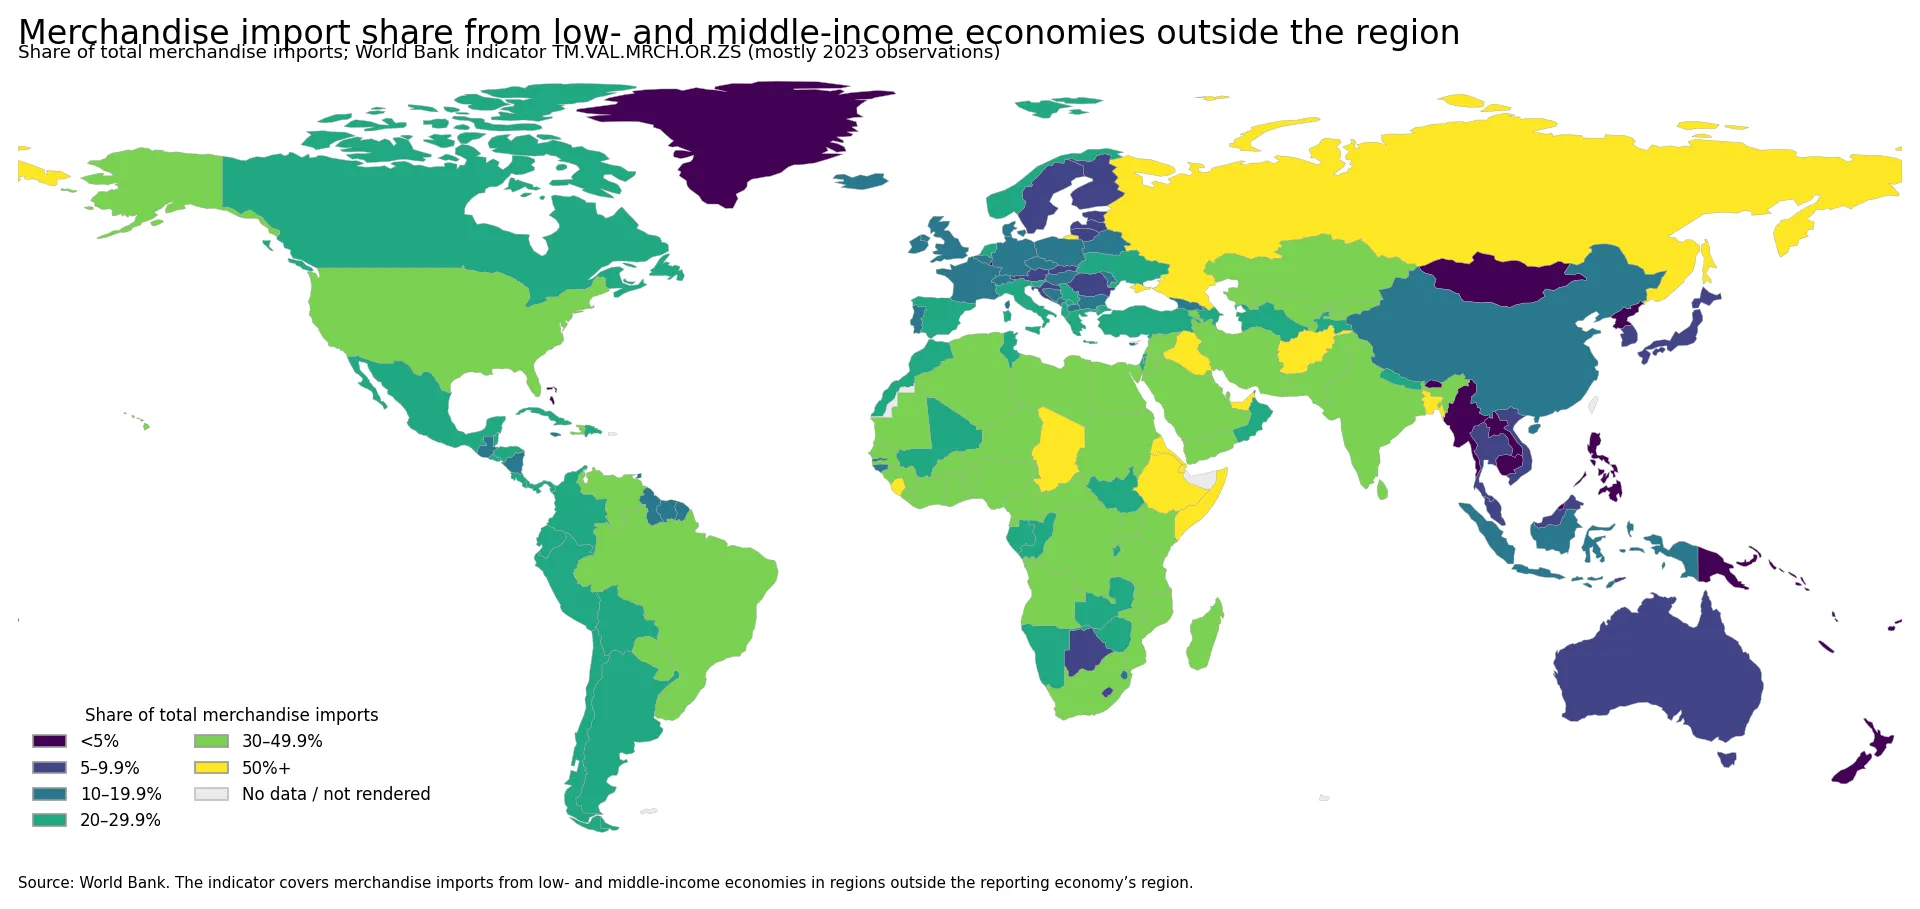
The map uses six ranges: below 5%, 5–9.9%, 10–19.9%, 20–29.9%, 30–49.9%, and 50% or more. Of the 205 observations, 61 are below 10%, while 62 are at or above 30%. The generalized world boundary layer matches 169 economies; unmatched small islands and territories still remain in the tables and summary statistics.
Table of Contents
What this trade indicator measures
The official indicator is “Merchandise imports from low- and middle-income economies outside region (% of total merchandise imports).” The denominator is the reporting economy’s total merchandise imports. The numerator is merchandise imported from partner economies classified by the World Bank as low or middle income and located in regions outside the reporting economy’s own region. Services are not part of the measure.
A value of 40% means that about two-fifths of total merchandise imports came from partners meeting those income and regional conditions in the observation year. The indicator does not reveal which individual partner country dominates the flow, which products account for the trade, or whether the imports are final goods, components, commodities, or re-exports. Bilateral and product-level trade data are needed for those questions.
The World Bank definition also applies a data-availability rule: the measure is computed only when at least half of the economies in the partner-country group have non-missing data. The source used here is the World Bank TM.VAL.MRCH.OR.ZS indicator.
Economies with the highest shares in 2023
The upper end spans several regions rather than one single geographic block. African, Middle Eastern, South Asian, European, and Gulf economies all appear among the highest observations. That mix is important because it shows that a high share is not a simple proxy for income level or location. It reflects the composition of import partners under this specific World Bank classification.
| Economy | Observation year | Share of total merchandise imports |
|---|---|---|
| Somalia, Fed. Rep. | 2023 | 75.3% |
| Iraq | 2023 | 68.2% |
| Afghanistan | 2023 | 65.6% |
| Djibouti | 2023 | 60.0% |
| Ethiopia | 2023 | 59.7% |
| Russian Federation | 2023 | 58.6% |
| United Arab Emirates | 2023 | 56.4% |
| Sierra Leone | 2023 | 54.8% |
| Eritrea | 2023 | 51.5% |
| Bangladesh | 2023 | 50.6% |
Somalia records the largest share at 75.3%, followed by Iraq at 68.2% and Afghanistan at 65.6%. Djibouti and Ethiopia are close to 60%. The Russian Federation is 58.6%, the United Arab Emirates 56.4%, and Sierra Leone, Eritrea, and Bangladesh are also above 50%. These are percentage shares, not rankings of total import value. A smaller economy can have a higher percentage while importing far fewer dollars of goods than a larger economy with a lower percentage.
The lowest shares cluster among several Pacific economies
Several of the smallest values occur in Pacific island economies. Samoa is 0.2%, New Caledonia 0.5%, Tonga 0.6%, Palau 0.8%, and the Solomon Islands and Tuvalu are below 1%. Lao PDR is also below 1%. These figures do not mean that the economies import very little or are weakly connected to trade; they only show that a small share of merchandise imports comes from low- and middle-income partners located outside their region.
| Economy | Observation year | Share of total merchandise imports |
|---|---|---|
| Samoa | 2023 | 0.2% |
| New Caledonia | 2023 | 0.5% |
| Tonga | 2011 | 0.6% |
| Lao PDR | 2023 | 0.7% |
| Palau | 2023 | 0.8% |
| Solomon Islands | 2023 | 0.9% |
| Tuvalu | 2023 | 1.0% |
| Guam | 2023 | 1.1% |
| Kiribati | 2023 | 1.1% |
| Micronesia, Fed. Sts. | 2023 | 1.1% |
The “outside region” condition is especially important when interpreting low values. Imports from low- and middle-income partners within the reporting economy’s region are excluded from the numerator. A country with strong regional supply chains may therefore record a low value even if low- and middle-income partners are important to its overall trade. Conversely, sourcing heavily from such economies in other regions can lift the share. The indicator alone cannot identify the exact bilateral drivers.
Geographic contrasts visible on the map
Across Africa, many economies fall in the 30% or higher ranges, but the pattern is far from uniform. Somalia, Djibouti, and Ethiopia are among the highest, while other African economies sit in middle bands. Neighboring countries can therefore have very different import-source structures despite geographic proximity.
Asia also shows sharp contrasts. Iraq, Afghanistan, and Bangladesh are very high, while Japan is 5.7%, Thailand 6.6%, Malaysia 7.4%, Indonesia 11.7%, and China 16.7%. The differences illustrate how the indicator responds to the location and income classification of trade partners rather than to continent alone.
Europe contains many middle or lower values, yet the Russian Federation is an obvious high outlier at 58.6%. The United States is also relatively high at 47.4%. High-income reporting economies can therefore post high values when a large portion of their goods comes from low- and middle-income partners outside their own region. The indicator should not be used to infer a reporting economy’s own income category.
How the 205 observations are distributed
The median across all observations is 20.4% and the mean is 22.3%. There are 61 economies below 10%, 62 at or above 30%, and 11 at or above 50%. The full range runs from 0.2% to 75.3%, showing that import-partner composition differs substantially across economies.
| Range | Number of economies |
|---|---|
| Below 5% | 32 |
| Below 10% | 61 |
| 30% or more | 62 |
| 50% or more | 11 |
| All observations | 205 |
Because the measure is a percentage, it is useful for comparing trade composition across economies of very different sizes. But percentages should not be confused with trade scale. A 50% share in a small economy and a 50% share in a very large economy can represent dramatically different import values. Total merchandise imports are needed to compare economic scale or exposure in dollar terms.
The observations are almost entirely synchronized to 2023
One strength of this dataset is temporal consistency: 204 of 205 observations are from 2023. Tonga is the sole exception, with its latest available observation dated 2011. That means most of the world map can be read as a same-year comparison, but Tonga should not be interpreted as a 2023 value.
Calling this a 2023 map is therefore useful but requires the exception to be disclosed. For country-specific analysis where current trade structure matters, the latest bilateral or national trade release should be checked before making decisions, especially when an observation is older than the common reference year.
Five cautions for interpreting the map
- The partner group is broader than low income. It includes both low- and middle-income economies.
- “Outside region” is part of the definition. Same-region low- and middle-income partners do not count toward the numerator.
- This is a merchandise-import share. It does not cover services, exports, or the full value of international trade.
- A high share is not inherently good or bad. Supply chains, geography, industrial structure, re-exports, and trade agreements can all matter.
- The indicator does not identify causes. Partner-level and product-level data are required to determine which countries and goods drive the result.
What the map is most useful for
The clearest use of this map is to compare how strongly national import baskets are connected to low- and middle-income suppliers located outside the reporting economy’s region. The wide range—from below 1% in several Pacific economies to above 70% in Somalia—shows that this aspect of trade structure differs dramatically across countries.
A second takeaway is that the pattern does not follow a simple rich-versus-poor or continent-versus-continent split. Very high values appear in economies with very different income levels and trade systems, while some neighboring economies fall into very different bands. That makes the indicator useful as a starting point for asking where import sourcing is geographically diversified or concentrated across regions.
For deeper supply-chain analysis, the next step should be bilateral merchandise imports by partner and product, combined with total import value and concentration measures. Those additions can show whether a high share is spread across many suppliers or driven by one or two major trade partners—something this percentage alone cannot establish.
Frequently Asked Questions
Does this indicator measure imports from low-income economies only?
No. It combines low- and middle-income partner economies and counts only those located outside the reporting economy’s region.
Does a high percentage mean the trade structure is risky?
Not by itself. The percentage only describes partner composition. Assessing supply-chain risk requires bilateral partner concentration, product mix, total import value, and other evidence.
Are all observations from 2023?
Almost. 204 of the 205 observations are from 2023. Tonga’s latest available observation is from 2011 and should be treated as an exception.
Related Articles
Green Map creates custom-edited map images using open geographic data sources such as geoBoundaries, Natural Earth, OpenStreetMap, and government open data.
These maps are edited visual materials, not raw data files, and are provided for education, documents, presentations, and graphic reference.