Population size varies enormously across Sweden’s municipalities, from Stockholm with just over one million residents to several municipalities with only a few thousand. Statistics Sweden’s Statistical Database provides a complete same-period snapshot for all 290 municipalities at the end of July 2026. This article compares the largest and smallest municipalities, summarizes the distribution, and explains what can and cannot be inferred from a single month-end population measure.
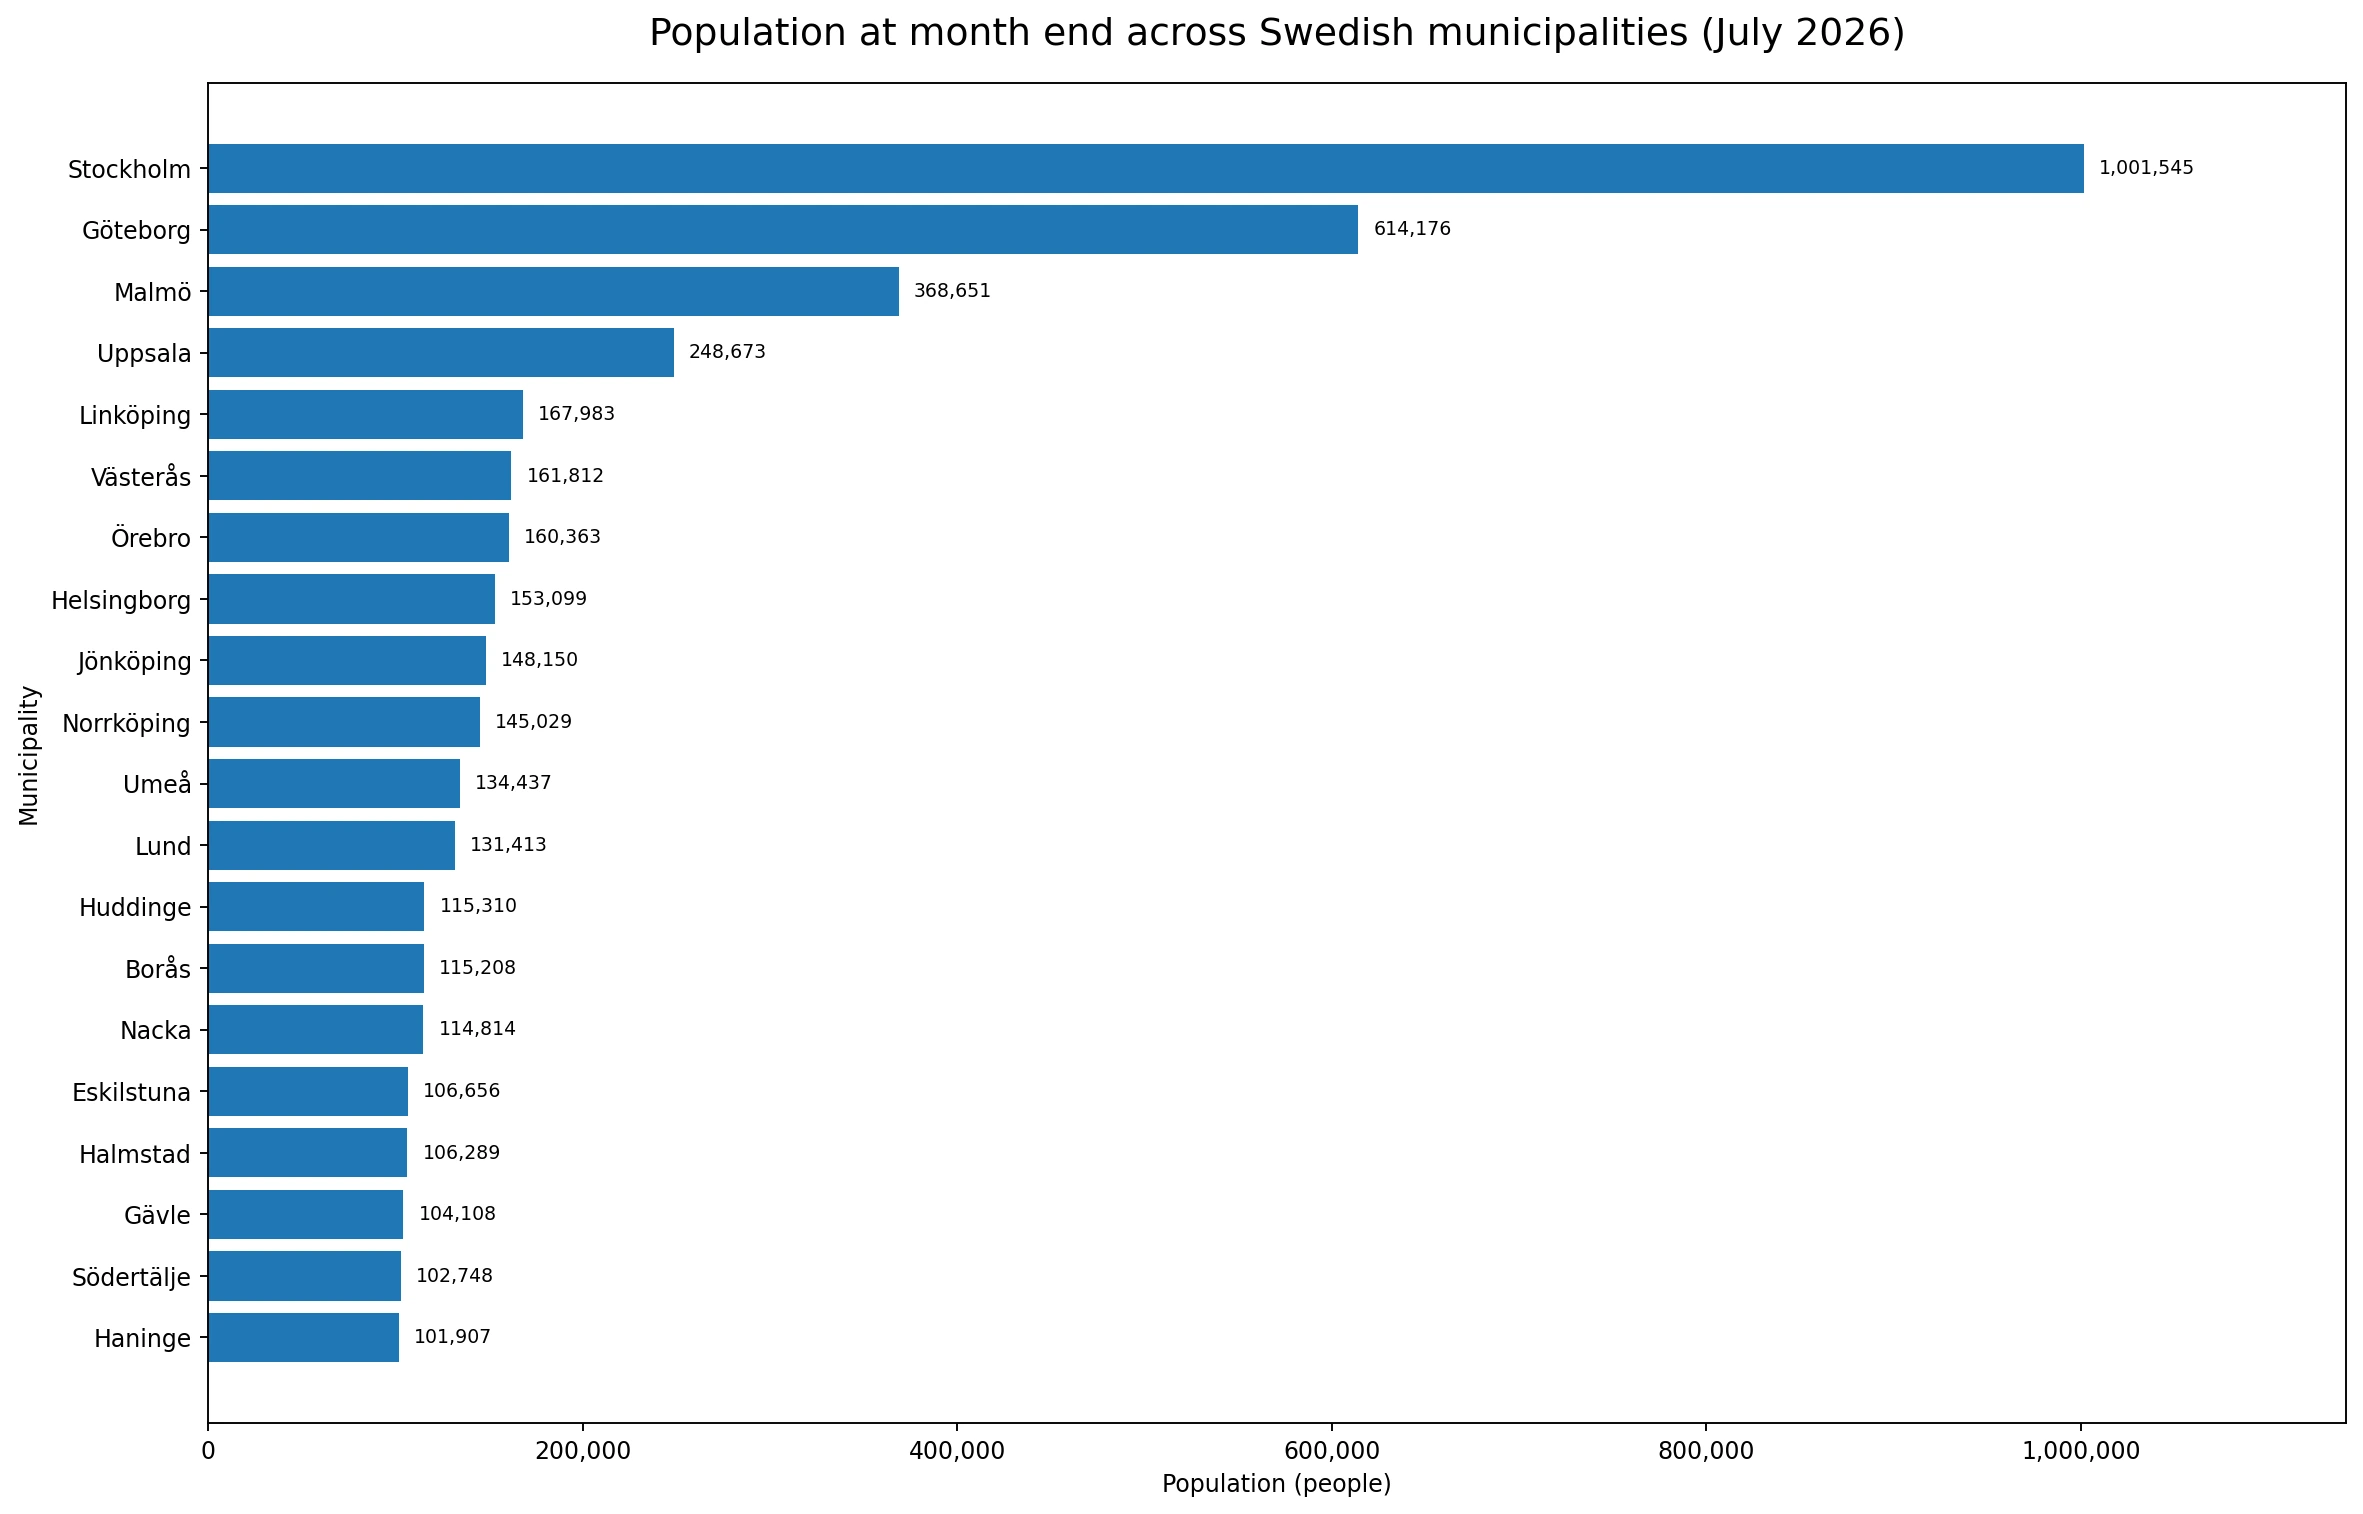
Table of Contents
What the dataset measures
The indicator is Population at month end, measured in people. The reference period is July 2026, written as 2026M07 in the source metadata. Each of Sweden’s 290 municipalities appears once, and there are no missing observations. Because every value refers to the same month end, the data are well suited to a cross-sectional comparison of municipal population size.
Adding the 290 municipal observations gives 10,613,524 people. That arithmetic sum should not automatically be treated as an exact official national population total. Statistics Sweden notes that controlled random uncertainty applies to this table and that totals do not necessarily equal the sum of components. The sum used here is therefore a descriptive total of the supplied municipal observations, not a replacement for a separately published national aggregate.
The largest municipalities by population
Stockholm is the largest municipality in the dataset with 1,001,545 people. Göteborg follows with 614,176, Malmö with 368,651, and Uppsala with 248,673. Stockholm is the only municipality above one million in this snapshot, while Göteborg is above 600,000 and Malmö is above 300,000. Linköping, Västerås, Örebro, Helsingborg, Jönköping and Norrköping complete the top ten.
| Municipality | Population |
|---|---|
| Stockholm | 1,001,545 |
| Göteborg | 614,176 |
| Malmö | 368,651 |
| Uppsala | 248,673 |
| Linköping | 167,983 |
| Västerås | 161,812 |
| Örebro | 160,363 |
| Helsingborg | 153,099 |
| Jönköping | 148,150 |
| Norrköping | 145,029 |
The five largest municipalities account for about 22.6% of the arithmetic sum of all 290 observations. The top ten account for about 29.9%, and the top twenty about 40.5%. This shows meaningful concentration in the largest urban municipalities, but not dominance by a tiny handful alone: even the top twenty remain below half of the municipal-observation total.
The median municipality is much smaller than the average
The mean municipal population is approximately 36,598, while the median is only 16,286. The large gap between those two measures reflects a strongly right-skewed distribution: a limited number of very large municipalities pull the average upward, while most municipalities are much smaller.
The first quartile is about 9,771 and the third quartile about 36,088, meaning that roughly half of all municipalities fall between those two values. There are 20 municipalities with at least 100,000 people, 32 between 50,000 and 99,999, 71 between 20,000 and 49,999, 91 between 10,000 and 19,999, and 76 below 10,000. The number of municipalities in the smaller bands is therefore much greater than the number in the largest bands.
The smallest municipalities
Dorotea has the smallest value in the dataset at 2,213 people. It is followed by Bjurholm at 2,327, Sorsele at 2,358, Arjeplog at 2,548, and Åsele at 2,658. The difference between these municipalities and Stockholm is hundreds of times in absolute population, illustrating how broad the scale range is within the same municipal level of government.
| Municipality | Population |
|---|---|
| Dorotea | 2,213 |
| Bjurholm | 2,327 |
| Sorsele | 2,358 |
| Arjeplog | 2,548 |
| Åsele | 2,658 |
| Malå | 2,872 |
| Överkalix | 3,176 |
| Munkfors | 3,619 |
| Ydre | 3,619 |
| Storfors | 3,763 |
What this snapshot can tell us
The strongest use of the July 2026 snapshot is to compare relative municipal size at one common point in time. It allows straightforward rankings, percentile comparisons, population-band counts and concentration measures. Those calculations help distinguish the structure of the municipal system from the much larger values associated with a few major cities.
The snapshot does not identify the causes of population differences. It cannot separate the effects of births, deaths, domestic migration or international migration, and it does not provide a growth rate. A change analysis would require at least one earlier observation. The dataset also contains no municipal area values, so population density cannot be derived directly from these four columns.
Why this article uses a ranking chart instead of a choropleth
The verified data contain municipality identifiers, names, the year and population values, but no municipal boundary geometry. Rather than attach an unverified boundary file or fabricate a spatial join, the visual uses the observed values directly in a top-20 ranking chart. A choropleth would be appropriate only after the municipality codes are matched to a trusted Swedish boundary dataset with the join coverage checked explicitly.
How to interpret the distribution carefully
A chart that includes Stockholm and the smallest municipalities on the same linear axis can visually compress differences among the smaller places. That is why the median, quartiles and population bands are useful alongside the ranking. A single month-end observation also does not distinguish long-term demographic change from short-term movement. Readers interested in growth should compare the same municipality codes across earlier months or years in Statistics Sweden’s database.
Source and calculation notes
The source is Statistics Sweden’s Statistical Database, dataset TAB6473, indicator code TAB6473.E00E62F19E25CD2CEBFB6D8D. The analysis uses all 290 published municipality observations for the end of July 2026. Rankings, the mean, median, quartiles, population bands and top-share calculations were derived directly from those values. There are no missing observations, and no missing values were converted to zero.
Frequently Asked Questions
Which Swedish municipality had the largest population at the end of July 2026?
Stockholm was largest at 1,001,545 people, followed by Göteborg at 614,176, Malmö at 368,651, and Uppsala at 248,673.
Does the sum of the 290 municipal values equal Sweden’s official national total?
The 290 observations sum arithmetically to 10,613,524. Statistics Sweden notes that controlled random uncertainty applies, so component sums do not necessarily equal separately published totals exactly.
Can this dataset be used to calculate municipal population growth?
Not by itself. It is a single end-of-July 2026 snapshot. Growth requires comparison with an earlier month or year for the same municipality codes.
Related Articles
Green Map creates custom-edited map images using open geographic data sources such as geoBoundaries, Natural Earth, OpenStreetMap, and government open data.
These maps are edited visual materials, not raw data files, and are provided for education, documents, presentations, and graphic reference.