The 2022 World Bank series reports a weighted-mean applied tariff on manufactured products for 143 countries and economies, with 74 source-missing observations. The median among reported values is 3.40% and the mean is 5.29%. Bermuda records the highest value at 21.85%, followed by The Bahamas, the Republic of the Congo and Cameroon. Four reporting economies—Hong Kong SAR, Iceland, Macao SAR and Singapore—have an actual recorded value of 0.00%, which must not be confused with missing data.
The indicator is not a simple average of tariff-line rates. It uses effectively applied rates at detailed product and partner levels and weights them by the corresponding import shares. When an effectively applied rate is unavailable, the most-favored-nation rate is used. Manufactured products are defined from SITC Revision 3 sections 5 through 8, excluding division 68. The resulting percentage therefore combines tariff policy with the composition of actual imports.
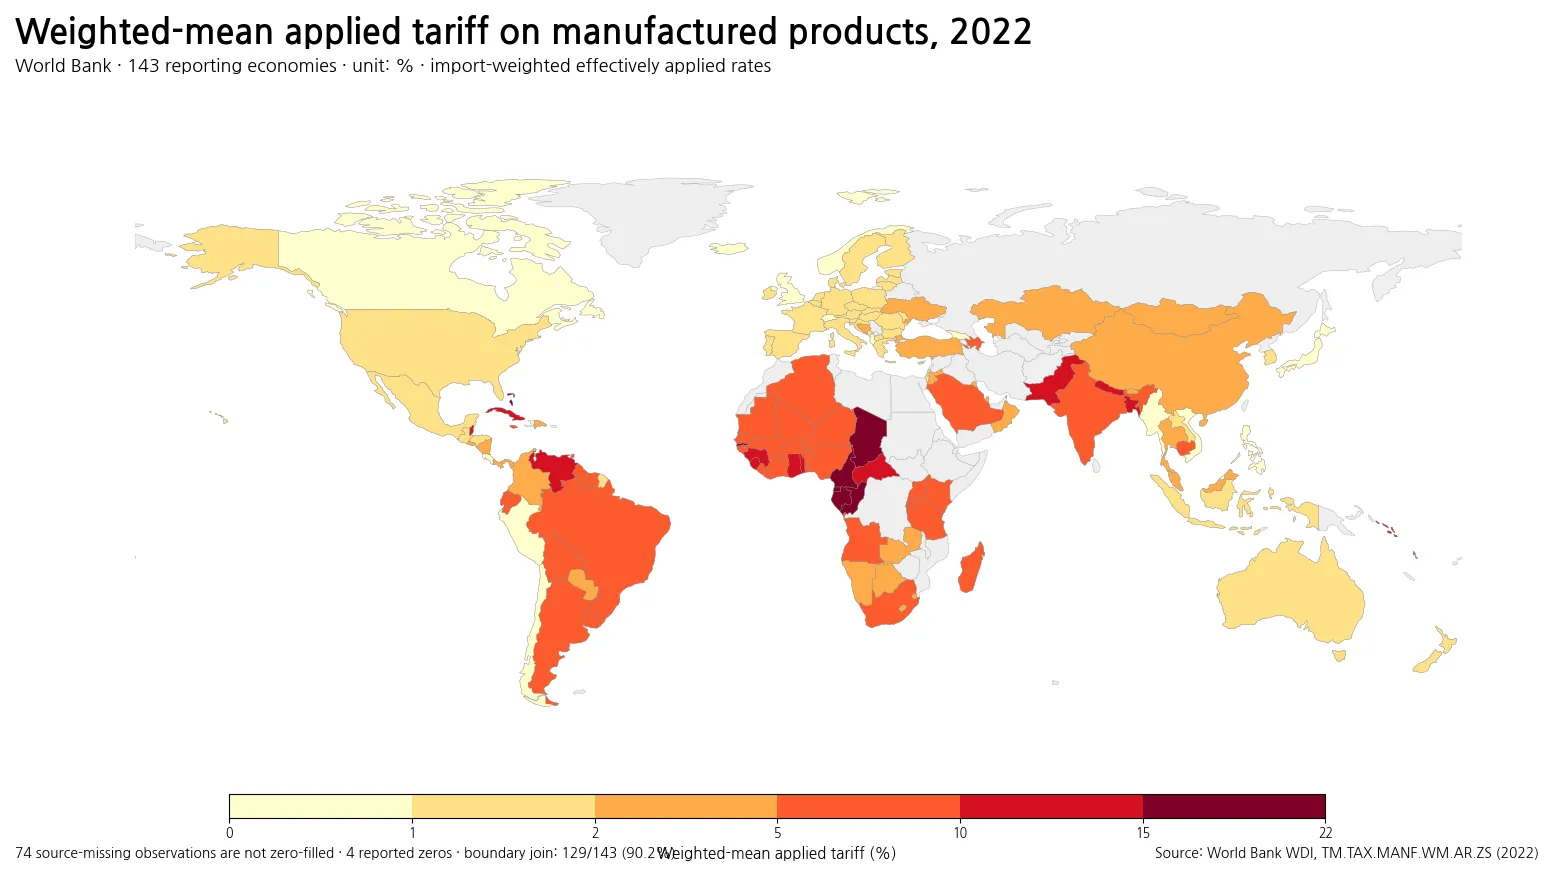
Table of Contents
A 3.4% median sits inside a distribution that stretches above 20%
The first quartile is 1.64%, the median is 3.40% and the third quartile is 8.75%. Half of the reporting economies therefore fall between roughly 1.6% and 8.8%. The 90th percentile is 12.03% and the 95th percentile is 15.27%. The mean, 5.29%, exceeds the median because a smaller group of double-digit observations extends the upper tail.
Breaking the distribution into broad ranges gives a clearer picture: 20 economies are below 1%, 39 are from 1% to under 2%, 25 are from 2% to under 5%, 35 are from 5% to under 10%, 16 are from 10% to under 15%, and 8 are at 15% or more. A majority of reported economies are below 5%, but the upper group is far enough away that a single global mean hides substantial differences.
Bermuda and The Bahamas lead the table, but the number is not every tariff line
Bermuda records 21.85%, The Bahamas 18.62%, the Republic of the Congo 17.90%, Cameroon 17.52%, Equatorial Guinea 16.32% and Gabon 15.64%. Chad and The Gambia also exceed 15%. These are import-weighted averages; they do not mean every manufactured product entering those economies faced the headline percentage.
Import weighting matters because a tariff on a heavily imported product contributes much more to the average than a tariff on a product with little or no trade. Two economies with similar tariff schedules can therefore produce different weighted means if their import baskets differ. Conversely, a schedule containing some high tariff lines can still yield a low weighted mean when imports are concentrated in lower-duty products.
| Country or economy | Weighted-mean applied tariff |
|---|---|
| Bermuda | 21.85% |
| Bahamas, The | 18.62% |
| Congo, Rep. | 17.90% |
| Cameroon | 17.52% |
| Equatorial Guinea | 16.32% |
| Gabon | 15.64% |
| Chad | 15.52% |
| Gambia, The | 15.33% |
| Togo | 14.74% |
| Venezuela, RB | 13.81% |
Central and West Africa contain a visible cluster of higher reported rates
The map shows several double-digit observations across Central and West Africa: the Republic of the Congo at 17.90%, Cameroon at 17.52%, Equatorial Guinea at 16.32%, Gabon at 15.64%, Chad at 15.52% and Togo at 14.74%. Nigeria is 9.21%, Kenya 9.07% and South Africa 5.31%. The continent is not uniform, but the cluster is visible relative to many lower-rate regions.
The map alone cannot identify the cause of the cluster. Preferential agreements, tariff schedules, partner composition, the mix of imported manufactured goods and the conversion of specific duties into ad valorem equivalents can all affect a weighted result. A causal explanation would require tariff-line and partner-level evidence rather than inference from the country average.
Asia ranges from double-digit values to reported zeros
Bangladesh reports 12.94% and Pakistan 10.51%, while India is 6.22%. China stands at 2.45%, Korea at 1.79%, Indonesia at 1.74%, Japan at 0.85% and Viet Nam at 0.82%. Singapore is one of the four economies with a reported 0.00% value.
Those differences reflect the indicator’s construction as much as the tariff schedule itself. The relative weight of machinery, chemicals, textiles, transport equipment and other manufactured imports changes the average. Preferential rates under trade agreements may also enter the effectively applied rate. For that reason, this series and an MFN tariff series answer related but not identical questions.
Many European observations are below 2%
Germany, France, Italy and Spain each report 1.64% in the 2022 dataset. The United Kingdom is at 0.71%, Switzerland 0.12%, Norway 0.23% and Iceland 0.00%. This produces a broad low-rate pattern across much of Europe in the map.
Identical headline values do not prove that tariff schedules and import baskets are identical. Each number compresses many product-partner observations into one weighted percentage. It does not show the maximum tariff, the share of duty-free lines, tariff escalation by processing stage, non-tariff measures or customs procedures. Those dimensions need separate evidence.
The Americas combine high Caribbean observations with much lower North American values
Bermuda and The Bahamas occupy the top two positions. Venezuela reports 13.81%, Brazil 8.68% and Argentina 7.80%. Mexico is 1.78%, the United States 1.61%, Canada 0.76% and Chile 0.48%. The range within the hemisphere is therefore much wider than a regional label would suggest.
This is particularly important where preferential trade relationships are extensive. An applied tariff weighted by actual imports can be materially different from an MFN rate that describes the default treatment of non-preferential partners. The current indicator is closer to the tariff environment encountered by the observed import basket, although even that interpretation remains an average across products and partners.
Reported 0% values must remain separate from the 74 missing observations
Hong Kong SAR, Iceland, Macao SAR and Singapore report exactly 0.00%. Brunei Darussalam is 0.05%, Switzerland 0.12%, Albania 0.15%, Seychelles 0.17% and Georgia 0.19%. These are reported numeric observations, not placeholders for missing values.
By contrast, 74 countries and economies have no 2022 value in the supplied World Bank series. Replacing those observations with zero would falsely turn missing records into duty-free outcomes and would depress the distribution. The map and all summary statistics keep source-missing values out of the numeric calculation.
| Country or economy | Weighted-mean applied tariff |
|---|---|
| Hong Kong SAR, China | 0.00% |
| Iceland | 0.00% |
| Macao SAR, China | 0.00% |
| Singapore | 0.00% |
| Brunei Darussalam | 0.05% |
| Switzerland | 0.12% |
| Albania | 0.15% |
| Seychelles | 0.17% |
| Georgia | 0.19% |
| Norway | 0.23% |
How this differs from an MFN tariff on manufactured products
An MFN tariff describes the standard rate generally applied when no preferential treatment is available. The applied-rate indicator uses the effectively applied rate where available and weights it by observed imports. Preferential rates can therefore affect the measure directly. If a large share of imports enters under preferential treatment, the applied weighted mean may sit below an MFN-based measure.
Weighting is the second major distinction. An unweighted or simple mean gives every tariff line equal importance. An import-weighted mean gives more influence to products that are actually imported in larger values. The two statistics can move differently, and neither should be substituted for the other without explaining the question being asked.
A one-year snapshot does not establish the long-run direction of tariff policy
The comparison uses the 2022 cross-section. Even if formal tariff rates were unchanged, the weighted mean could move when the import mix changes. New trade agreements, partner shifts, commodity-price movements, supply disruptions and large changes in particular manufactured imports can alter the weights from one year to the next.
A trend analysis should therefore follow the same indicator through time and, where possible, compare it with MFN rates, simple means, import values and the share of preferential trade. That makes it possible to distinguish a policy change from a compositional change in the goods that are being imported.
Source and interpretation
The source is World Development Indicators series TM.TAX.MANF.WM.AR.ZS. World Bank documentation states that effectively applied tariff rates are averaged using product import shares for partner countries, with MFN rates used when an effectively applied rate is unavailable. Import weights are based on UN Comtrade, and manufactured products correspond to SITC Revision 3 sections 5–8 excluding division 68.
The most defensible reading is: among the 143 reporting economies in 2022, what import-weighted applied tariff rate was observed for manufactured products? The statistic is useful for comparing the tariff exposure of actual import baskets, but it is not a complete score of trade openness, industrial protection, consumer prices or non-tariff barriers. The 74 missing observations and 4 reported zeros should remain distinct.
Frequently Asked Questions
Is the weighted-mean applied tariff the same as the MFN tariff?
No. The applied measure uses effectively applied rates where available and weights them by observed imports. MFN rates describe the general non-preferential treatment.
Do the 74 missing 2022 observations mean a 0% tariff?
No. They are source-missing values. Reported zeros are kept as numeric observations and are not merged with missing data.
Does a low weighted mean mean every manufactured product has a low tariff?
No. Products with larger import values receive more weight. Individual tariff lines can be higher or lower than the weighted average.
Related Articles
Green Map creates custom-edited map images using open geographic data sources such as geoBoundaries, Natural Earth, OpenStreetMap, and government open data. These maps are edited visual materials, not raw data files, and are provided for education, documents, presentations, and graphic reference.