Where merchandise exports go can reveal a trade structure that is very different from what total export value alone suggests. The World Bank indicator TX.VAL.MRCH.R1.ZS measures the share of each reporting economy’s total merchandise exports that is shipped to low- and middle-income economies in East Asia and the Pacific. A value of 20% means that roughly one fifth of the reporting economy’s merchandise exports went to that partner group. Because the denominator is total merchandise exports, the indicator describes destination mix rather than the absolute dollar value of trade.
The comparison covers 205 economies and contains no missing values. For 204 economies the observation is from 2023. St. Vincent and the Grenadines is the only exception, with 2022 as its latest observation. That makes this unusually close to a same-year global comparison, but it is still not correct to describe all 205 values as 2023 observations. The map and tables therefore keep the observation year visible where it matters.
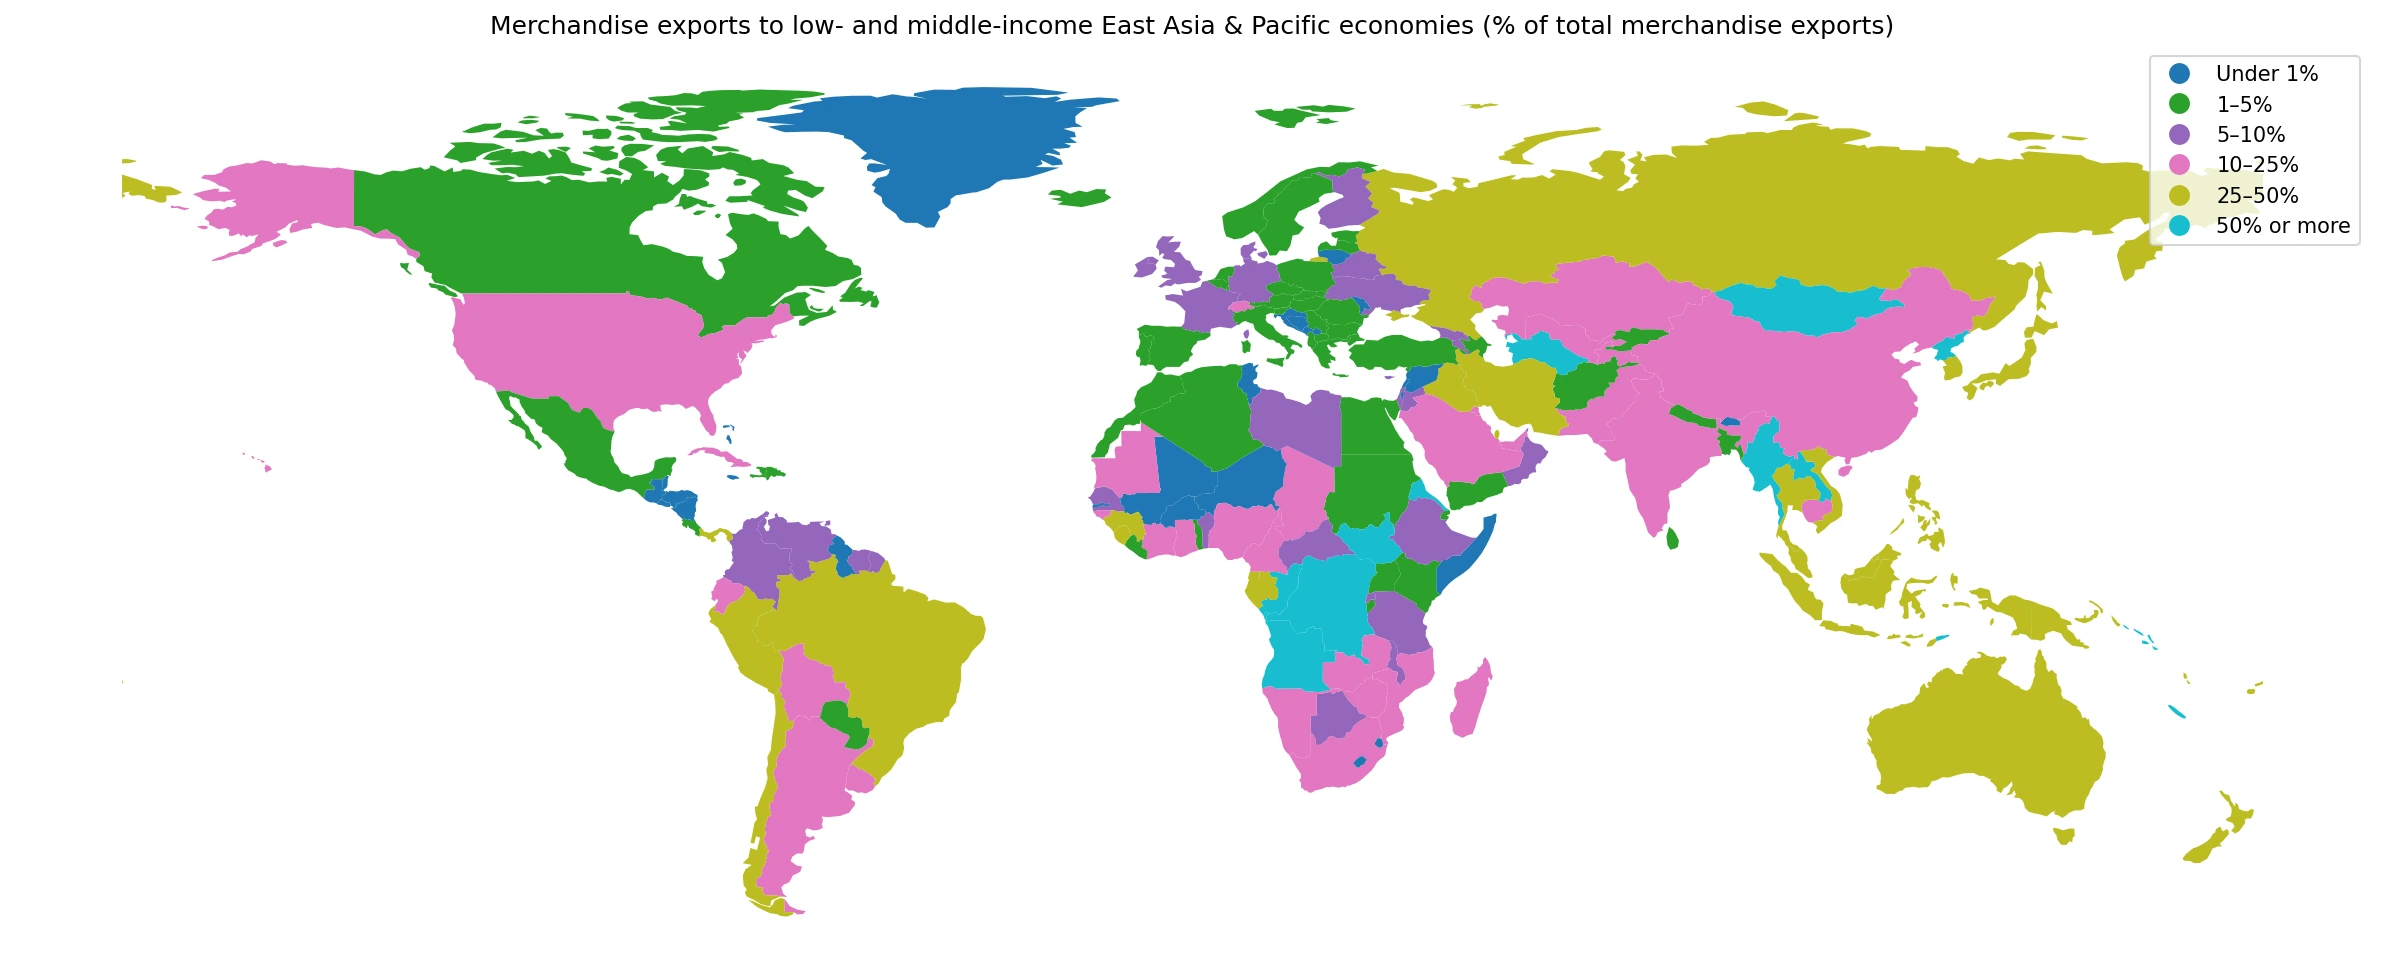
Table of Contents
What the indicator actually measures
The numerator is merchandise exports from the reporting economy to low- and middle-income economies classified within East Asia and the Pacific. The denominator is the reporting economy’s total merchandise exports. The partner group is defined by World Bank regional and income classifications, rather than by a simple geographic radius. The World Bank notes that the indicator is computed only when at least half of the economies in the partner group have non-missing data, which helps clarify what the percentage represents.
This share is useful for identifying market orientation and export-destination concentration. It does not say whether an economy exports a large or small amount in absolute terms, nor does a high share automatically imply stronger export performance. A small exporter can post a very high percentage if most of its merchandise exports go to a narrow set of destinations. A much larger exporter can send far more dollars to the same partner group while showing a lower percentage because its exports are spread across many markets.
How wide is the distribution across 205 economies?
The median of the 205 observations is 5.84%. The first quartile is 1.68% and the third quartile is 20.23%, so the middle half of economies lies roughly between 1.7% and 20.2%. The minimum is only 0.002% while the maximum reaches 91.7%. This wide spread shows that the partner group plays a marginal role in the export mix of many economies but a dominant role in a smaller set.
| Share of merchandise exports | Number of economies |
|---|---|
| Under 1% | 39 |
| 1% to under 5% | 58 |
| 5% to under 10% | 30 |
| 10% to under 25% | 34 |
| 25% to under 50% | 26 |
| 50% or more | 18 |
Thirty-nine economies are below 1%, and another 58 fall between 1% and 5%. Together, 97 of 205 economies send less than 5% of their merchandise exports to this partner group. At the other end, 44 economies are at 25% or more, including 18 at 50% or more. A single global average would hide this strongly skewed distribution, so the median, bands and country examples provide a more informative picture.
Economies with the highest shares
Mongolia has the highest observation at 91.7%. Guam follows at 84.7%, Lao PDR at 84.0%, Nauru at 80.7%, and Eritrea at 79.0%. The Federated States of Micronesia records 75.3%, Korea, Dem. People’s Rep. 74.2%, Hong Kong SAR, China 63.9%, Turkmenistan 63.1%, and the Democratic Republic of the Congo 59.4%. The top group includes economies inside or close to East Asia and the Pacific as well as economies in Africa and Central Asia, so proximity alone cannot explain the ranking.
| Economy | Share sent to the partner group | Observation year |
|---|---|---|
| Mongolia | 91.7% | 2023 |
| Guam | 84.7% | 2023 |
| Lao PDR | 84.0% | 2023 |
| Naoero | 80.7% | 2023 |
| Eritrea | 79.0% | 2023 |
| Micronesia, Fed. Sts. | 75.3% | 2023 |
| Korea, Dem. People’s Rep. | 74.2% | 2023 |
| Hong Kong SAR, China | 63.9% | 2023 |
| Turkmenistan | 63.1% | 2023 |
| Congo, Dem. Rep. | 59.4% | 2023 |
A figure above 90%, as in Mongolia, indicates an exceptionally concentrated destination mix for merchandise exports. It does not identify the cause of that concentration. Major trading partners, commodity composition, land and sea transport routes, re-export patterns, long-term commercial links and demand in nearby large markets can all matter. In smaller economies, a limited number of products or destinations can move the percentage sharply, so the ratio should be read together with export scale and product composition.
Economies with the lowest shares
At the low end, Sao Tome and Principe is near 0.002%, Sint Maarten at 0.004%, Lesotho at 0.006% and Dominica at 0.013%. St. Vincent and the Grenadines is about 0.019%, Bermuda 0.024%, St. Kitts and Nevis 0.078%, Belize 0.090%, Eswatini 0.108% and The Bahamas 0.156%. In these economies, low- and middle-income East Asia and Pacific destinations account for only a tiny part of the merchandise export mix.
| Economy | Share sent to the partner group | Observation year |
|---|---|---|
| Sao Tome and Principe | 0.002% | 2023 |
| Sint Maarten (Dutch part) | 0.004% | 2023 |
| Lesotho | 0.006% | 2023 |
| Dominica | 0.013% | 2023 |
| St. Vincent and the Grenadines | 0.019% | 2022 |
| Bermuda | 0.024% | 2023 |
| St. Kitts and Nevis | 0.078% | 2023 |
| Belize | 0.090% | 2023 |
| Eswatini | 0.11% | 2023 |
| Bahamas, The | 0.16% | 2023 |
A low share should not be interpreted as weak exports. It may simply mean that merchandise exports are directed mainly toward other high-income markets, neighboring countries, a regional trade bloc or historically important destinations. Economies where services dominate external trade can also have an overall international profile that is not well summarized by merchandise exports alone. The indicator answers a narrow but useful question about destination composition.
Geographic patterns visible on the map
Many economies in or near East Asia and the Pacific appear in the higher bands, including Mongolia, Lao PDR, Australia and several Pacific island economies. High shares also appear in parts of Africa and Central Asia. The pattern shows that destination concentration is geographically structured, but it is not a simple distance map. Export products, market demand, transport corridors and established trading relationships can produce high shares well beyond the partner region itself.
Much of Europe and many Caribbean economies fall into lower bands, often below 5%. If their merchandise exports are oriented toward European, North American or nearby regional markets, the East Asia and Pacific low- and middle-income partner group will naturally occupy a smaller share. Similar colors on the map do not imply identical trade structures: two economies with a 3% share can differ enormously in total export value, product mix, major partners and their roles in international supply chains.
How to interpret the 18 economies above 50%
When one partner group receives more than half of an economy’s merchandise exports, destination concentration is clearly high. Eighteen economies in this comparison meet or exceed the 50% threshold. Some are located within East Asia and the Pacific, while others are in different regions. A high share can reflect efficient integration with a large nearby market, strong commodity demand, established supply chains or a comparatively narrow set of export destinations. The percentage itself does not determine whether that structure is beneficial or risky.
Assessing concentration properly requires a time dimension. A 60% share that has been stable for a decade can have a different meaning from a share that rose from 20% to 60% in only a few years. Product concentration matters as well: an economy dependent on one commodity and one destination is different from an economy selling many products to several countries within the same partner group. This comparison is primarily a 2023 cross-section, so trend and resilience questions require a longer time series and product-level trade data.
Why the single 2022 observation matters
St. Vincent and the Grenadines is the only economy whose latest value in this set comes from 2022 rather than 2023. Its share is about 0.019%, placing it near the bottom of the distribution. The one-year difference does not materially change the broad global pattern, but it does matter for precise wording. The dataset is best described as 204 observations from 2023 plus one latest observation from 2022, rather than as a perfectly synchronized 2023 ranking.
Observation dates are part of the evidence in any latest-value comparison. Here, date alignment is unusually strong because virtually every economy uses 2023, yet the exception should still remain visible. If wider 2024 or 2025 coverage becomes available later, individual positions may change. The figures on this page should therefore be read as a snapshot of the latest values available in this collection, not as permanent characteristics of each economy.
Why percentages alone can be misleading
Ratio indicators remove much of the scale effect, which makes structural comparison easier, but they also hide absolute size. If an economy exports $1 billion of merchandise and 50% goes to the partner group, that represents $500 million. If another economy exports $100 billion and only 10% goes to the group, the corresponding amount is $10 billion. The second economy has the much lower percentage but the much larger trade flow. Questions about market size therefore require export values as well as shares.
The indicator also excludes imports, services trade, foreign direct investment, value added embedded in supply chains and corporate ownership links. An economy can be deeply connected to East Asia and the Pacific through services or investment while recording a modest merchandise-export share. Conversely, concentrated commodity shipments can create a very high merchandise share. For a broad assessment of economic integration, this metric should be combined with other trade and investment measures.
Questions this comparison can answer well
The clearest question is: which reporting economies direct a larger portion of their merchandise exports to low- and middle-income East Asia and Pacific markets? Comparing neighboring economies can highlight differences in destination orientation even when geography or production structures appear similar. A large gap can be a useful starting point for examining top export products, leading partner countries, port and transport links, and regional trade arrangements.
The data can also help frame questions about destination diversification. A very high share does not automatically mean that an economy lacks diversification, because the partner group itself contains multiple economies. Still, when one group receives more than half of total merchandise exports, all other destinations together necessarily account for less than half. At the opposite extreme, a share below 1% shows that this particular market group currently plays only a minor role in the economy’s merchandise-export destination mix.
Source and comparison method
The source is the World Bank indicator “Merchandise exports to low- and middle-income economies in East Asia & Pacific (% of total merchandise exports),” code TX.VAL.MRCH.R1.ZS. The unit is percent. Each observation measures the partner group’s share of the reporting economy’s total merchandise exports. The comparison contains 205 economies with non-missing values: 204 observations are from 2023 and one is from 2022.
Rankings, the median, quartiles and distribution bands are calculated across all 205 reported values. No missing values are treated as zero, and there are no missing metric values in this set. Extremely small percentages are displayed with additional decimal places where needed. The world map is intended to show the broad spatial pattern; small islands and territories can be difficult to see at this scale, so tables and numeric values remain important for exact comparisons.
Frequently Asked Questions
Does a higher share mean an economy exports more in dollar terms?
No. The indicator measures a destination share of total merchandise exports. An economy with a lower percentage can still export a much larger dollar amount to the partner group.
Are all 205 observations from 2023?
No. There are 204 observations from 2023, while St. Vincent and the Grenadines uses its latest value from 2022.
Does a share above 50% automatically indicate excessive trade dependence?
It indicates high destination concentration toward this partner group, but assessing dependence or resilience also requires export value, product mix, the number of partner markets and changes over time.
Related Articles
Green Map creates custom-edited map images using open geographic data sources such as geoBoundaries, Natural Earth, OpenStreetMap, and government open data.
These maps are edited visual materials, not raw data files, and are provided for education, documents, presentations, and graphic reference.