Merchandise trade was larger than GDP in 24 reporting economies in 2025, but that does not mean trade “contributed more than 100% of GDP.” World Bank indicator TG.VAL.TOTL.GD.ZS adds merchandise exports and imports and expresses that gross cross-border flow as a percentage of GDP. Among 189 countries and economies with a reported 2025 value, the median was 53.56%. Hong Kong SAR recorded 371.02%, Djibouti 267.14%, and Slovenia 237.45%. At the other end, Sudan was 14.96%, Haiti 16.15%, and the United States 18.50%. The very wide range reflects the fact that gross trade flows and domestic value added are different economic concepts.
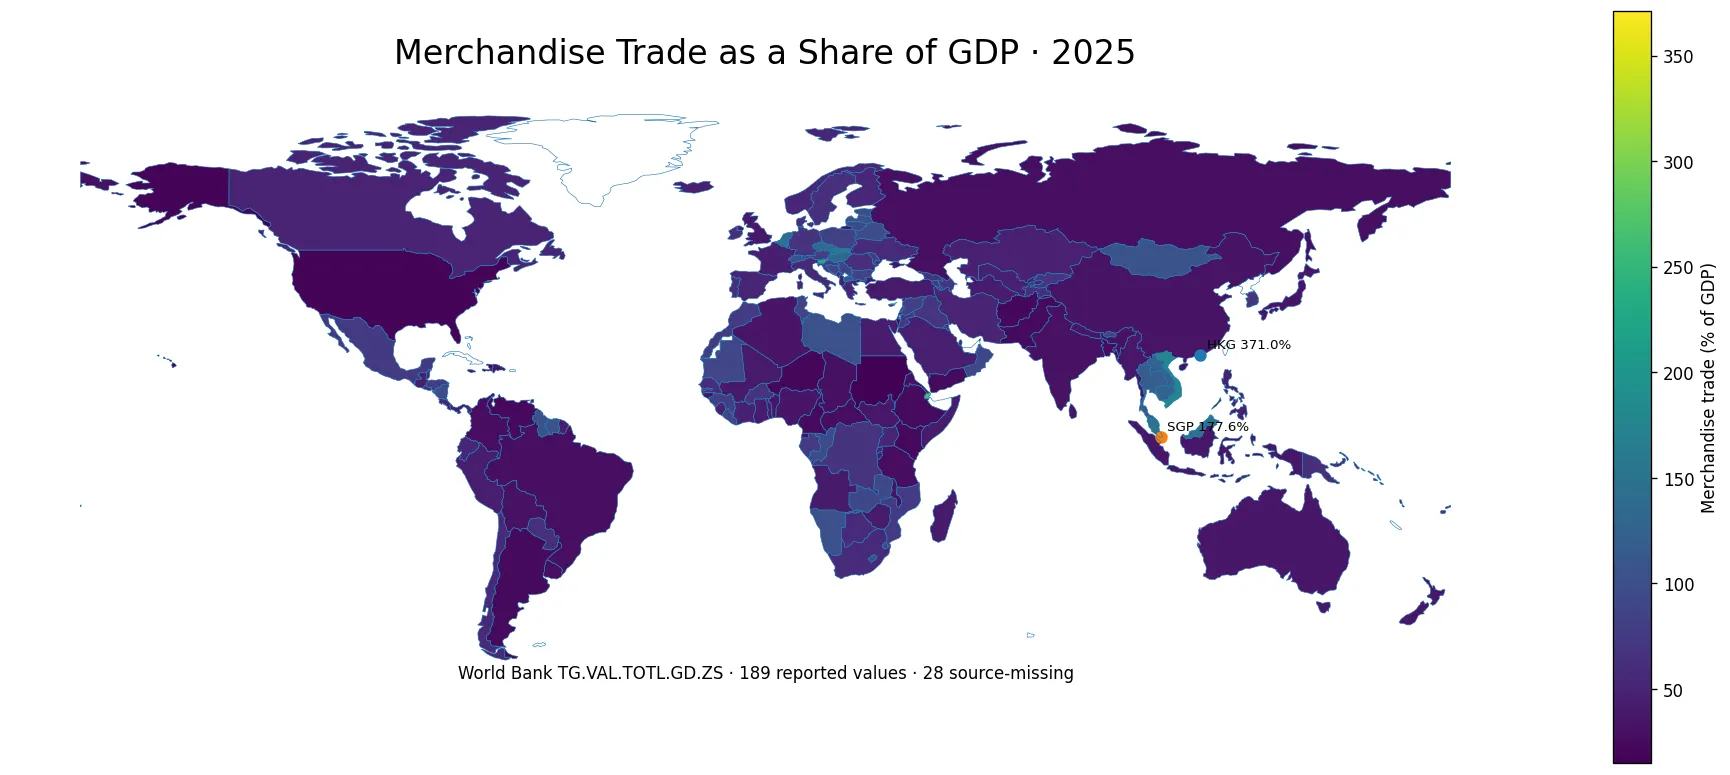
Table of Contents
What merchandise trade as a percentage of GDP measures
World Bank indicator TG.VAL.TOTL.GD.ZS measures general merchandise exports plus merchandise imports relative to gross domestic product. The numerator is a two-way gross flow across borders, while GDP is the value added generated within an economy over the accounting period. Because those concepts are different, the ratio is not a decomposition of GDP. A value above 100% simply means the combined value of merchandise exports and imports was greater than annual GDP. It does not mean that more than 100% of GDP was produced by trade.
The indicator covers merchandise rather than the full universe of international transactions. Services trade is not directly included, so economies with large financial, travel, digital, or professional-service sectors may have a different external profile from what the merchandise ratio alone suggests. The comparison uses one official 2025 observation per country or economy. World Bank reporting can include separately reported territories and economies, so the count of 189 reported values should not be interpreted as a count of sovereign states.
The 2025 median was 53.56%, with a long upper tail
Across the 189 reported observations, the mean was 64.78% and the median 53.56%. The first quartile was 38.70% and the third quartile 80.62%, so half of the reported economies fell roughly inside that interval. The mean sits above the median because a relatively small group of very high ratios stretches the distribution upward. Hong Kong SAR, Djibouti, and Slovenia all exceeded 200%, while several other economies were well above 100%.
There were 24 economies above 100% and another 24 below 30%. That symmetry in counts is useful: very high trade-to-GDP ratios are not the norm, but neither are they isolated anomalies. Very low ratios also occur across a meaningful set of economies. The spread can reflect differences in domestic-market size, manufacturing and processing networks, port and logistics roles, cross-border supply chains, and the relative size of GDP. The ratio itself cannot identify which factor dominates in any one economy.
Hong Kong SAR, Djibouti, and Slovenia led the 2025 ranking
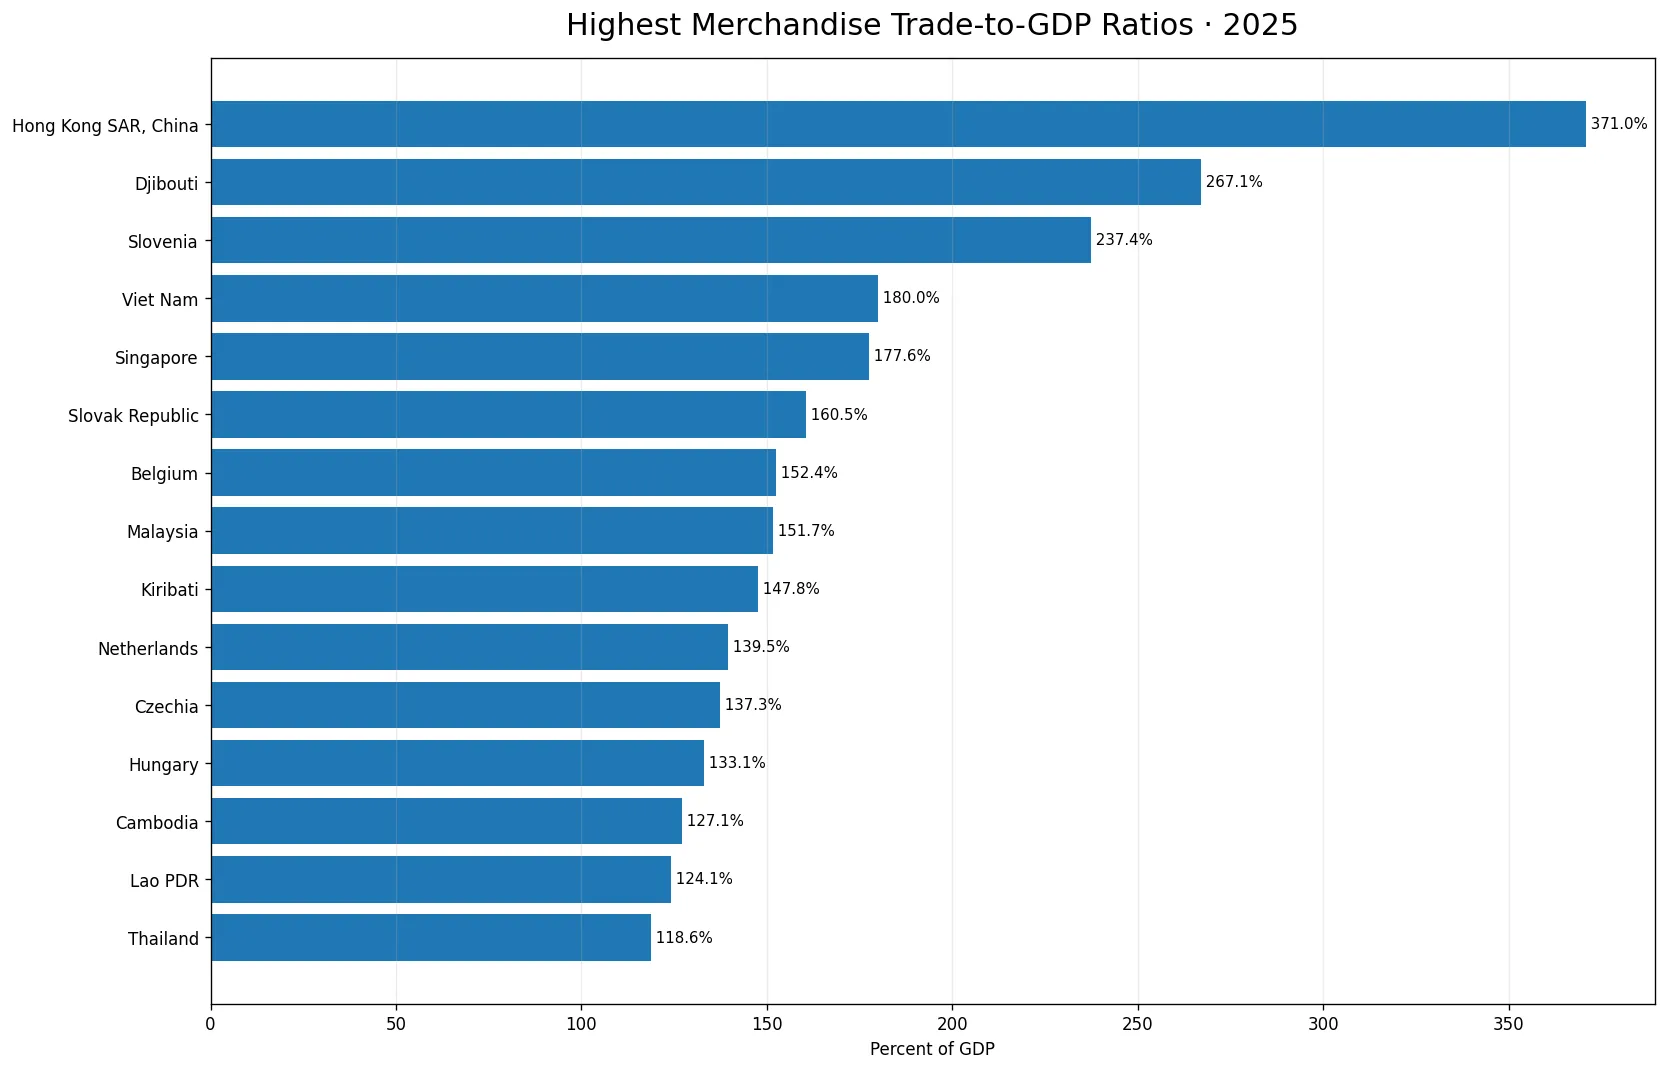
Hong Kong SAR had the highest reported ratio at 371.02%, followed by Djibouti at 267.14% and Slovenia at 237.45%. Viet Nam was 180.05%, Singapore 177.64%, the Slovak Republic 160.52%, Belgium 152.43%, Malaysia 151.73%, Kiribati 147.75%, and the Netherlands 139.54%. The top group therefore contains trade hubs, small open economies, and economies deeply integrated into manufacturing and logistics networks.
A ratio such as 371.02% is arithmetically possible because imports and exports are counted as gross flows. Goods can be imported as intermediate inputs, processed or assembled, and later exported. Re-export hubs can also record large import and export flows relative to the domestic value added generated locally. GDP, by contrast, does not count the full gross value of every border crossing as domestic production. The difference between gross flows and value added is the key reason that merchandise trade can exceed GDP by a large margin.
Top 10 reported ratios
| Country or economy | Merchandise trade / GDP |
|---|---|
| Hong Kong SAR, China | 371.02% |
| Djibouti | 267.14% |
| Slovenia | 237.45% |
| Viet Nam | 180.05% |
| Singapore | 177.64% |
| Slovak Republic | 160.52% |
| Belgium | 152.43% |
| Malaysia | 151.73% |
| Kiribati | 147.75% |
| Netherlands | 139.54% |
Even within the top 10, the spread is substantial. The tenth-ranked Netherlands was at 139.54%, while Hong Kong SAR was more than 230 percentage points higher. That gap shows why a simple “above 100%” label can hide important differences. Some economies sit moderately above GDP, while a few process merchandise flows several times the size of annual domestic value added.
Low ratios do not necessarily mean little trade in absolute terms
The lowest reported ratios were Sudan at 14.96%, Haiti at 16.15%, and the United States at 18.50%. Niger was 21.25%, Kenya 22.23%, Afghanistan 22.24%, Venezuela 22.48%, Sao Tome and Principe 22.52%, Comoros 23.09%, and Pakistan 23.67%. A low ratio does not mean that an economy has negligible merchandise trade. A very large GDP denominator can produce a low percentage even when imports and exports are large in absolute currency terms.
The United States illustrates the denominator effect. Its merchandise trade can be enormous in absolute terms while still being a relatively small percentage of a very large GDP. The reverse can hold for a smaller economy: its absolute trade value may be far lower, but the combined exports and imports can be large relative to domestic output. For that reason, this indicator is best used to compare relative trade intensity, not the absolute size of merchandise trade.
Why values above 100% are not data errors
GDP measures domestic value added. Merchandise trade measures the gross value of goods moving across borders through exports and imports. Those flows can include imported inputs, exported final goods, and re-exported products. Because the numerator counts both directions of merchandise trade while the denominator measures domestic production, there is no accounting rule that caps the ratio at 100%. Open, small, or hub economies can therefore report ratios far above 100% without any contradiction.
The interpretation should be stated precisely. Hong Kong SAR at 371.02% means merchandise exports plus imports were equivalent to 371.02% of its GDP in 2025. It does not mean merchandise trade generated 371.02% of GDP, nor does it measure the contribution of net exports to economic growth. Questions about trade balance, value-added contribution, or national-income accounting require different indicators.
The map shows relative intensity, not absolute trade size
The choropleth colors countries and economies by merchandise trade divided by GDP. A dark-shaded small economy is therefore not necessarily trading more goods in absolute terms than a large economy with a lighter shade. China was 32.59%, Japan 33.68%, Germany 65.47%, and the United Kingdom 37.59%. Those values differ considerably even though all four are major economies with substantial external trade.
This is the main benefit of a ratio: it standardizes merchandise trade by the size of domestic output and makes economies of very different scale more comparable. The trade-off is that the ratio can move because of changes in either the numerator or the denominator. A rise may come from stronger exports or imports, a smaller GDP denominator, price changes, exchange-rate movements, or a combination. One year alone cannot identify the mechanism.
Missing 2025 observations remain missing
The country-and-economy master contains 217 entries, but 189 have a reported 2025 value for TG.VAL.TOTL.GD.ZS and 28 do not. The missing entries were not converted to zero. Treating them as zero would falsely imply an absence of merchandise trade and would distort the ranking, average, median, and map. All descriptive statistics in this article use the 189 observed values only.
Using a single common year improves cross-sectional comparability, but it is not a substitute for a time series. Merchandise values and nominal GDP can both change with economic conditions, commodity prices, exchange rates, and domestic demand. A structural assessment of trade openness should therefore examine several years and related indicators. The 2025 comparison answers a narrower question: how large were gross merchandise exports and imports relative to GDP in the same reported year?
How to combine this ratio with other trade measures
Merchandise trade-to-GDP is useful for measuring the scale of goods trade relative to domestic output, but it does not reveal whether a country ran a trade surplus or deficit because exports and imports are added together. Separate export and import ratios, merchandise balances, and current-account indicators are needed for direction. The ratio also excludes services, which can be critical for economies specializing in tourism, finance, transport, software, or professional services.
For economic structure, the most informative sequence is to use this ratio as a first screen and then add absolute merchandise exports and imports, product composition, GDP size, and service-trade measures. A high ratio can be consistent with deep supply-chain integration or a logistics-hub role, while a low ratio can be consistent with a large domestic market. Neither end of the scale is an automatic judgment of economic quality.
What stands out in the 2025 distribution
The central fact in 2025 is the breadth of the distribution. The median among reporting economies was 53.56%, but the range ran from 14.96% to 371.02%. Twenty-four economies were above 100%, and 24 were below 30%. The upper tail includes several economies where cross-border merchandise flows are very large relative to domestic value added; the lower tail includes both lower-income economies and very large domestic markets.
The map and ranking are therefore best read as a comparison of relative merchandise-trade intensity. They do not rank economies by the quality of their trade policy, productivity, competitiveness, or welfare. Understanding the numerator as gross exports plus imports and the denominator as GDP makes the extreme values much easier to interpret and prevents a common mistake: treating a trade-to-GDP ratio as if it were a share of GDP produced by trade.
Frequently Asked Questions
Can merchandise trade exceed 100% of GDP?
Yes. The numerator adds merchandise exports and imports, while GDP measures domestic value added. Open and hub economies can therefore have ratios well above 100%.
Which economy had the highest ratio in 2025?
Hong Kong SAR had the highest reported value at 371.02%, followed by Djibouti at 267.14% and Slovenia at 237.45%.
Does a higher ratio mean a larger absolute trade value?
No. This is a relative measure scaled by GDP. Absolute merchandise exports and imports are needed to compare trade size directly.
Related Articles
Green Map creates custom-edited map images using open geographic data sources such as geoBoundaries, Natural Earth, OpenStreetMap, and government open data. These maps are edited visual materials, not raw data files, and are provided for education, documents, presentations, and graphic reference.