The share of females ages 15–19 varies widely across countries and economies in 2025. Among 217 World Bank observations for indicator SP.POP.1519.FE.5Y, South Sudan has the highest value at 12.46%, while Hong Kong SAR, China has the lowest at 3.40%. The median is 7.58%. In a typical observation, roughly 7 to 8 out of every 100 females are therefore in the 15–19 age band.
The denominator is the total female population, not the total population. A value of 10% means that about 10 of every 100 females in that country or economy are ages 15–19. Males are not part of the denominator, and females ages 10–14 or 20–24 are not part of the numerator. The indicator is best read as the relative thickness of one five-year cohort within the female age structure.
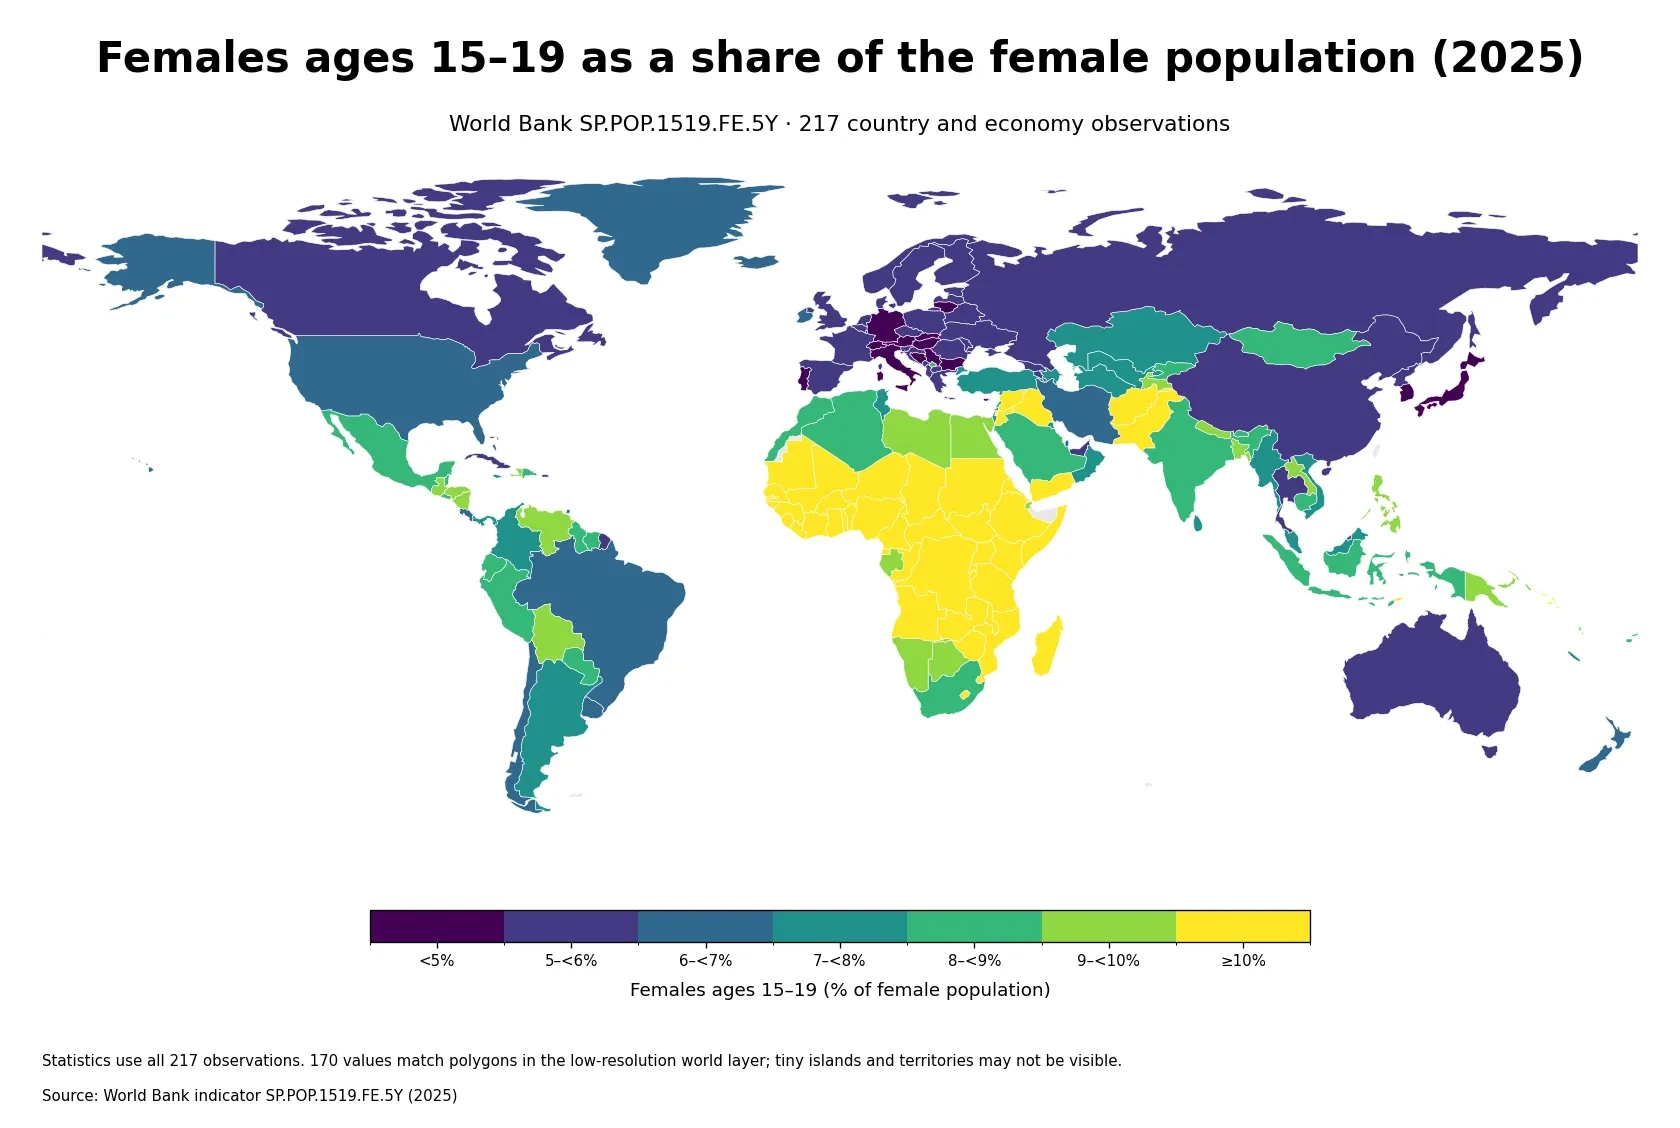
Table of Contents
High shares extend across several parts of Africa
The clearest spatial pattern is the concentration of high values across numerous African countries. South Sudan leads at 12.46%, followed by the Central African Republic at 11.79%, Burundi at 11.73%, Eritrea at 11.69%, Malawi at 11.68%, Kenya at 11.46%, Uganda at 11.44%, and Mali at 11.37% among the top ten. Because high observations appear across eastern, central, and western Africa, the pattern is broader than a single small subregion.
The indicator itself does not identify one cause for these high shares. The percentage reflects the size of the cohort born roughly 15 to 19 years earlier, age-specific survival, migration, and the size of every other female age group in the denominator. A causal explanation would require additional birth, mortality, and migration data rather than the 2025 cross-section alone.
The Marshall Islands stands out within an Africa-heavy top group
The Marshall Islands is the most conspicuous geographic exception near the top. Its 2025 share is 12.43%, the second-highest observation after South Sudan. This shows why continent-level averages cannot reliably predict an individual country or economy: a small Pacific island economy can have a female age structure that resembles the highest-share observations elsewhere.
Sao Tome and Principe, another island country, is also high at 11.48%. Yet a large percentage does not imply a large absolute number of teenage females. A populous country with an 8% share may contain far more females ages 15–19 than a small island economy with a 12% share. Percentages answer a composition question; headcounts answer a scale question.
Low values cluster in parts of East Asia and Europe
At the low end, Hong Kong SAR, China records 3.40%, Macao SAR, China 3.87%, and Monaco 3.92%. Malta follows at 4.32%, Korea, Rep. at 4.32%, Japan at 4.36%, Germany at 4.42%, Austria at 4.62%, Lithuania at 4.65%, and Portugal at 4.65%. Several East Asian and European observations therefore appear together near the bottom, although neither region is uniform.
A low share is not a positive or negative performance score. It simply means that females ages 15–19 make up a smaller portion of the female population. That can happen when older age groups are relatively large, when the birth cohort entering ages 15–19 is smaller, or when migration changes the numerator or denominator. The indicator does not separate those mechanisms.
The gap between the highest and lowest values is about 9.06 percentage points
The difference between South Sudan at 12.46% and Hong Kong SAR, China at 3.40% is 9.06 percentage points. The highest value is about 3.7 times the lowest. In practical terms, one place has close to one female in eight in this five-year age band, while another has roughly one in thirty.
| Top rank | Country or economy | Share | Bottom rank | Country or economy | Share |
|---|---|---|---|---|---|
| 1 | South Sudan | 12.46% | 1 | Hong Kong SAR, China | 3.40% |
| 2 | Marshall Islands | 12.43% | 2 | Macao SAR, China | 3.87% |
| 3 | Central African Republic | 11.79% | 3 | Monaco | 3.92% |
| 4 | Burundi | 11.73% | 4 | Malta | 4.32% |
| 5 | Eritrea | 11.69% | 5 | Korea, Rep. | 4.32% |
| 6 | Malawi | 11.68% | 6 | Japan | 4.36% |
| 7 | Sao Tome and Principe | 11.48% | 7 | Germany | 4.42% |
| 8 | Kenya | 11.46% | 8 | Austria | 4.62% |
| 9 | Uganda | 11.44% | 9 | Lithuania | 4.65% |
| 10 | Mali | 11.37% | 10 | Portugal | 4.65% |
These rankings are not rankings of the number of females ages 15–19. Each percentage uses a different total female population as its denominator. A large country can have a mid-range percentage and still have a much larger teenage female population than a small economy at the top of the table. Planning for schools or youth services requires age-specific headcounts in addition to this composition measure.
The middle half of observations runs from 5.83% to 10.03%
Across all 217 observations, the mean is 7.81% and the median is 7.58%. The first quartile is 5.83% and the third quartile is 10.03%, so the middle half of the distribution spans roughly 5.83% to 10.03%. That wide interquartile range shows why one global average cannot describe the diversity of female age structures.
There are 55 observations (25.3%) at 10% or more, almost one quarter of the dataset. At the other extreme, 21 observations (9.7%) are below 5%. Double-digit shares and sub-5% shares therefore both represent substantial parts of the global country-and-economy distribution.
| Share band | Countries and economies | Share of observations |
|---|---|---|
| Under 5% | 21 | 9.7% |
| 5% to under 6% | 45 | 20.7% |
| 6% to under 7% | 26 | 12.0% |
| 7% to under 8% | 24 | 11.1% |
| 8% to under 9% | 25 | 11.5% |
| 9% to under 10% | 21 | 9.7% |
| 10% or more | 55 | 25.3% |
Ages 15–19 is only one slice of the wider adolescent population
The 15–19 band is often useful in discussions of adolescence and transitions into adulthood, but this indicator does not include every person who might be described as an adolescent or youth. Females ages 10–14 are outside the numerator, as are women ages 20 and older. A claim about the total adolescent or youth population needs neighboring age groups rather than this five-year band alone.
The measure also contains no information on school enrollment, employment, or activity status. A 17-year-old is counted solely because of age and sex, regardless of whether she is in school, employed, unemployed, or outside the labor force. Education or labor-market analysis requires separate enrollment, attainment, labor-force participation, employment, and unemployment indicators.
The cohort moves into the next age band over time
A 15–19 cohort is temporary by definition. The females who are 15–19 in 2025 will move into ages 20–24, while today’s 10–14 cohort will eventually replace them. A high 2025 share should therefore not be treated as a permanent characteristic. Different-sized cohorts moving through the age structure can materially change the map within a few years.
A trend requires multiple years of the same indicator. Even then, a higher percentage does not automatically mean that the number of females ages 15–19 increased. The numerator can decline while the share rises if the total female population declines faster, and the number can rise while the share falls if other female age groups grow even more quickly.
The female denominator matters when comparing the indicator with male age shares
A male indicator for ages 15–19 can be compared with this female indicator to study differences in age composition by sex, but the two percentages use different denominators. A 7% female share and an 8% male share cannot be converted directly into a statement that there are more 15–19-year-old males than females. Absolute age-specific populations are required for that comparison.
The same denominator issue matters across countries. An economy with a relatively large older female population may have a modest 15–19 share even when the teenage cohort is sizeable in headcount terms. Conversely, a younger age structure can make a similar headcount occupy a much larger share. The percentage should always be read as part of the entire female age distribution.
The 217 statistical observations exceed the number of visible map polygons
The World Bank country-and-economy series includes sovereign states as well as separately reported territories and economies. Hong Kong, Macao, and a number of small island jurisdictions have their own observations. The total of 217 should therefore not be interpreted as the number of sovereign countries in the world.
The low-resolution boundary layer used for the display matches 170 of the 217 observations to visible polygons by ISO3 code. Many unmatched records correspond to tiny islands or territories that are not practical polygons at this world scale. Their values remain included in every ranking, quartile, mean, median, range, and distribution count.
Data source and calculation
The analysis uses 2025 observations from the World Bank API series SP.POP.1519.FE.5Y. The World Bank indicator page provides the definition and country-level time series. The unit is females ages 15–19 as a percentage of the total female population.
Aggregate regional and income-group rows are excluded. All 217 country-and-economy rows contain a 2025 value, so no missing value is replaced with zero and no earlier year is substituted. The maximum, minimum, rankings, mean, median, quartiles, range, and percentage-band counts are calculated directly from those 217 values. The boundary layer is used only to visualize the observations and does not determine statistical inclusion.
Frequently Asked Questions
What does a 10% share for females ages 15–19 mean?
It means about 10 of every 100 females in that country or economy are ages 15–19. It does not mean that 10% of the total population consists of females in that age group.
Does a high 15–19 female share mean the total youth population is large?
Not necessarily. This indicator covers one five-year female cohort only. A broader youth-population assessment needs neighboring age groups, males, and preferably absolute population counts.
Can the 2025 value show whether the share will rise or fall?
No. A trend requires multiple years of the same indicator and separate attention to changes in the number of females ages 15–19 and changes in the total female population.
Related Maps
Green Map creates custom-edited map images using open geographic data sources such as geoBoundaries, Natural Earth, OpenStreetMap, and government open data.
These maps are edited visual materials, not raw data files, and are provided for education, documents, presentations, and graphic reference.