Independent power producers used markedly different amounts of fuel energy for electricity generation across U.S. states in 2025. In the EIA Electric Power Operational Data series defined by fuel=ALL, sector=94 and consumption-for-eg-btu, Texas recorded 2,915.096 million MMBtu, equal to 21.11% of the 51-jurisdiction sum. Pennsylvania and Illinois followed. The measure is an energy-input indicator, not electricity output, so it should be read as the amount of fuel energy consumed for generation by independent power producers rather than as net generation or final electricity demand.
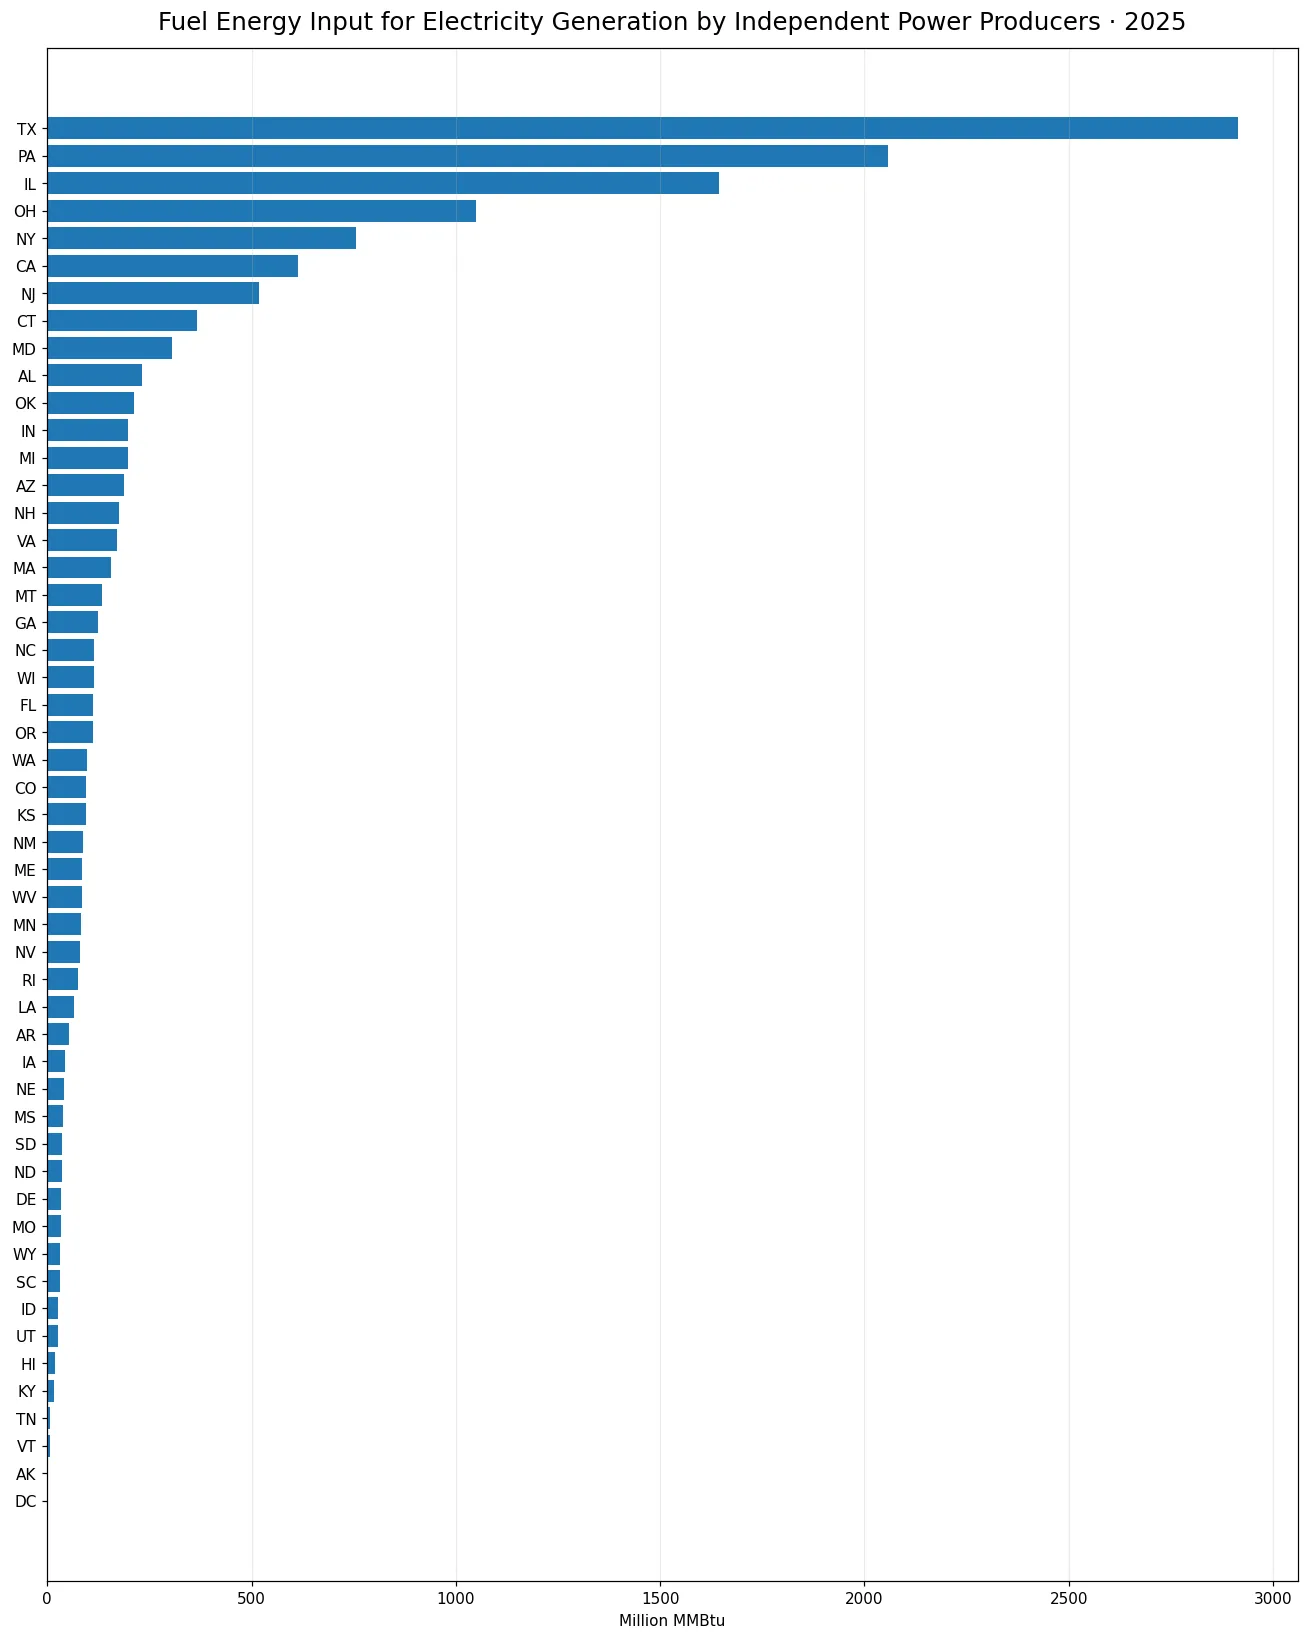
Table of Contents
What this EIA measure captures
The series measures the heat-equivalent energy content of fuels consumed for electricity generation by independent power producers. EIA publishes fuel use in both physical units and energy units. The energy version is useful when multiple fuels are combined because coal, natural gas, petroleum products and renewable fuels are originally measured in different physical units. Here, fuel=ALL aggregates the eligible fuel categories and expresses the result in million MMBtu. Sector 94 limits the scope to Independent Power Producers rather than the entire electric power industry.
The field name also matters. consumption-for-eg-btu refers specifically to fuel used for electricity generation. It is therefore different from total-consumption-btu, which can include energy used for useful thermal output as well as generation. A state can have similar values in the two series when useful-thermal use is small, but that does not make the definitions interchangeable. Keeping the field identity explicit prevents a common mistake when comparing adjacent EIA operational series.
Texas, Pennsylvania and Illinois represented nearly half of the total
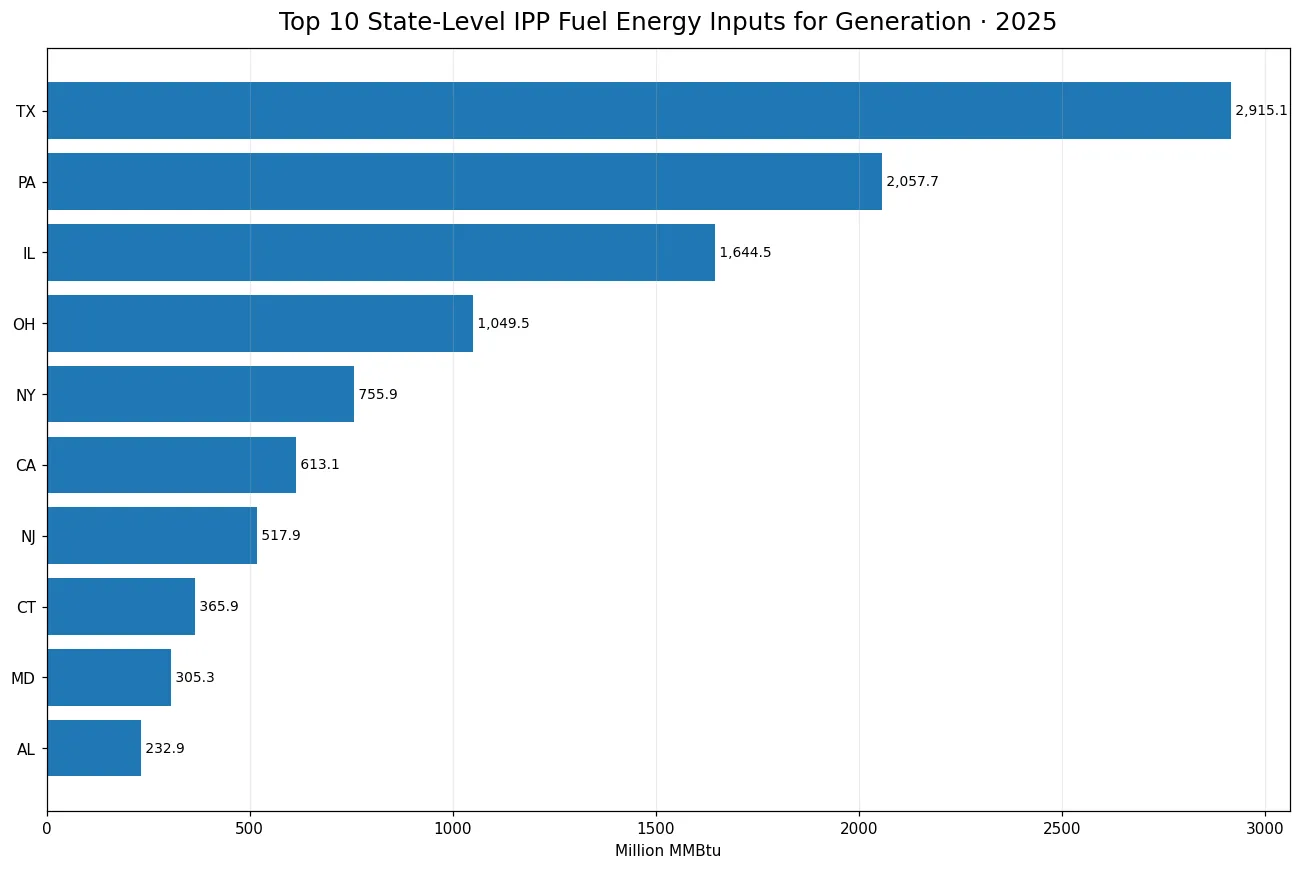
The sum of the 51 state-level observations was 13,806.147 million MMBtu. Texas led with 2,915.096 million MMBtu, or 21.11% of that sum. Pennsylvania contributed 2,057.740 million MMBtu (14.90%), and Illinois contributed 1,644.499 million MMBtu (11.91%). Together, those three states accounted for 47.93% of the observed total. The concentration is large enough that national patterns in this particular IPP sector are heavily influenced by a small number of states.
Ohio ranked next at 1,049.516 million MMBtu, followed by New York at 755.864, California at 613.066, and New Jersey at 517.861. These figures describe the scale of fuel energy input, not the number of power plants. Capacity, operating hours, fuel mix, technology and market structure can all influence the observed amount, and the present series by itself does not isolate those causes.
The top 10 states accounted for most of the observed energy input
The 10 largest state values represented 75.75% of the 51-jurisdiction sum. Connecticut, Maryland and Alabama also appeared in the top group. The median state value was 94.355 million MMBtu, while the mean was 270.709 million MMBtu. The much higher mean is a sign that the distribution is right-skewed: a few very large observations pull the average upward while many states lie well below it.
This is why a single average does not describe the typical state very well. The median shows the middle of the distribution, while the top-10 share shows concentration. Used together, these measures reveal both the overall scale and the uneven geographic distribution of fuel energy input among independent power producers.
Every state and the District of Columbia had a positive value
All 51 jurisdictions in the 2025 comparison had positive observations. There were no missing values and no reported zeros; the smallest value was 0.16539 million MMBtu. That complete coverage makes the state-level sum straightforward to calculate for this comparison. Still, a small value should not be interpreted as evidence that the state has a small electricity system overall, because this series covers only independent power producers in sector 94.
The relative importance of independent power producers differs across state electricity markets. Utility-owned generation, public power and other producer categories can account for different shares of generation depending on the state. The metric therefore works best as a detailed sectoral measure rather than as a stand-alone ranking of each state’s entire power industry.
Why MMBtu is useful when all fuels are combined
MMBtu stands for million British thermal units. Physical fuel measures are not directly additive: natural gas is commonly tracked by volume, coal by mass, and petroleum by barrels or related physical units. Converting each fuel to its heat content allows EIA to express mixed fuel use on a common energy basis. That is what makes a fuel=ALL comparison meaningful across states.
Energy input is not the same as electricity output. Two states can consume the same amount of fuel energy and produce different amounts of electricity because generation technologies, heat rates and operating conditions differ. A true efficiency comparison would need an output measure that matches the same plants, sector, period and scope. The present analysis therefore avoids treating MMBtu as a proxy for MWh.
How this differs from total fuel consumption
EIA also publishes total-consumption-btu for the same operational data family. That broader field can include fuel energy used to produce useful thermal output in addition to electricity. For questions about total energy input at independent power producer facilities, that series is appropriate. For a narrower question about electricity generation, consumption-for-eg-btu is the more direct measure.
The distinction can matter most where combined heat and power or other useful-thermal activity is present. The difference between generation-only input and total input may provide context about non-electric output, but the difference alone does not identify a specific plant or operational cause. Additional facility or technology data would be needed for that conclusion.
Fuel mix and market structure matter for interpretation
Because fuel=ALL combines multiple fuel types, a large state value does not reveal which fuel caused the result. Texas, Pennsylvania and Illinois may have very different contributions from natural gas, coal, petroleum and renewable energy even when their total energy inputs are compared in the same MMBtu unit. Fuel-specific EIA series are required to decompose the total.
The measure can also reflect the size and use of the independent power producer fleet. Larger capacity, higher utilization or lower conversion efficiency can raise fuel input, but a single cross-sectional observation cannot separate these mechanisms. Multi-year analysis with matched generation and fuel-specific series would be needed to investigate changes and possible drivers more rigorously.
Important limits when reading the state ranking
This is not total U.S. energy consumption, and it is not total electricity consumption. It is fuel energy consumed for electricity generation by independent power producers. It also excludes useful-thermal fuel use that belongs outside the generation-only field. These boundaries are essential because several EIA series have similar names but different sector and field definitions.
The percentage shares in this article are calculated from the sum of the 51 comparable state-level observations. They are descriptive shares for the geographic distribution shown here, not a separately published EIA national-share statistic. Because the source agency can revise historical observations, a later retrieval of the same year may differ slightly from the values reported here.
Source and calculation method
The source is the U.S. Energy Information Administration Electric Power Operational Data annual series for 2025, filtered to fueltypeid=ALL, sectorid=94 and consumption-for-eg-btu. Values are reported in million MMBtu for the 50 states and the District of Columbia. Rankings use the published state values without imputation, and shares divide each state value by the sum of the 51 observations.
The official source is the U.S. Energy Information Administration Electric Power Operational Data. The 51 observations summed to 13,806.147 million MMBtu, with no missing or zero values. Comparisons to other EIA series should keep the same year, sector, fuel scope and field definition aligned before interpreting differences.
Frequently Asked Questions
Which state had the largest IPP fuel energy input for electricity generation in 2025?
Texas ranked first at 2,915.096 million MMBtu, equal to 21.11% of the sum of the 51 state-level observations.
What does consumption-for-eg-btu mean?
It is the EIA measure of fuel energy consumed for electricity generation, expressed here in million MMBtu. It differs from total-consumption-btu, which can also include fuel used for useful thermal output.
Does a larger MMBtu value mean a state generated more electricity?
Not necessarily. Fuel input and electricity output depend on generation technology, heat rate, operating conditions and fuel mix, so the measures should not be treated as equivalent.
Related Articles
Green Map creates custom-edited map images using open geographic data sources such as geoBoundaries, Natural Earth, OpenStreetMap, and government open data. These maps are edited visual materials, not raw data files, and are provided for education, documents, presentations, and graphic reference.